. 2020 Sep 30;10(1):16097.
doi: 10.1038/s41598-020-72432-6.

Accuracy and precision of small saccades

Affiliations

Accuracy and precision of small saccades

Martina Poletti et al. Sci Rep. .

Abstract

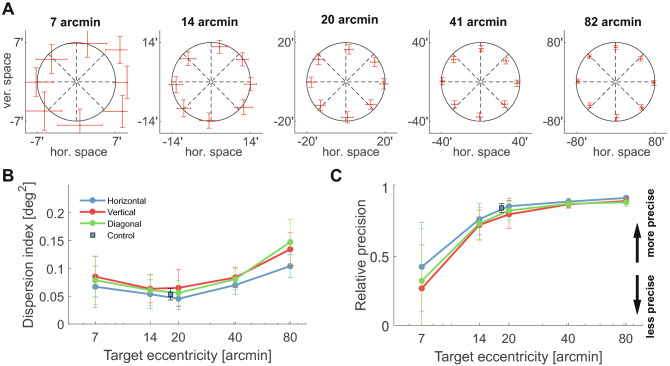
Despite recent advances on the mechanisms and purposes of fine oculomotor behavior, a rigorous assessment of the precision and accuracy of the smallest saccades is still lacking. Yet knowledge of how effectively these movements shift gaze is necessary for understanding their functions and is helpful in further elucidating their motor underpinnings. Using a combination of high-resolution eye-tracking and gaze-contingent control, here we examined the accuracy and precision of saccades aimed toward targets ranging from [Formula: see text] to [Formula: see text] eccentricity. We show that even small saccades of just 14-[Formula: see text] are very effective in centering the stimulus on the retina. Furthermore, we show that for a target at any given eccentricity, the probability of eliciting a saccade depends on its efficacy in reducing the foveal offset. The pattern of results reported here is consistent with current knowledge on the motor mechanisms of microsaccade production.


Conflict of interest statement

The authors declare no competing interests.

Figures

Figure 1
Figure 1
Experimental paradigm. (A) Saccade performance is normally evaluated relative to the displacement between the target (star) and the fixation marker (cross) on the display (gray arrow). This approach does not work well with small saccades, because the normal wandering of the eye (eye drift; red line) displaces the stimulus on the retina by an amount comparable to the saccade itself, so that the resulting offset (black arrow) deviates from the target-fixation vector. (B) In this study, the eye displacement occurring before the target’s onset was eliminated via retinal stabilization. The fixation marker moved with the eye so to remain immobile at the center of the preferred retinal locus of fixation (the center of gaze), and the target appeared at a desired eccentricity from this point. To maintain the normal retinal motion present during saccade preparation, retinal stabilization was turned off at the appearance of the target. (C) Landing positions of saccades executed toward targets at 14 and 40 distance from the center of gaze. Each data point represents a saccade vector color-coded according to the target (yellow dots). Black lines are the average saccades to each target. Data are from one participant.
Figure 2
Figure 2
Saccade accuracy. (A) Saccade landing positions for targets at various distances (7-80; different colors). Each panel shows data for one individual subject, with each dot representing one saccade. Black squares mark target locations. Data from different target angles are realigned along the vertical axis for better visualization. (B) Mean landing error (SE). The average distance between saccade landing and target’s position is plotted as a function of target’s eccentricity (TE). Error bars represent SEM. (C) Index of relative accuracy, defined as 1-SE/TE. Error bars represent SEM. Panels B and C also show results obtained in a control experiment (squares), which relied on precise gaze localization to replicate the standard approach used for larger saccades (Fig. 1A). In this experiment, subjects (N=6) performed saccades toward targets at 20 from an unstabilized fixation marker, but only trials with accurate fixation were selected for data analysis.
Figure 3
Figure 3
Saccade precision. (A) Average dispersion in saccade landing for the same targets as in Fig. 2. The error bars now represent the mean standard deviation of landing error, evaluated for each individual observers and averaged across subjects. Error bars are centered at the mean landing position. (B) Dispersion index (DI), expressed as the area of the 68th percentile ellipsoid in the distribution of landing positions. (C) Index of relative precision, defined as 1-DI/TE, where TE is the target eccentricity. In both B and C, error bars represent SEM. As in Fig. 2, squares refer to data collected in a control experiment with unstabilized fixation marker.
Figure 4
Figure 4
Accuracy in amplitude and direction. Average error in (A) amplitude and (B) direction for saccades aimed toward targets at various eccentricities. Error bars represent SEM.
Figure 5
Figure 5
Precision in amplitude and angle. (A) Decomposition of variability on the two axes parallel and orthogonal to the saccade, σr and σϕ. The black line represents the average saccade trajectory, the red circle gives the position of the target, and the blue dots are the landing positions of individual saccades. The 95% confidence ellipse is also shown. (BE) Values of σr (B), σϕ (C), angular precision (D) and scatter ratio σr/σϕ (E) as a function of target eccentricity. Error bars represent SEM. The three lines refer to saccades in different directions. In (E), the dashed line represents a spherical distribution; the scatter plots are the 2D landing distributions and their 95% confidence ellipses for one subject.
Figure 6
Figure 6
Saccade latencies and probability of occurrence (AC) Saccade reaction times for targets at various eccentricities. (A) Averages across observers for saccades in the three directions. Data points represent medians (circles) and SEM (error bars). (B) Individual subject data (all directions have been grouped together). Error bars represent SEM. (C) Mean reaction times distributions. (D, E) Probability of executing a saccade as a function of the distance of the target. Both averages across observers (D) and the individual subject data (E) are shown. Error bars represent SEM in D and bootstrapped confidence intervals in (E). (F) Probability of executing a saccade as a function of its gain. The saccade gain is the normalized difference between the mean retinal errors in the trials in which target onset did and did not elicit a saccade. Negative/positive gains indicate conditions in which saccades result in larger errors than maintaining fixation via ocular drift. Each point represents the average probability of saccade occurrence and the average gain at a given target eccentricity. The solid line (slope β) is the linear best fit to the data.
Figure 7
Figure 7
Collicular representation predicts microsaccade characteristics. (A) Mapping of visual space from the retina to the superior colliculus. The heatmap shows the representation of a single visuomotor response field in both coordinate systems. This transformation well predicts several characteristics of small saccades. (BE) Comparison of experimental data for horizontal saccades (triangles) to saccade metrics derived from a neural population model that sums activity in a log-polar map (solid lines; see text for details) for targets at various eccentricities on the horizontal meridian. (B) Amplitude accuracy. (C) Amplitude precision. (D) Precision on the axis orthogonal to saccade direction. (E) Scatter ratio.

References

    1. Ko H-K, Poletti M, Rucci M. Microsaccades precisely relocate gaze in a high visual acuity task. Nat. Neurosci. 2010;13:1549–1553. doi: 10.1038/nn.2663. - DOI - PMC - PubMed
    1. Poletti M, Listorti C, Rucci M. Microscopic eye movements compensate for nonhomogeneous vision within the fovea. Curr. Biol. 2013;23:1691–1695. doi: 10.1016/j.cub.2013.07.007. - DOI - PMC - PubMed
    1. Haddad GM, Steinman RM. The smallest voluntary saccade: implications for fixation. Vis. Res. 1973;13:1075–1086. doi: 10.1016/0042-6989(73)90145-4. - DOI - PubMed
    1. Timberlake GT, Wyman D, Skavenski AA, Steinman RM. The oculomotor error signal in the fovea. Vis. Res. 1972;12:1059–1064. doi: 10.1016/0042-6989(72)90027-2. - DOI - PubMed
    1. de Bie J, van den Brink G. Small stimulus movements are necessary for the study of fixational eye movements. In: Gale AG, Johnson F, editors. Theoretical and Applied Aspects of Eye Movement Research. North Holland: Elsevier; 1984.

Publication types