. 2020 Oct;586(7828):299-304.
doi: 10.1038/s41586-020-2774-y. Epub 2020 Sep 30.

Tumoural activation of TLR3-SLIT2 axis in endothelium drives metastasis

Affiliations

Tumoural activation of TLR3-SLIT2 axis in endothelium drives metastasis

Bernardo Tavora et al. Nature. 2020 Oct.

Abstract

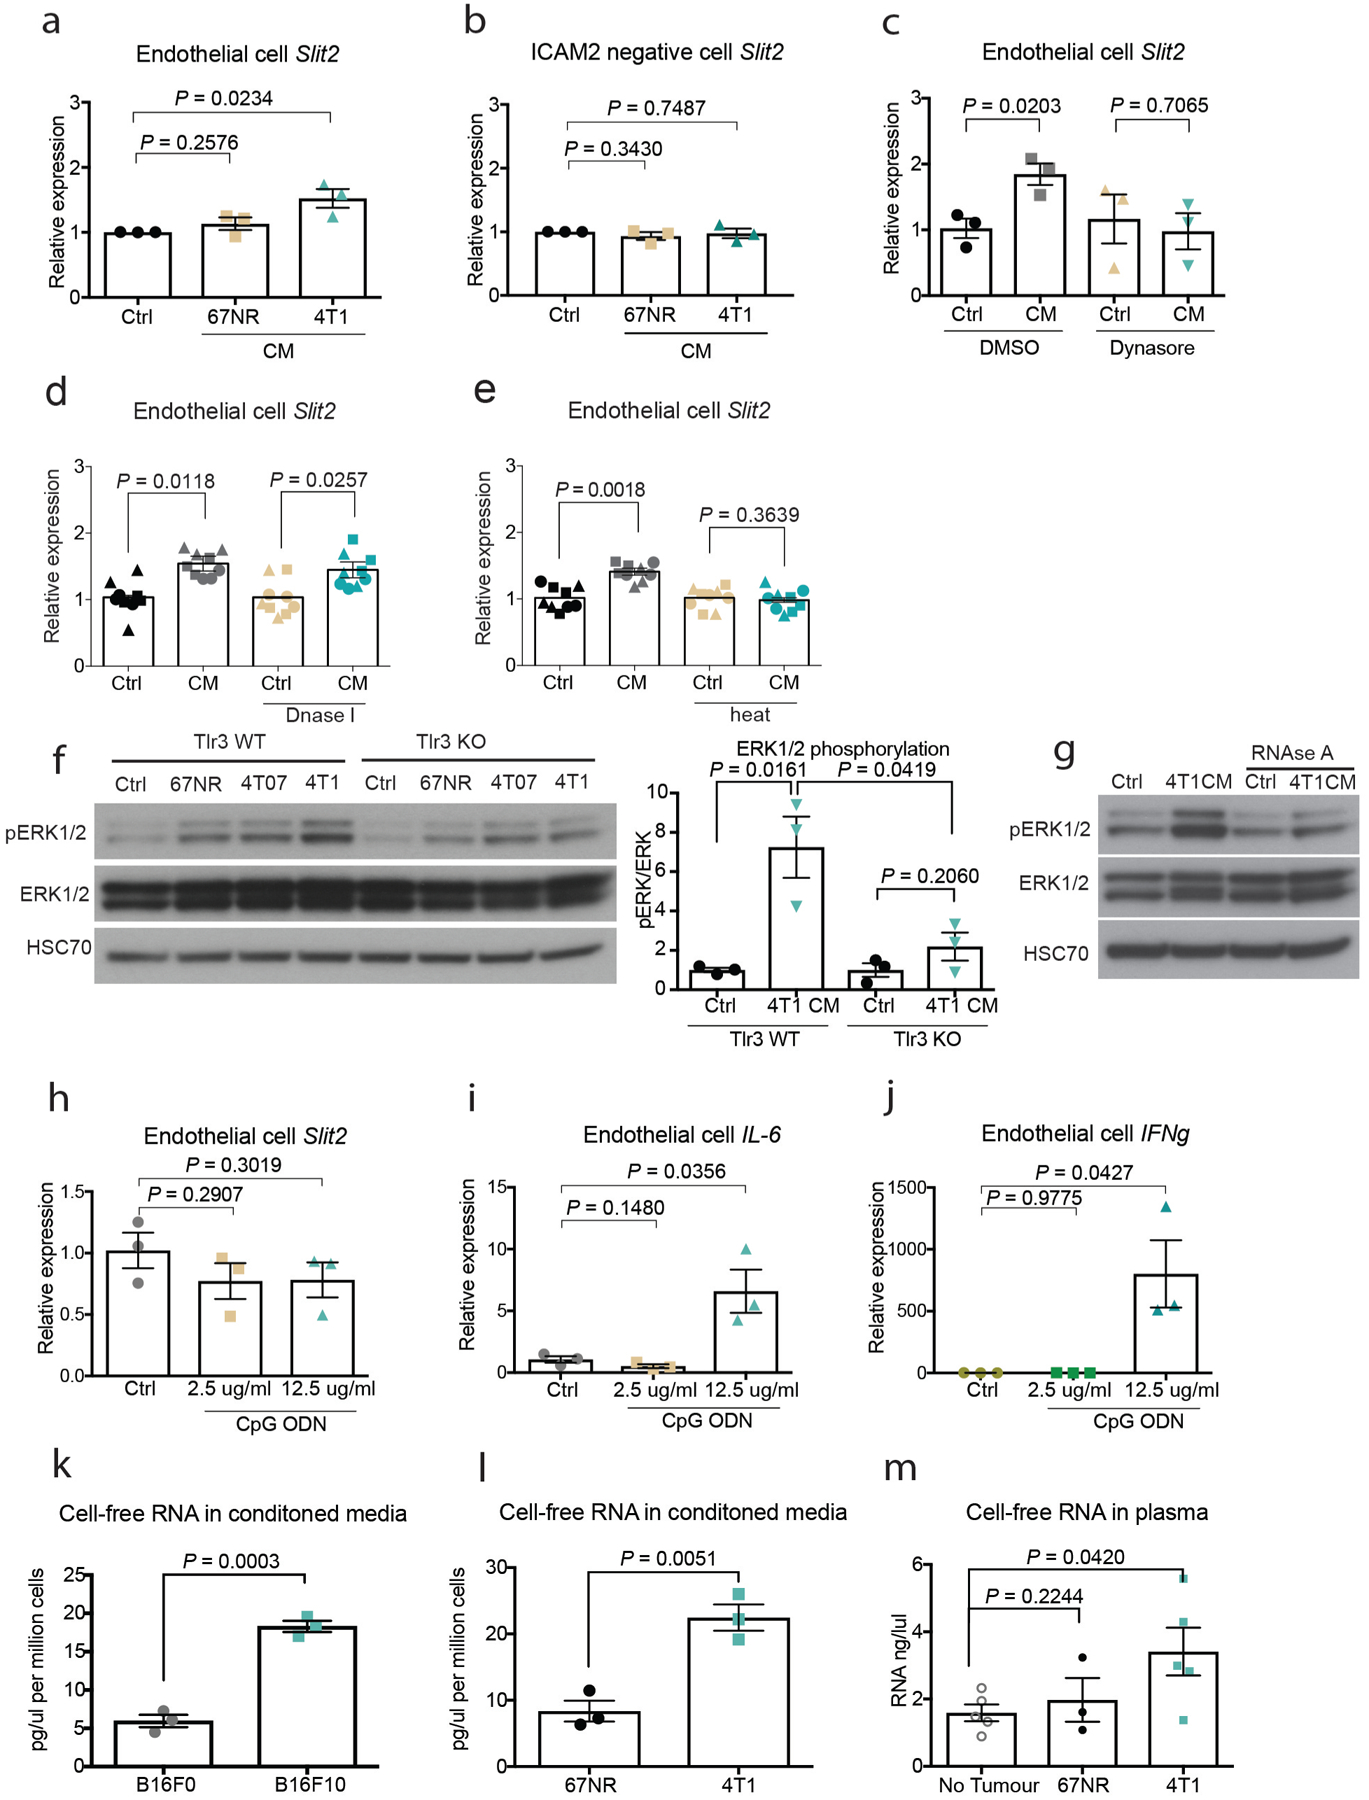
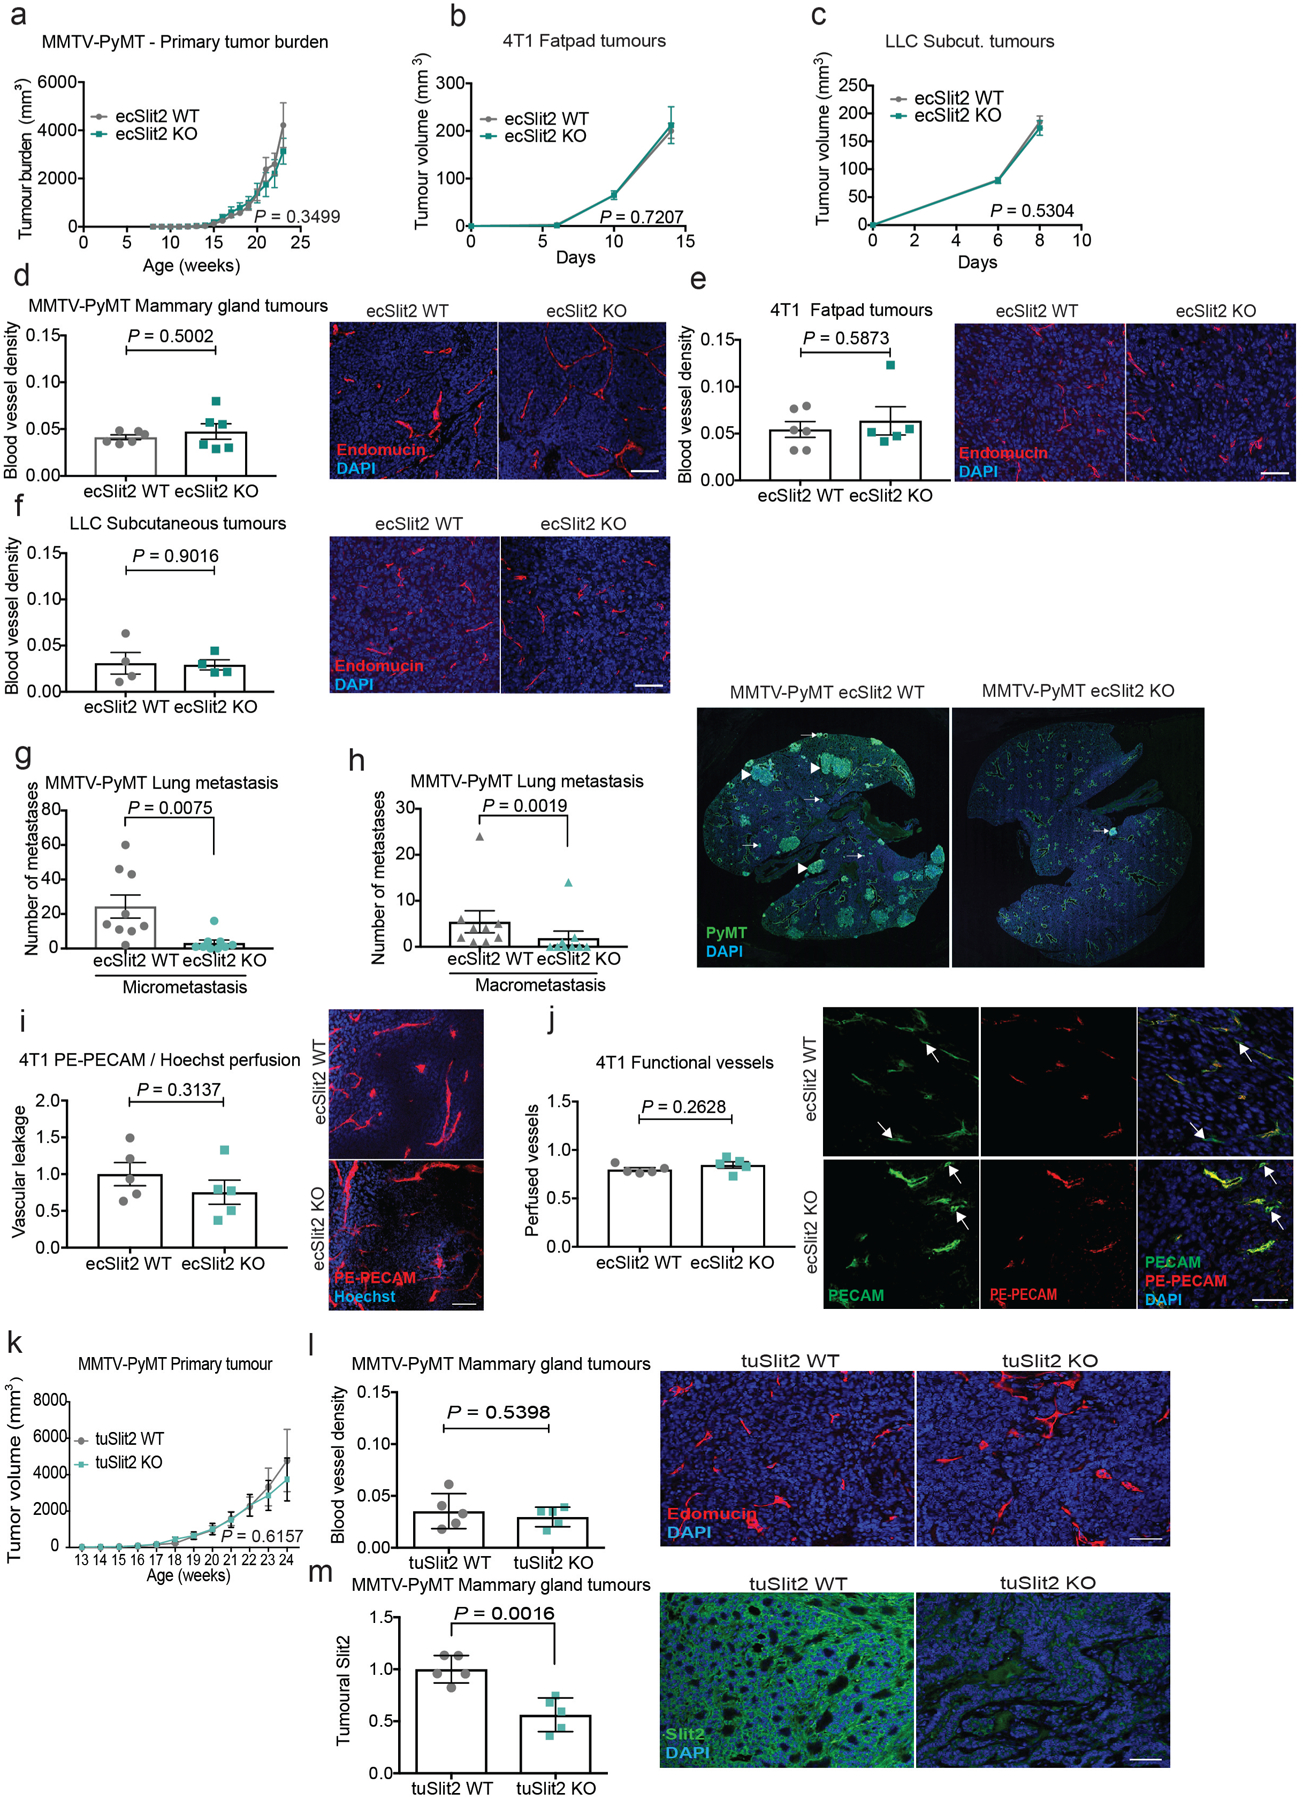
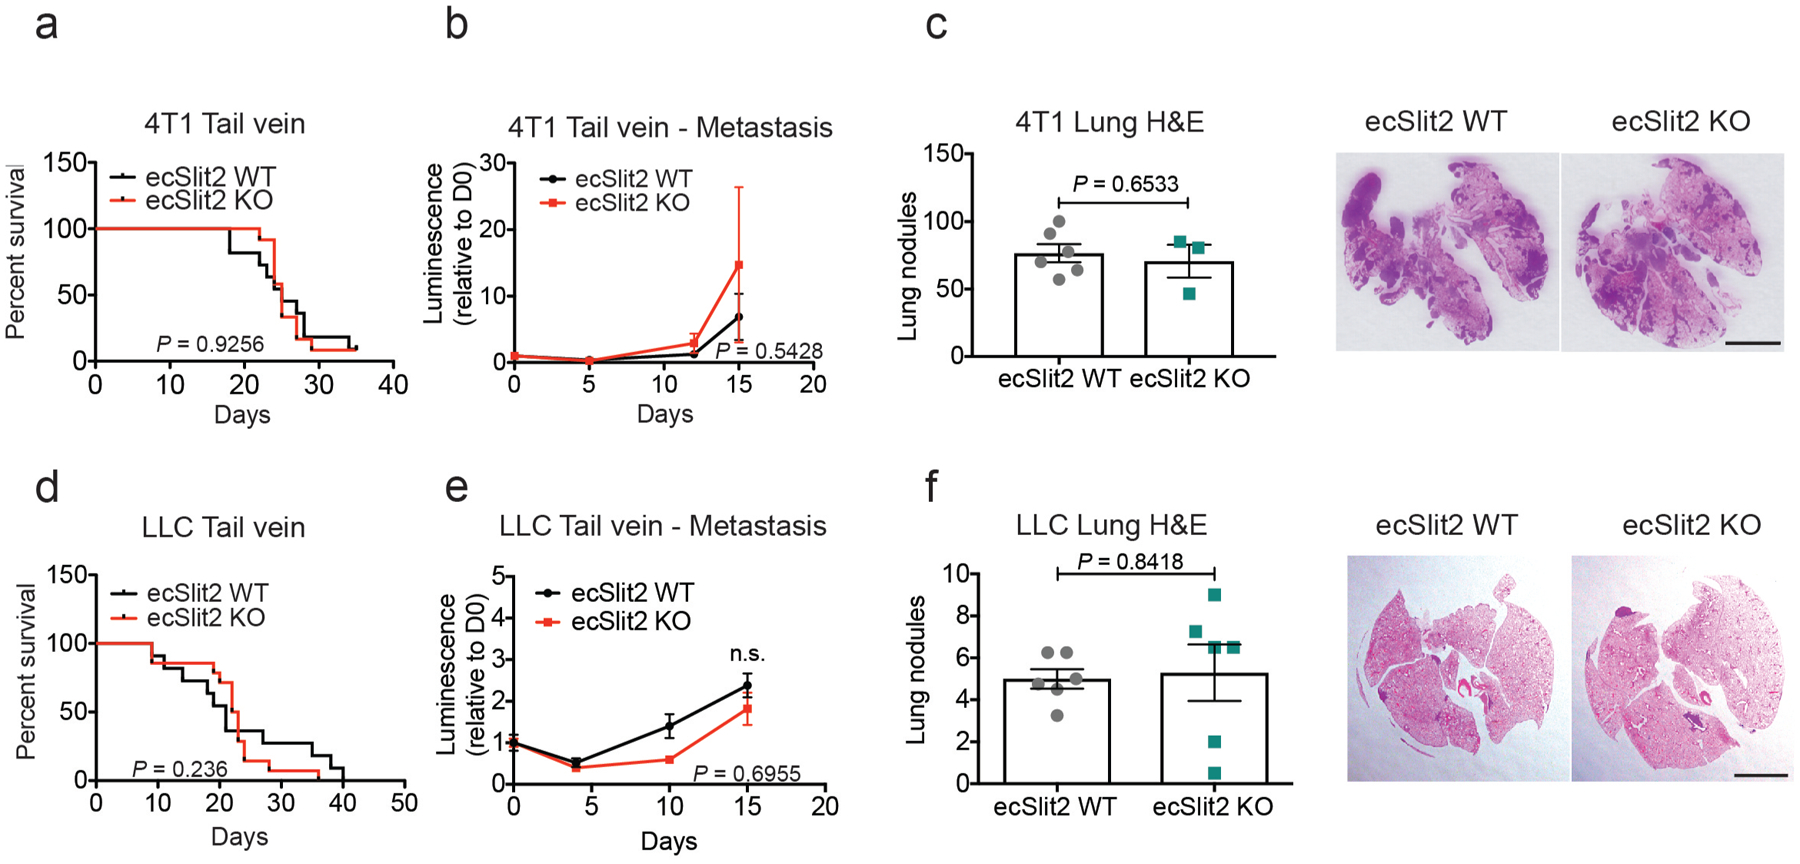
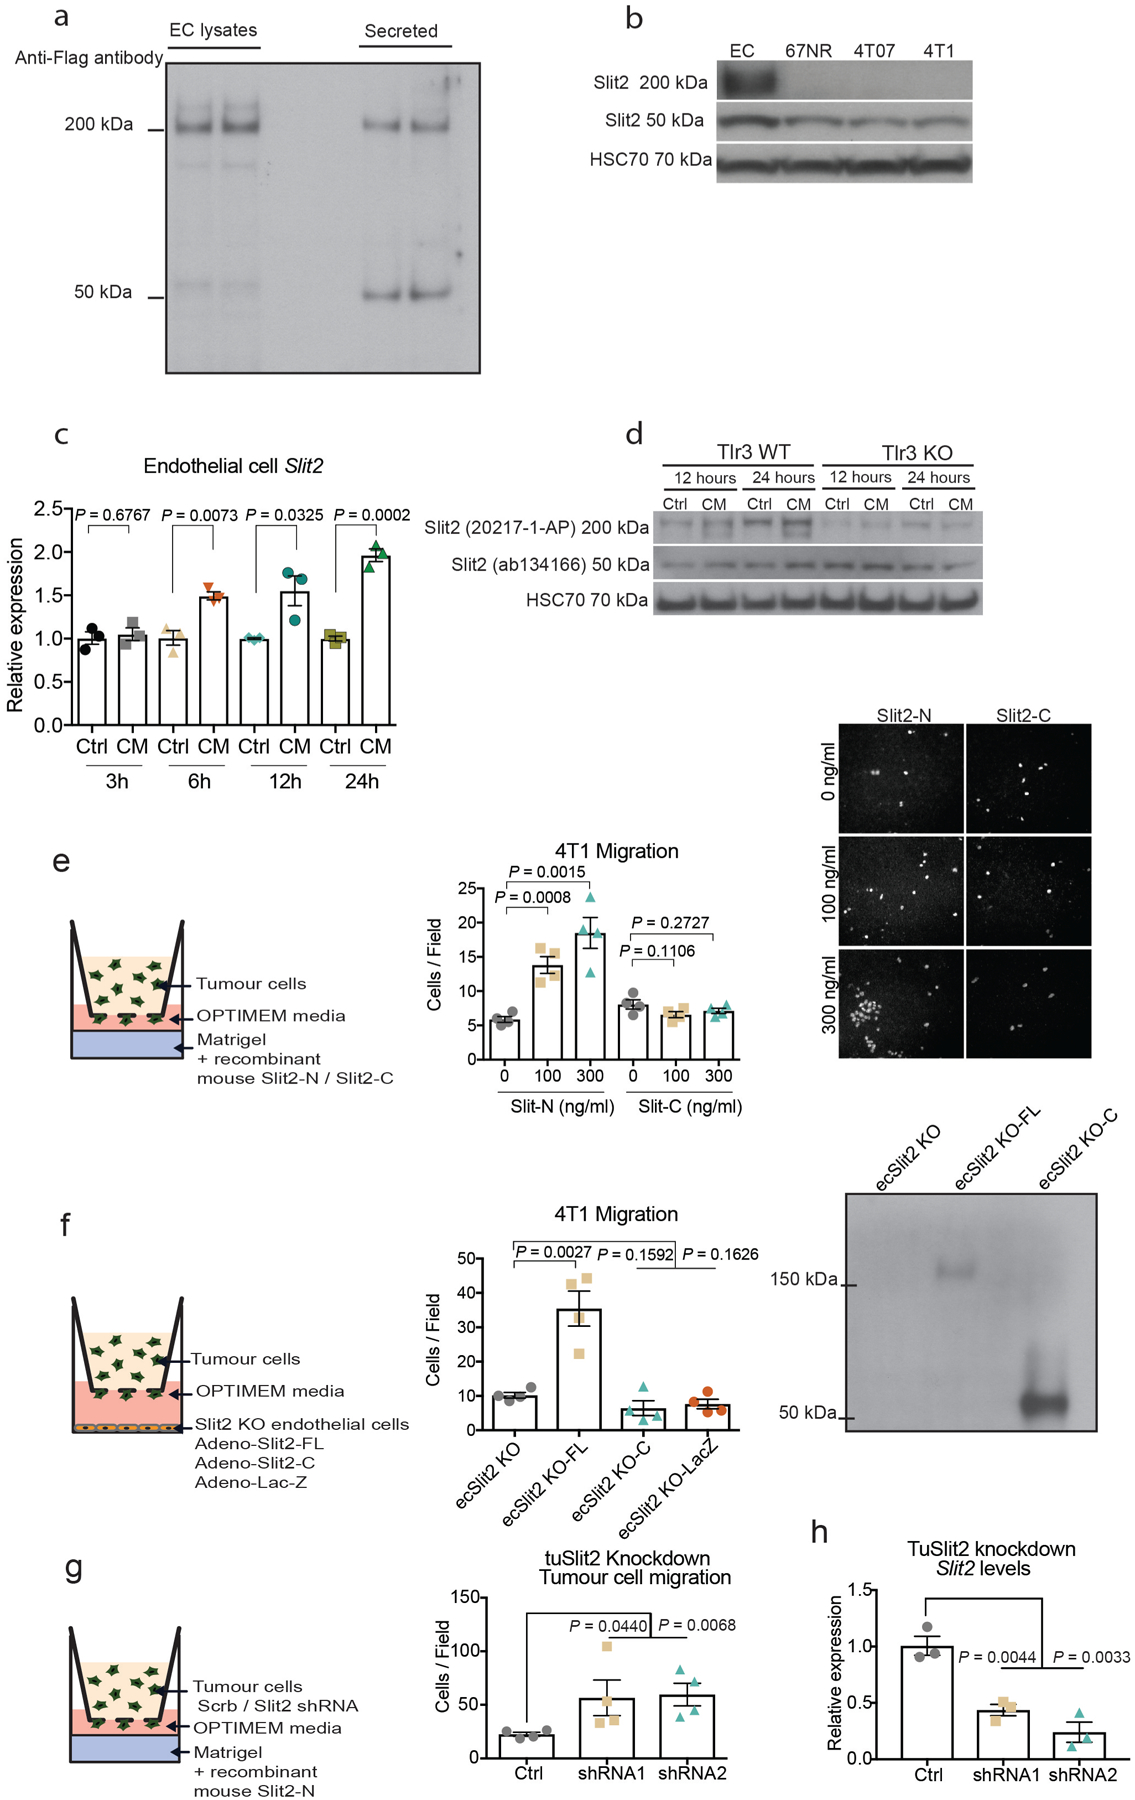
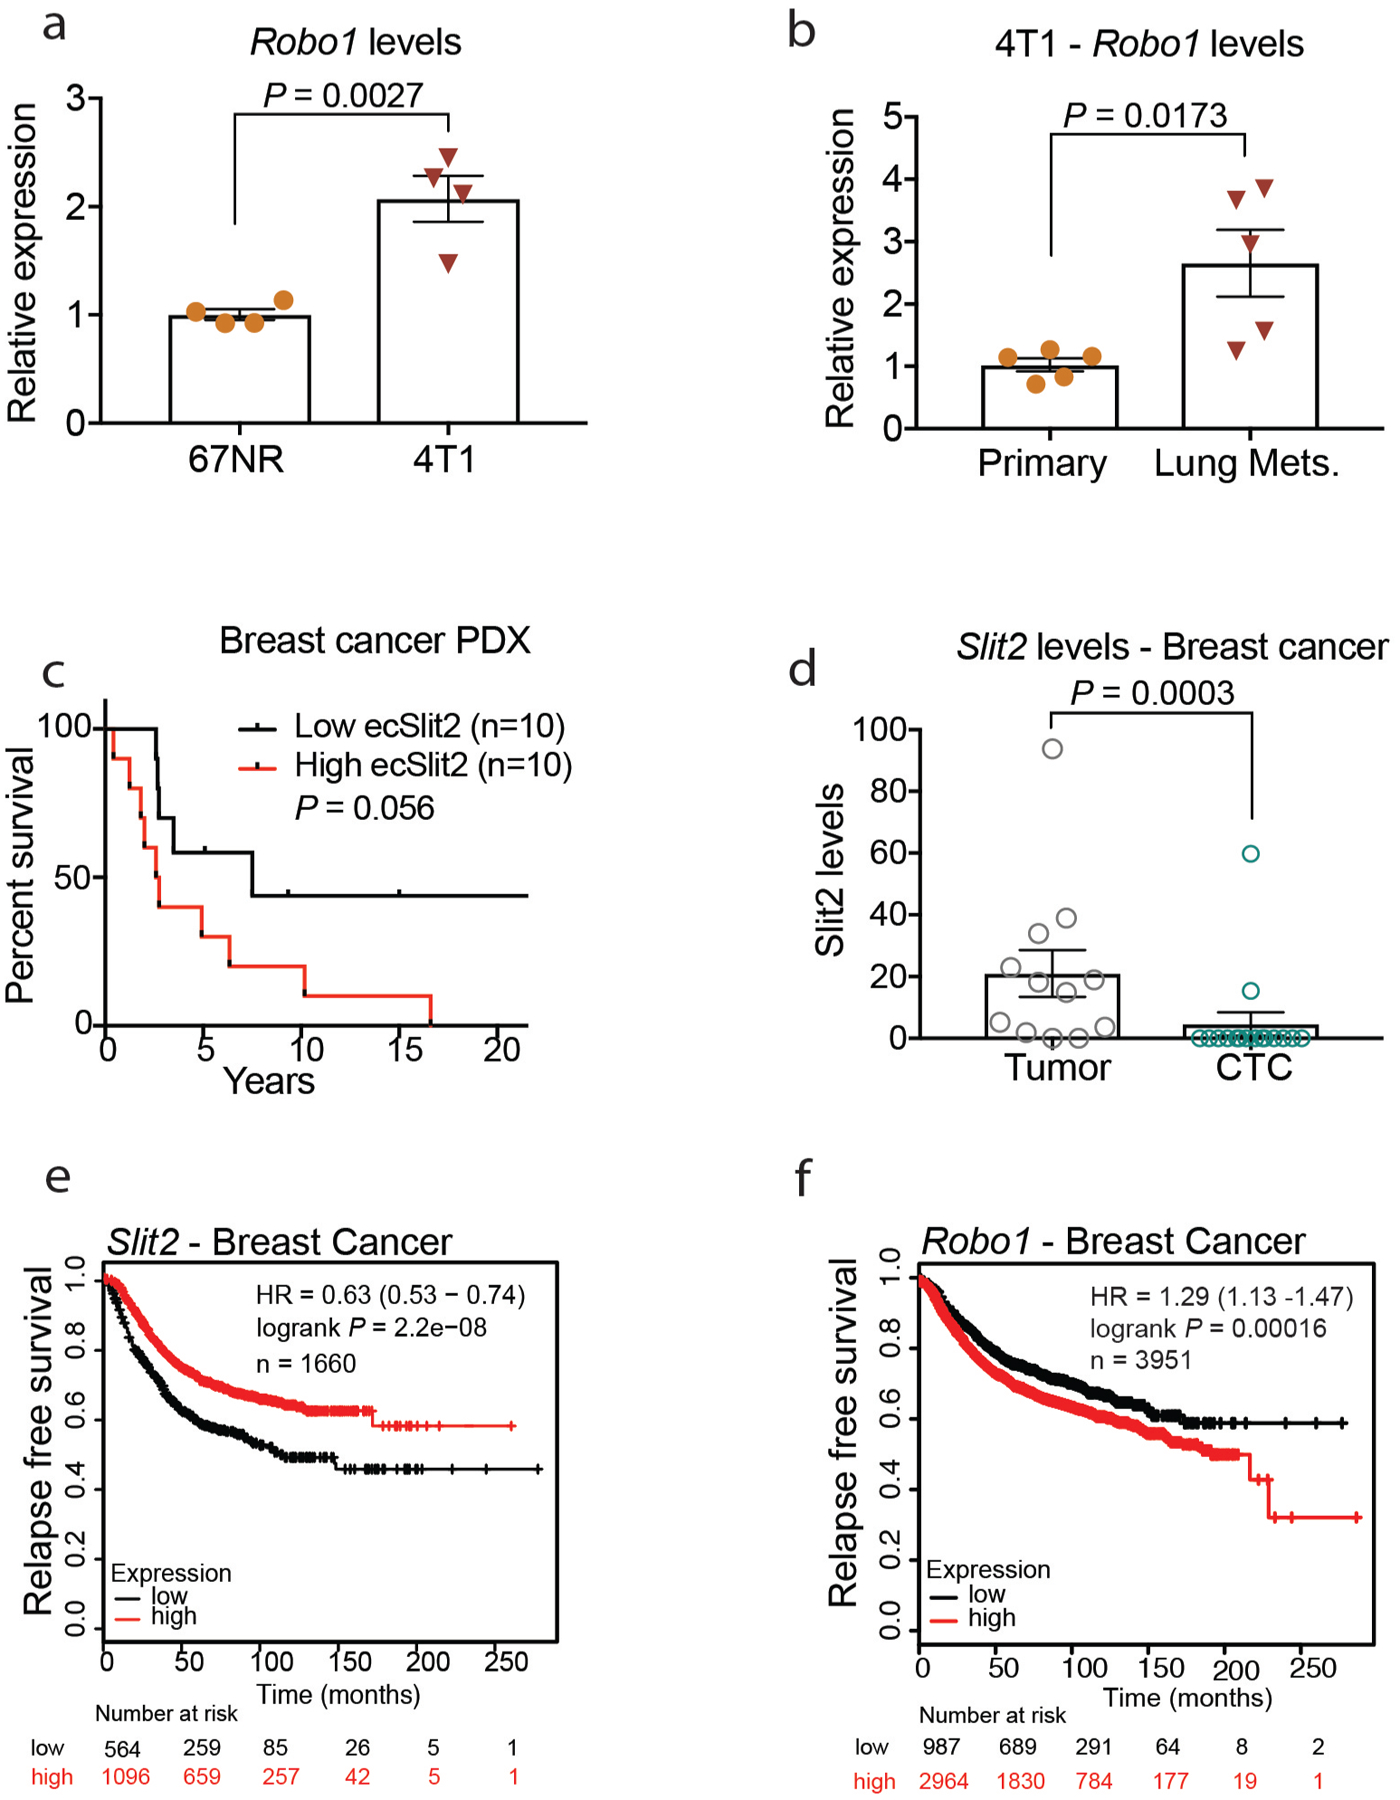
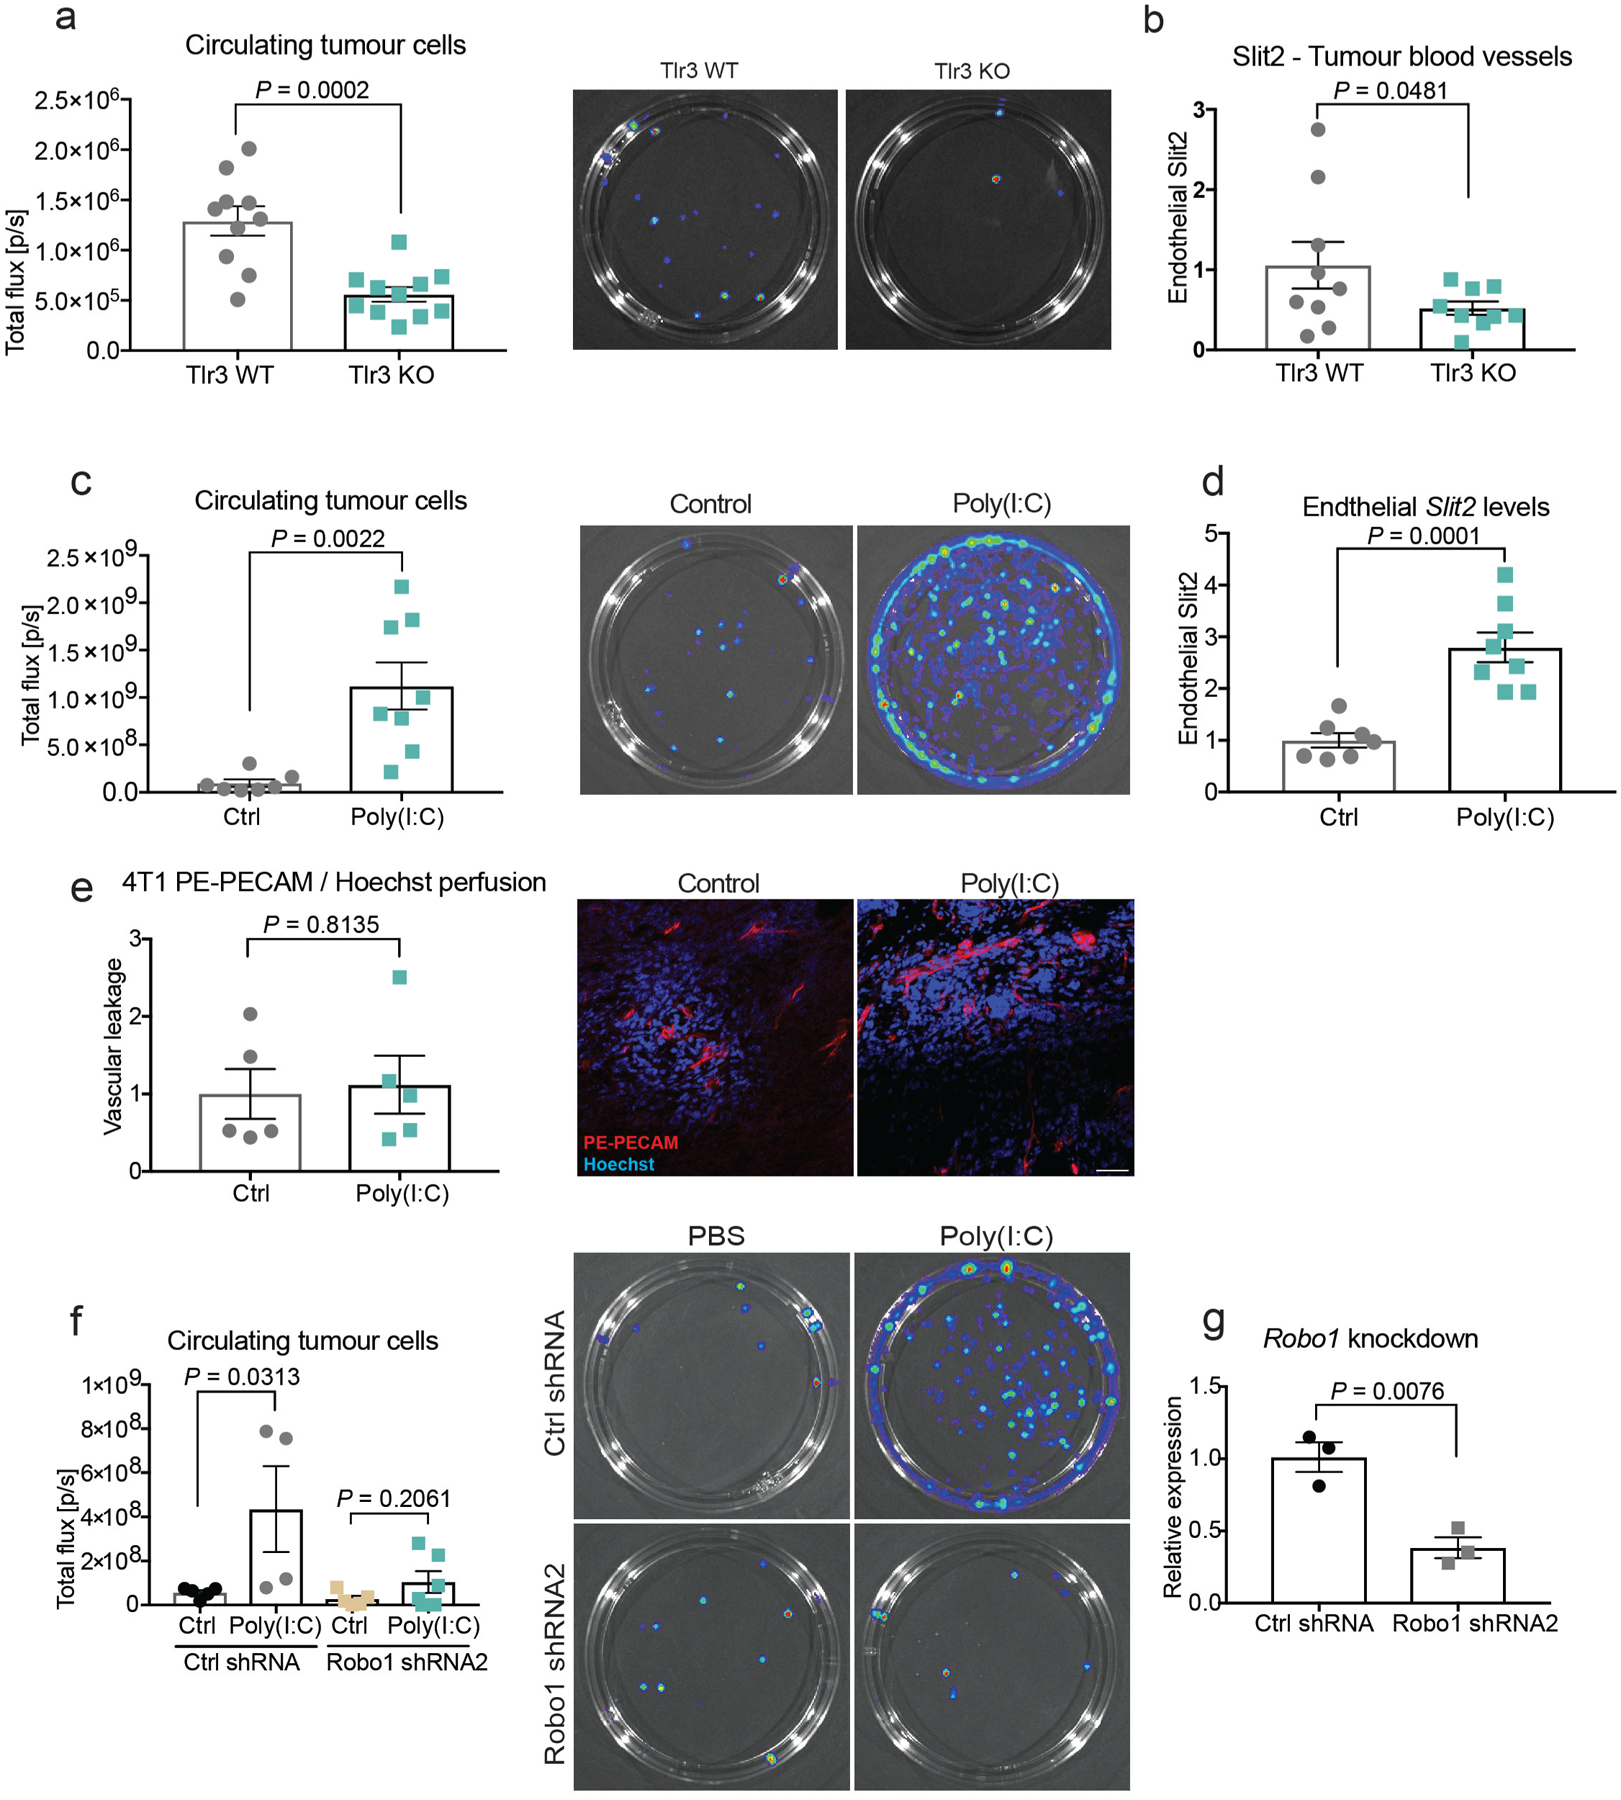
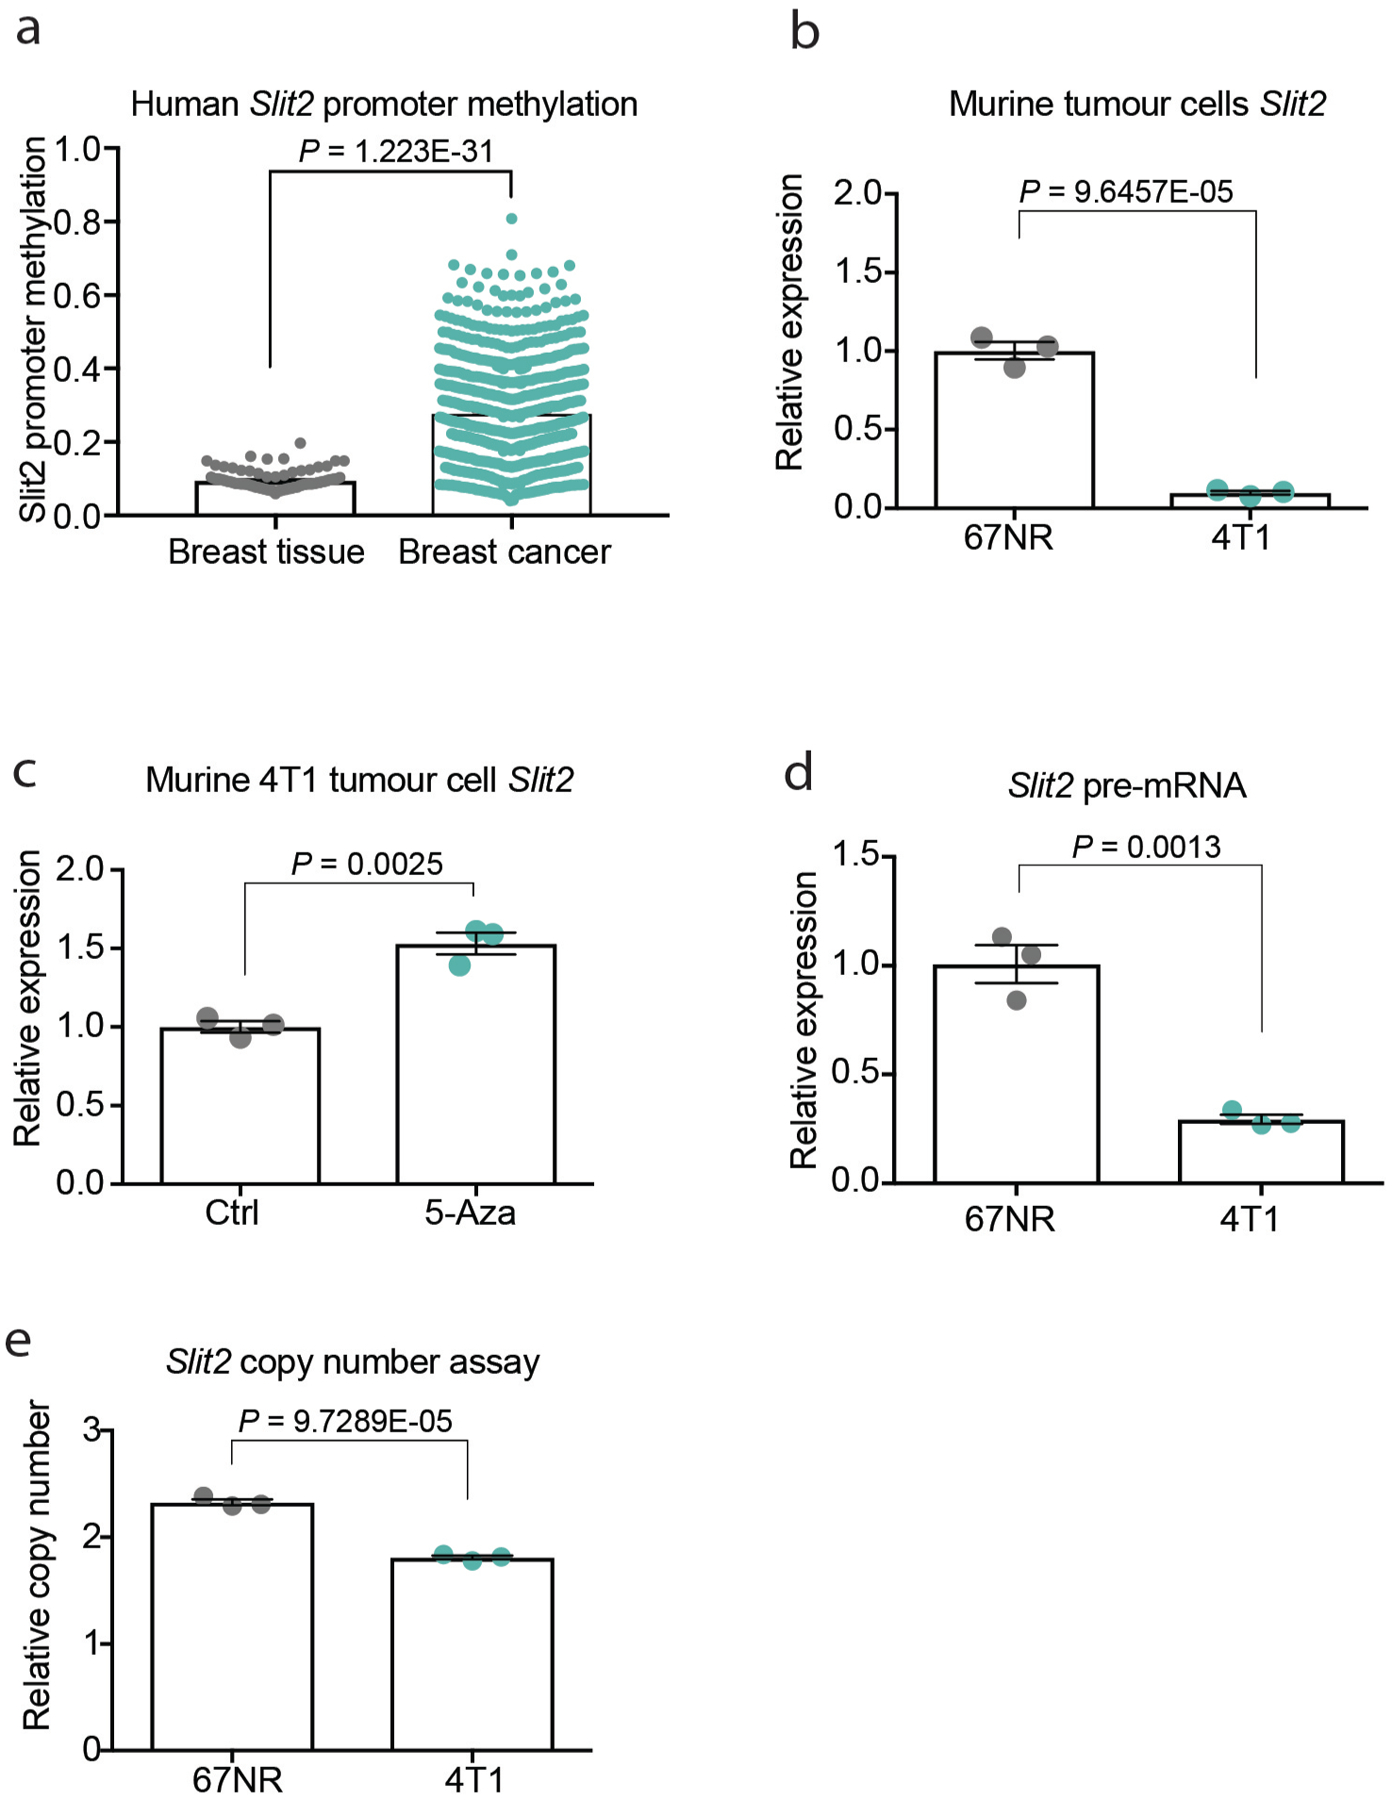
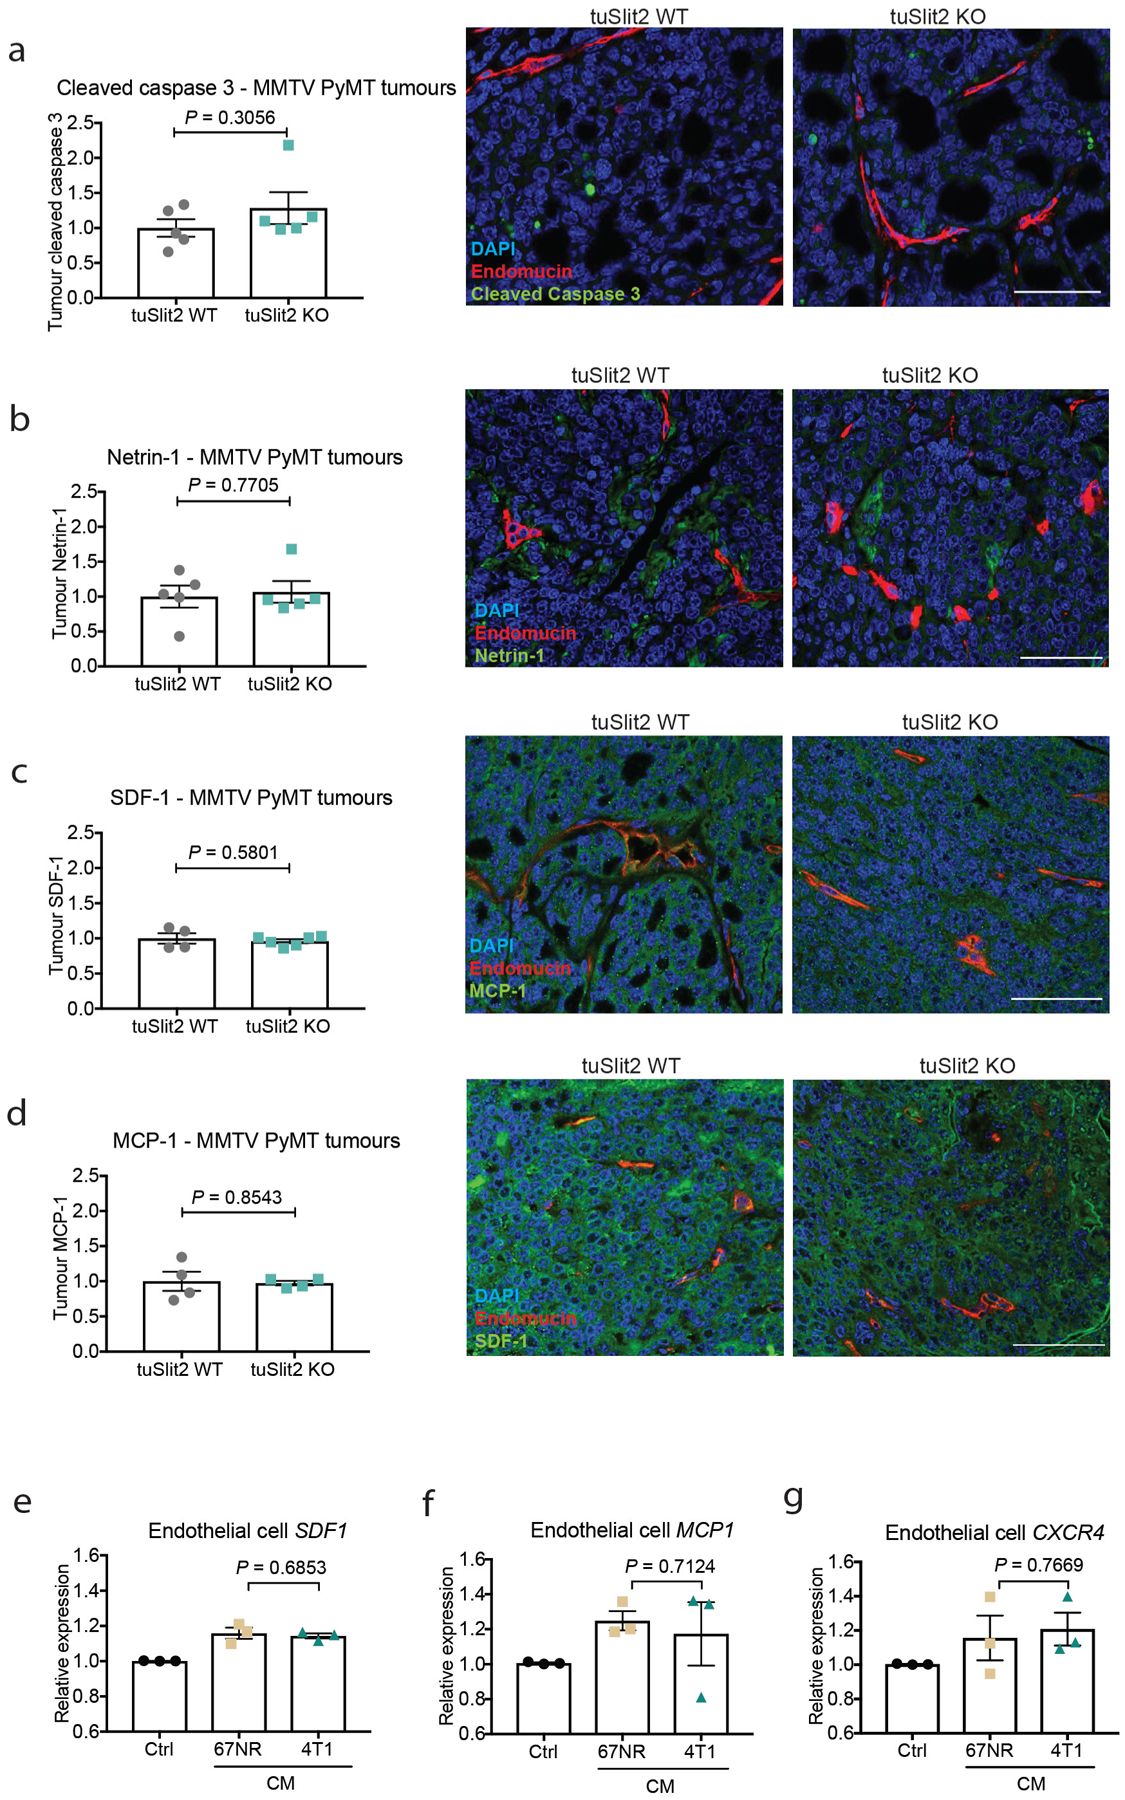
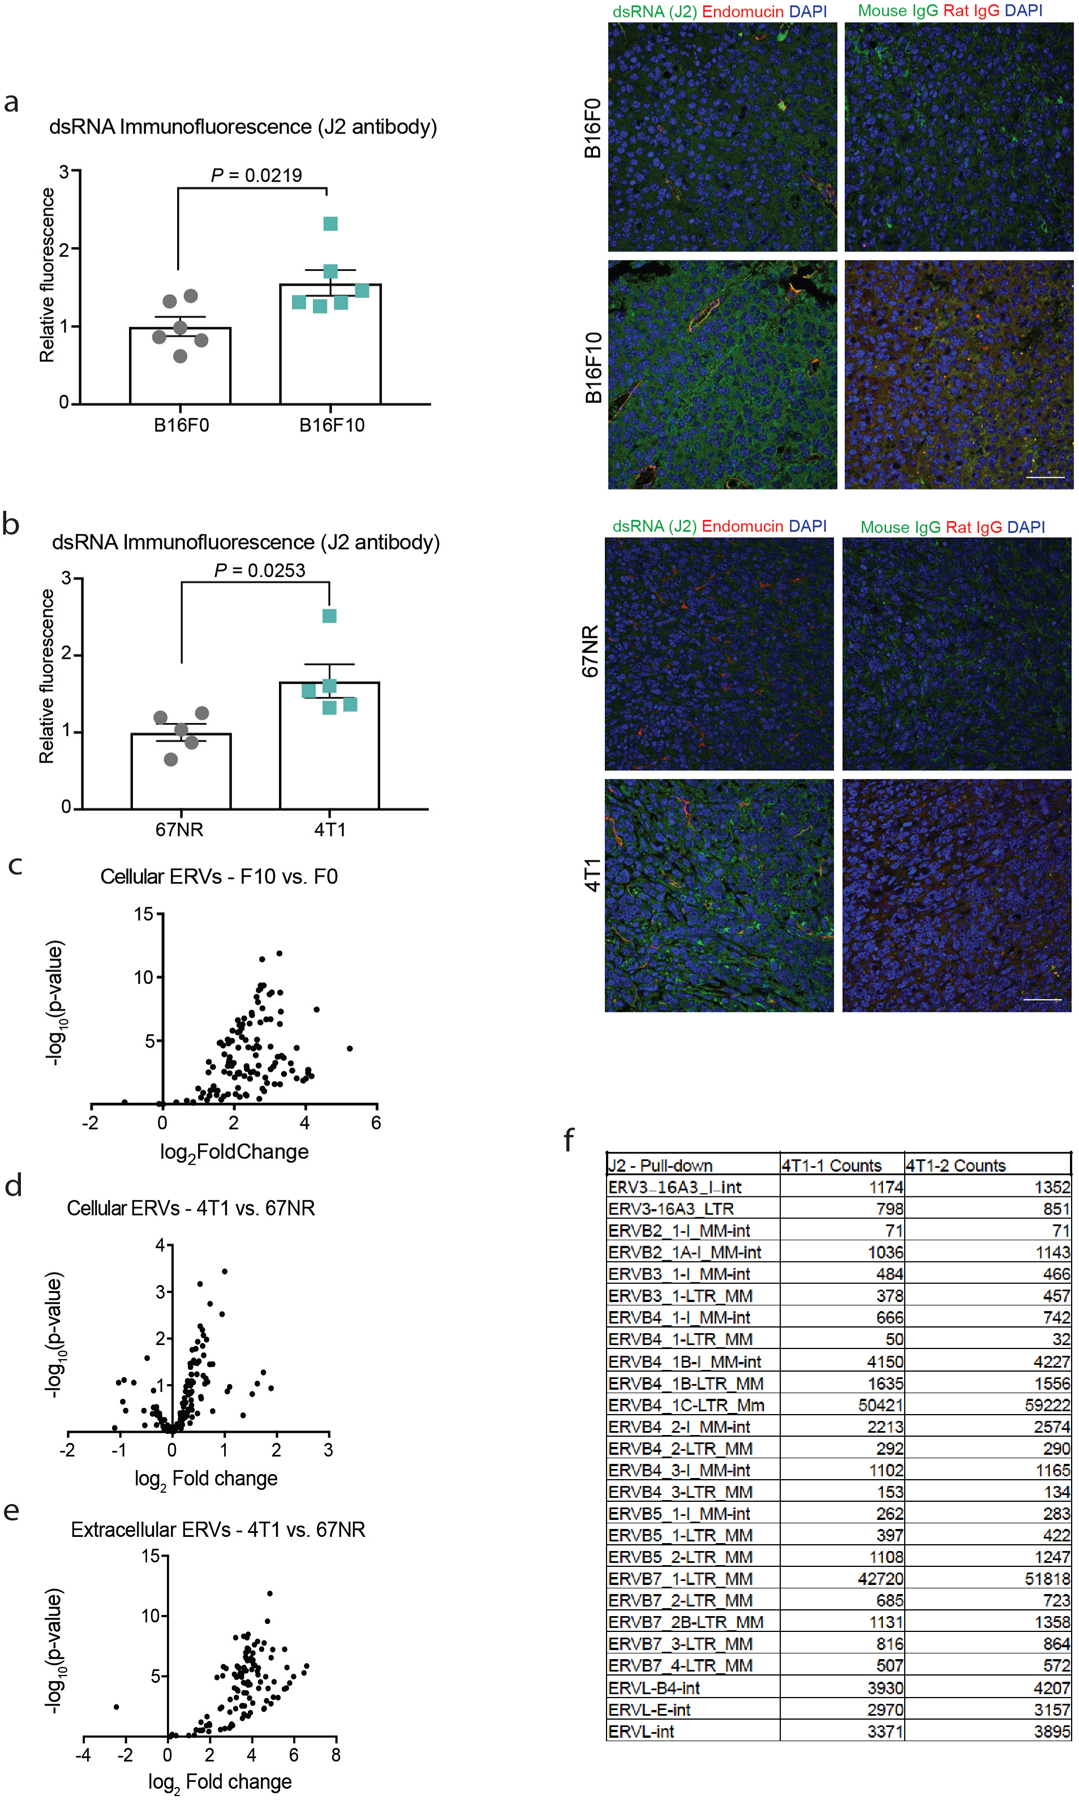
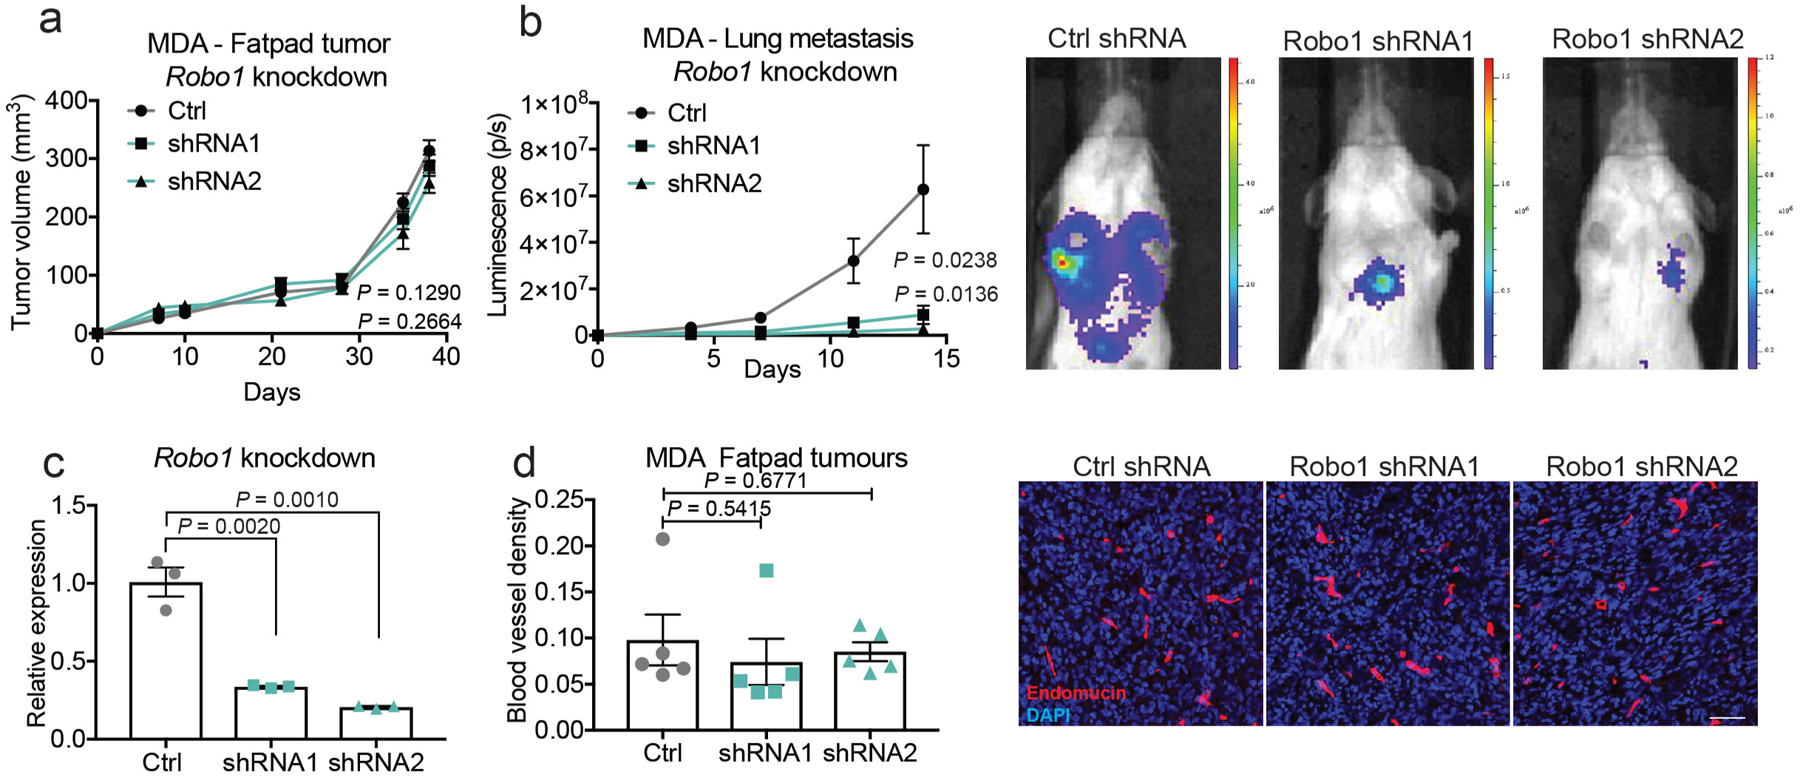
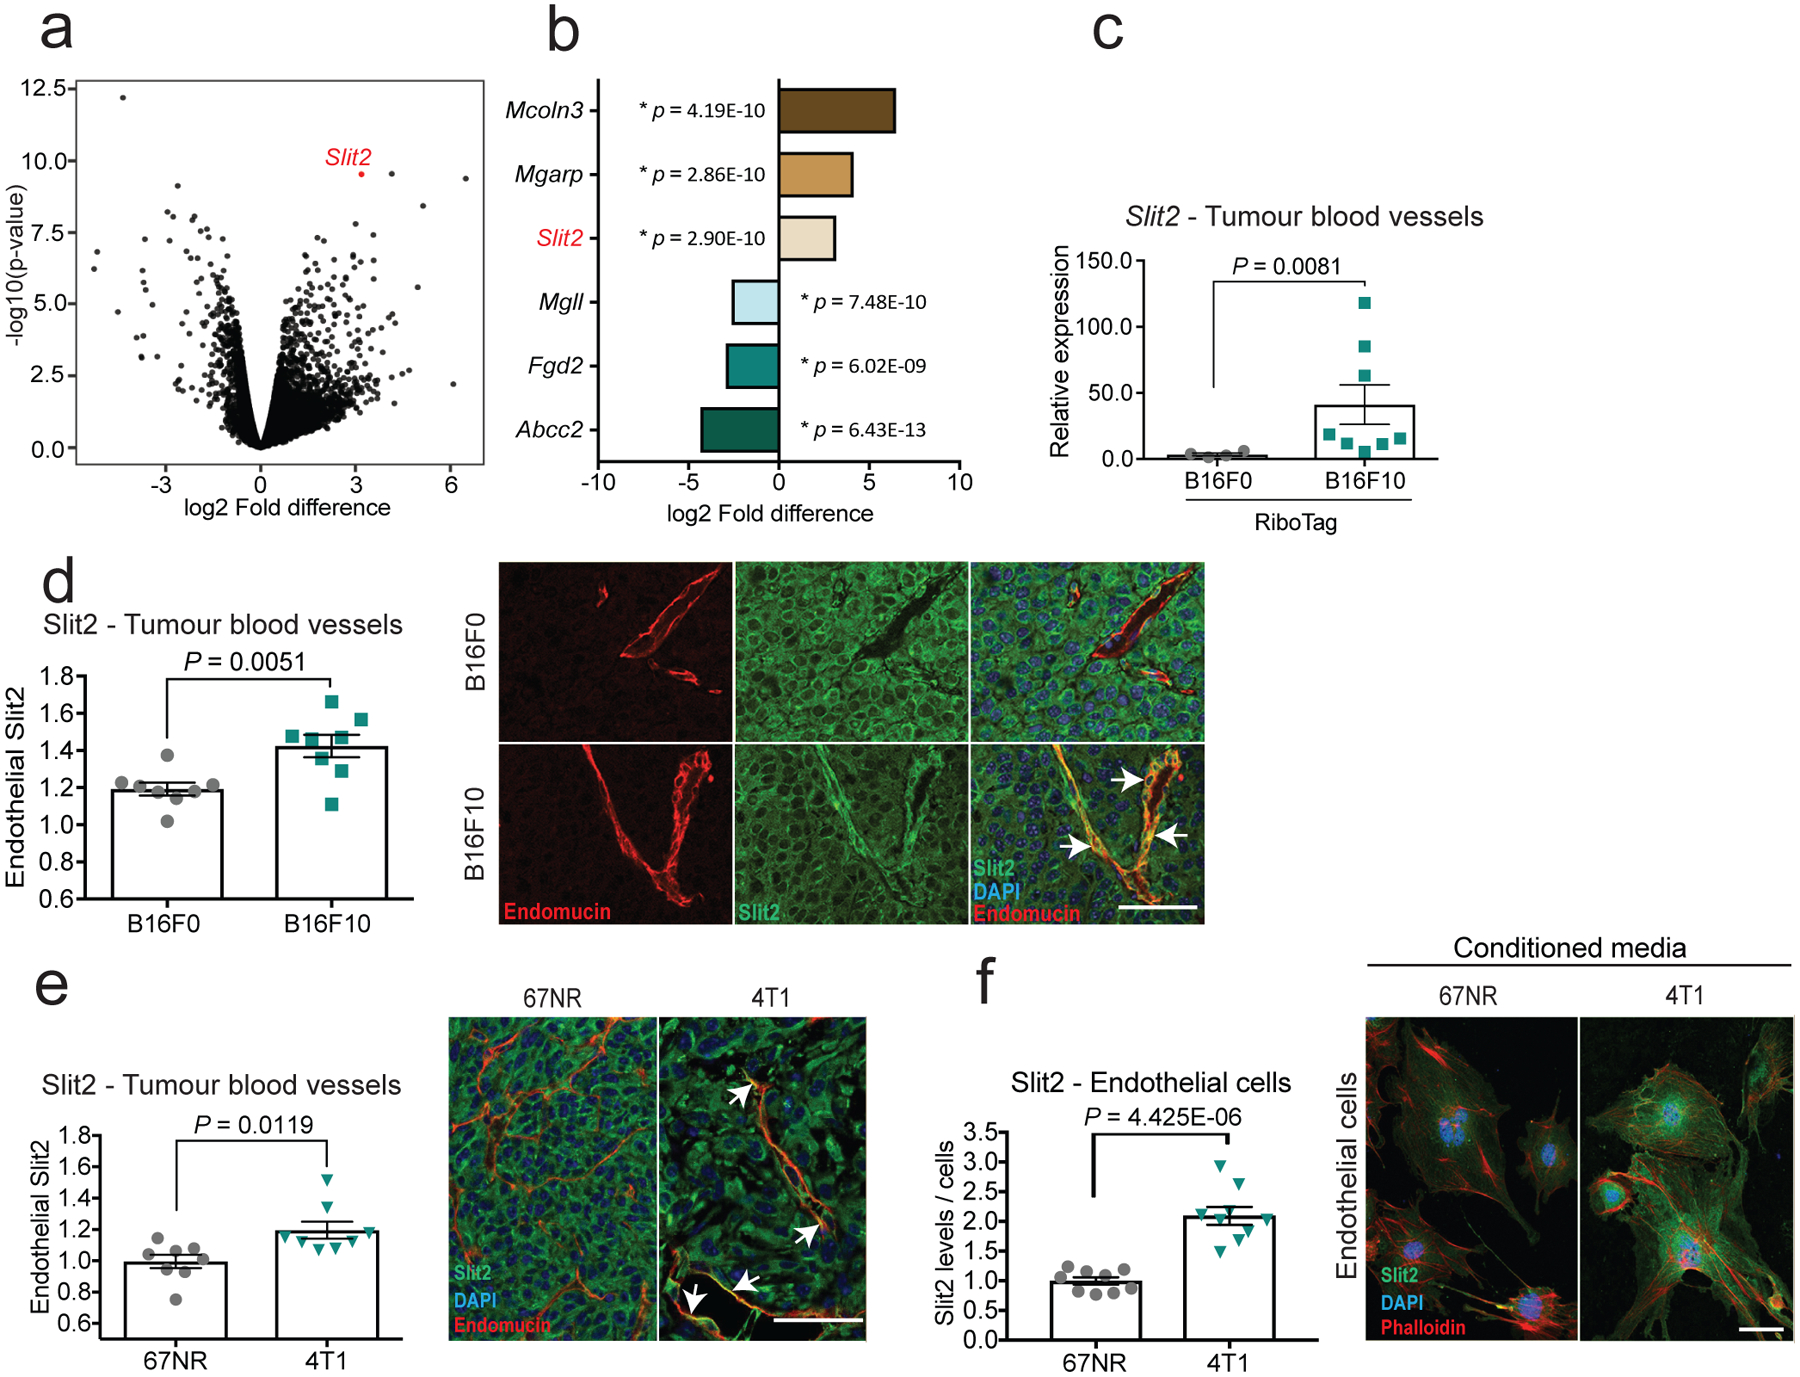
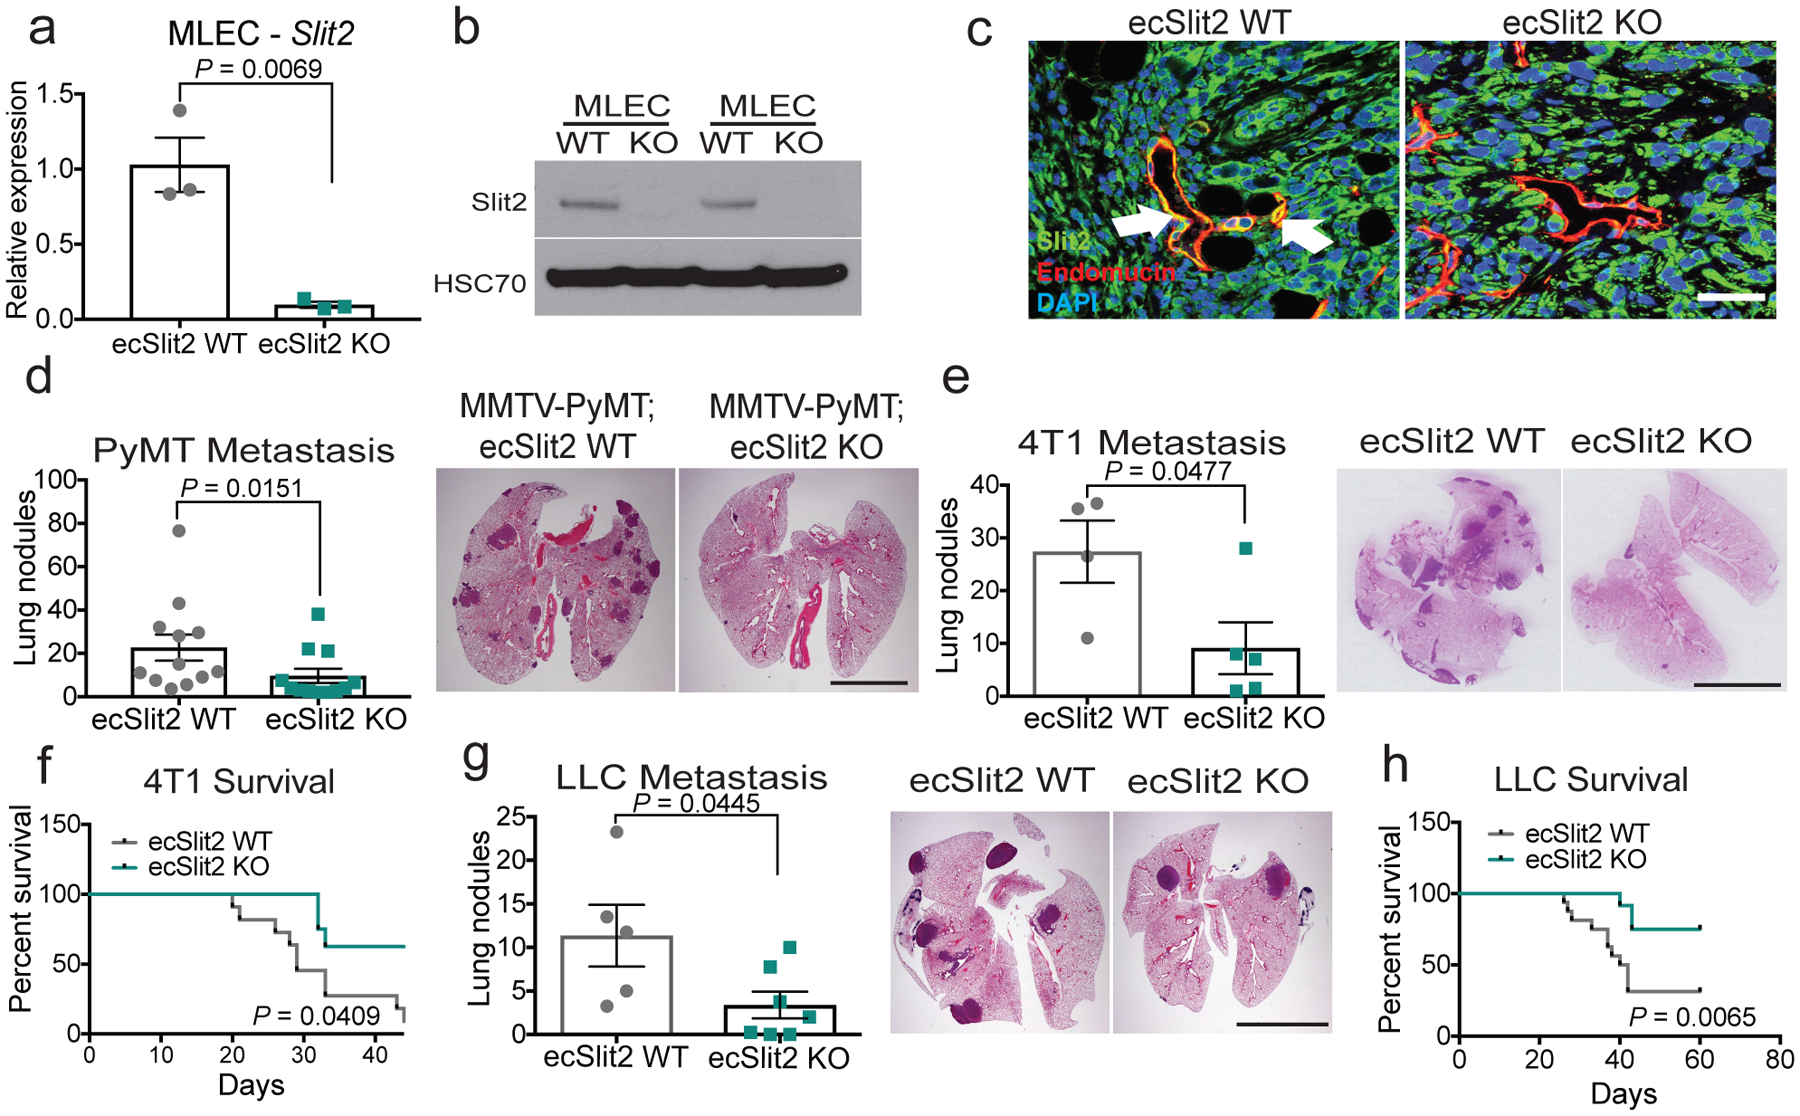
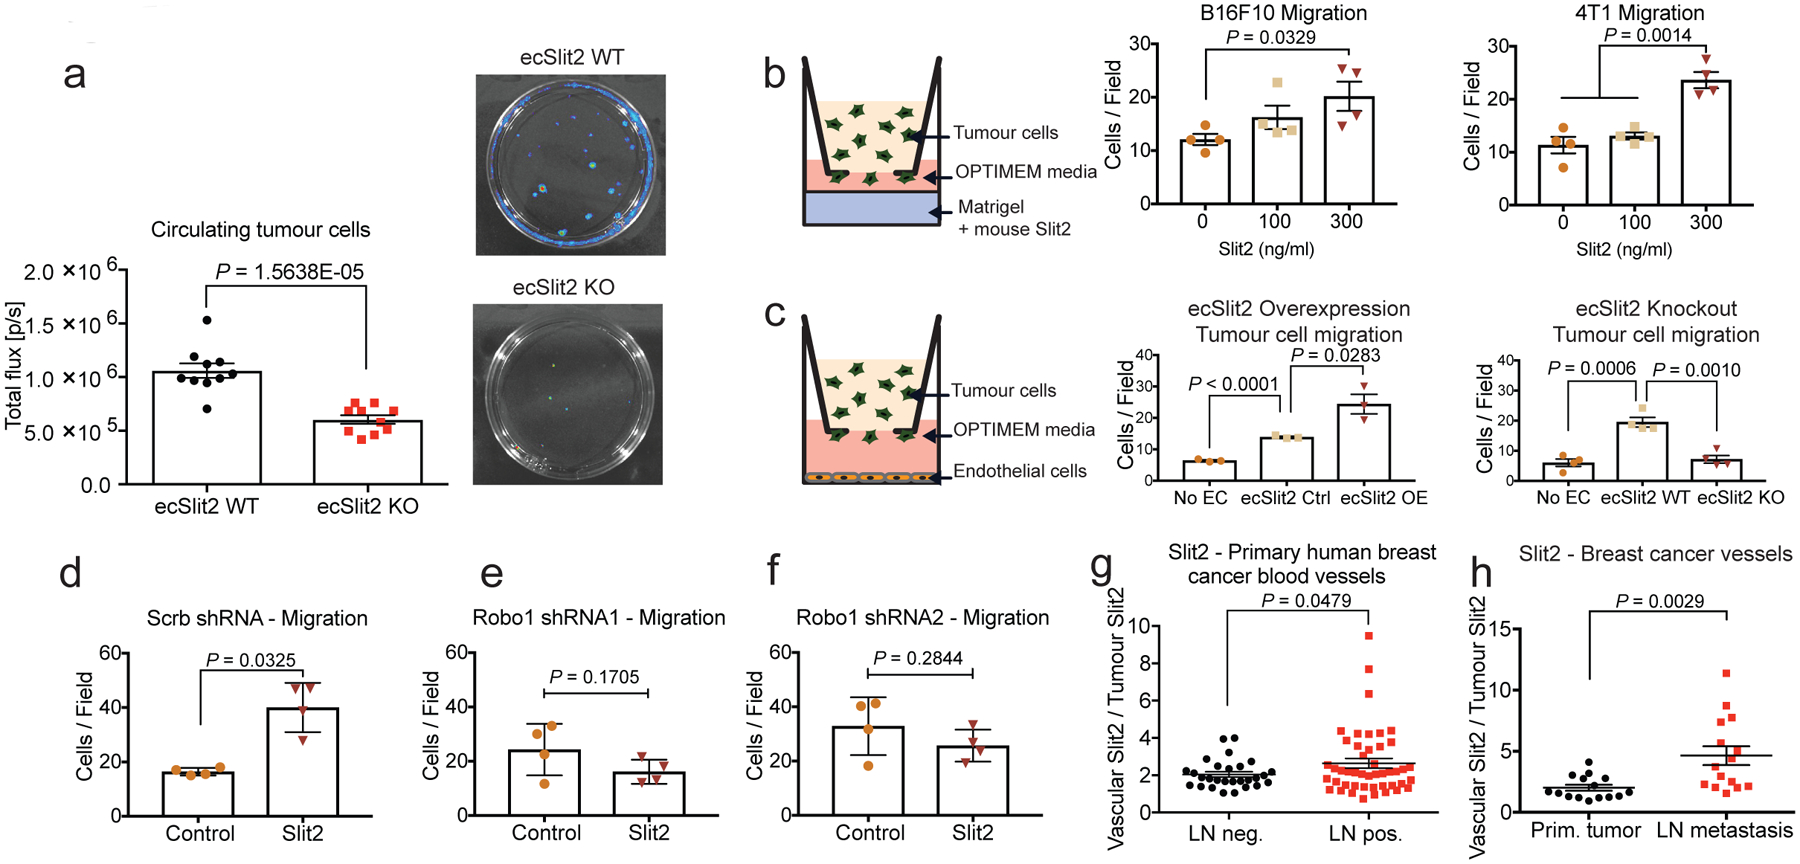
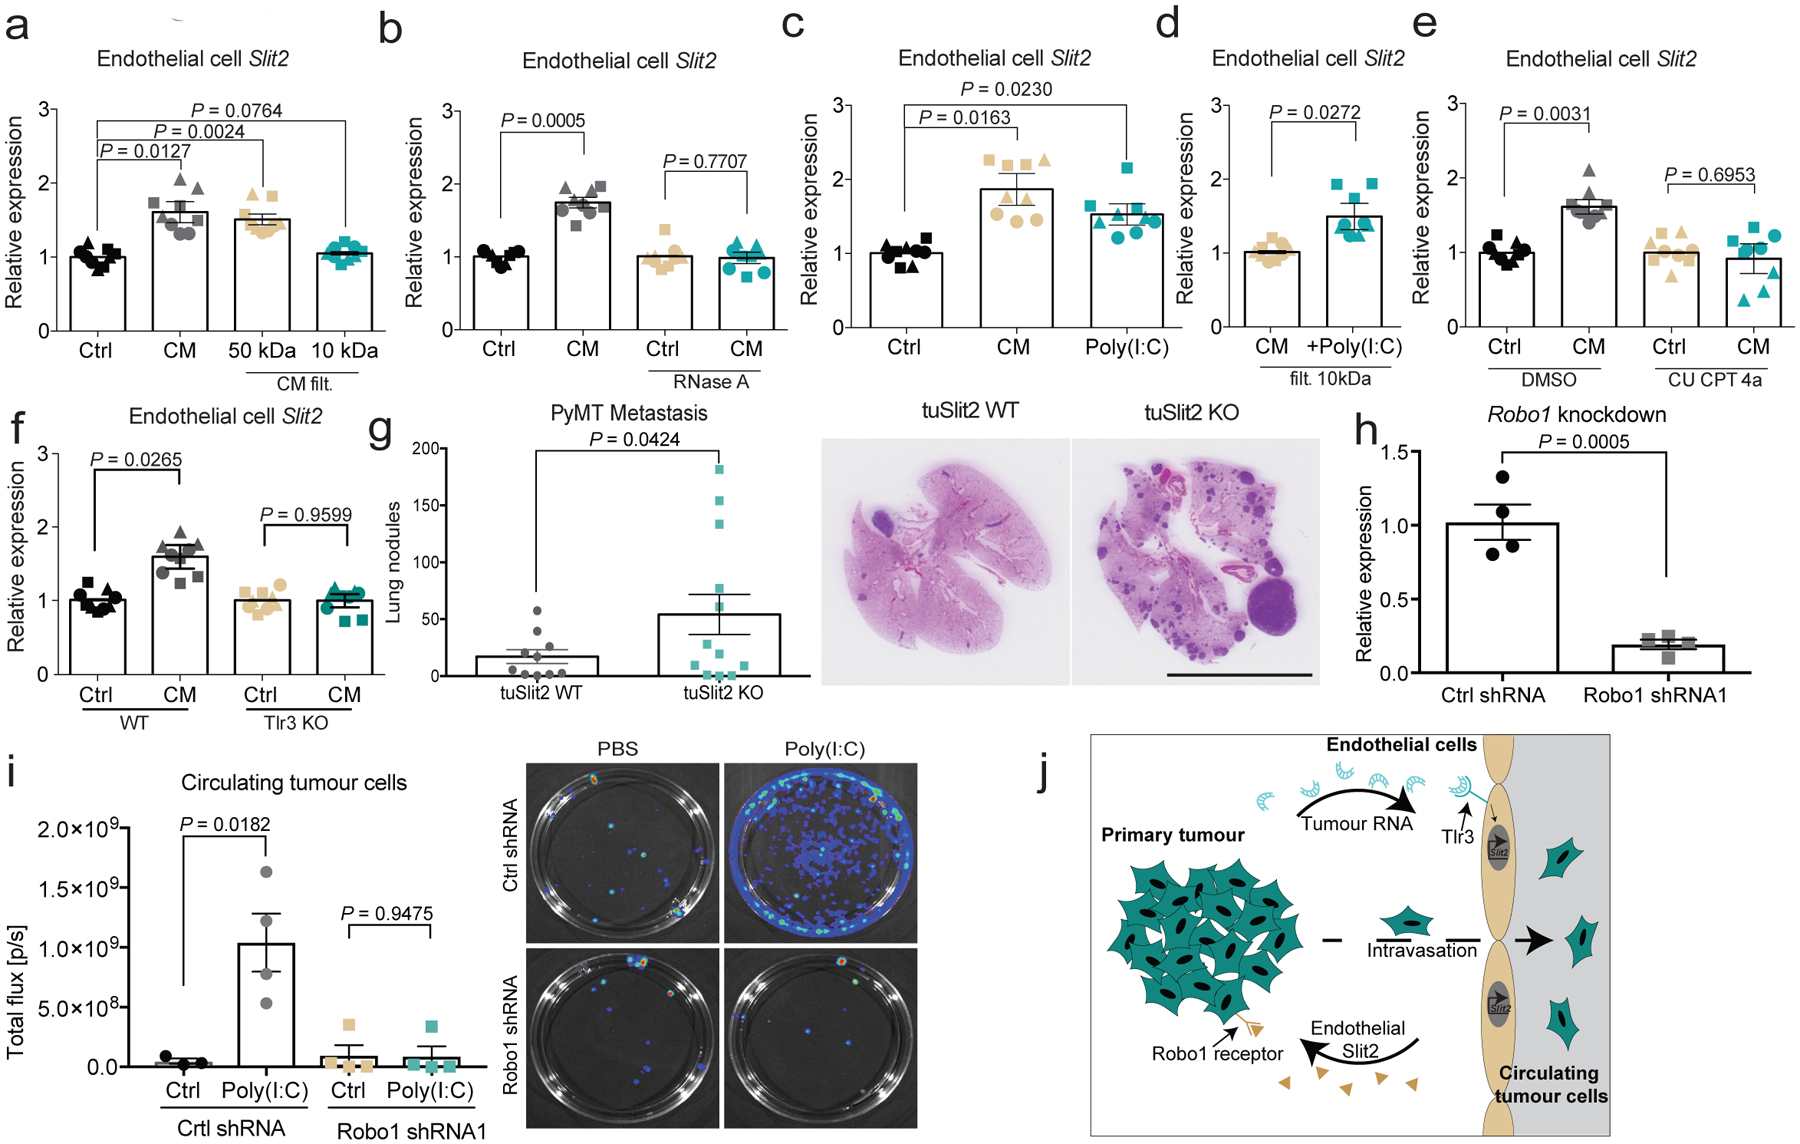
Blood vessels support tumours by providing nutrients and oxygen, while also acting as conduits for the dissemination of cancer1. Here we use mouse models of breast and lung cancer to investigate whether endothelial cells also have active 'instructive' roles in the dissemination of cancer. We purified genetically tagged endothelial ribosomes and their associated transcripts from highly and poorly metastatic tumours. Deep sequencing revealed that metastatic tumours induced expression of the axon-guidance gene Slit2 in endothelium, establishing differential expression between the endothelial (high Slit2 expression) and tumoural (low Slit2 expression) compartments. Endothelial-derived SLIT2 protein and its receptor ROBO1 promoted the migration of cancer cells towards endothelial cells and intravasation. Deleting endothelial Slit2 suppressed metastatic dissemination in mouse models of breast and lung cancer. Conversely, deletion of tumoural Slit2 enhanced metastatic progression. We identified double-stranded RNA derived from tumour cells as an upstream signal that induces expression of endothelial SLIT2 by acting on the RNA-sensing receptor TLR3. Accordingly, a set of endogenous retroviral element RNAs were upregulated in metastatic cells and detected extracellularly. Thus, cancer cells co-opt innate RNA sensing to induce a chemotactic signalling pathway in endothelium that drives intravasation and metastasis. These findings reveal that endothelial cells have a direct instructive role in driving metastatic dissemination, and demonstrate that a single gene (Slit2) can promote or suppress cancer progression depending on its cellular source.


Conflict of interest statement

The authors declare no competing financial interests.

Figures

Extended Data Fig. 1 |
Extended Data Fig. 1 |. Endothelial cells upregulate SLIT2 upon treatment with conditioned medium from highly metastatic 4T1 cells.
a, Primary MLECs (ICAM2-positive) upregulate SLIT2 when treated with conditioned medium derived from 4T1 cells (n = 3). Dot plot represents Slit2 mRNA levels measured by qPCR for each biological replicate with mean ± s.e.m. Two-tailed Student’s t-test. b, Primary nonendothelial cells (ICAM2-negative) from the lung do not upregulate SLIT2 upon treatment with 4T1 conditioned medium (n = 3). Dot plot represents Slit2 mRNA levels measured by qPCR for each biological replicate with mean ± s.e.m. Two-tailed Student’s t-test. c, Treatment of endothelial cells with 5 μM dynasore inhibits SLIT2 expression upon treatment with conditioned medium from 4T1 cells (n = 3). Dot plot represents Slit2 mRNA levels measured by qPCR for each biological replicate with mean ± s.e.m. Two-tailed Student’s t-test. d, e, Dot plots represent Slit2 mRNA expression by qPCR in endothelial cells exposed to 4T1 conditioned medium treated with (e) DNase I (10 μg/ml; n = 3), and (d) heat treatment (95 °C, 10 min; n = 3). Data are mean ± s.e.m. Two-tailed Student’s t-test. f, TLR3 wild-type (Tlr3 WT) and TLR3-knockout (Tlr3 KO) endothelial cells were treated with conditioned medium from 67NR, 4T07 and 4T1 cells. Western blot analysis revealed that wild-type endothelial cells display increased phosphorylation of ERK1 and ERK2 upon treatment with the conditioned medium from highly metastatic 4T1 cells. TLR3-knockout endothelial cells displayed reduced phosphorylation of ERK1 and ERK2 relative to wild-type controls. Dot plot displays densitometry quantification for three independent experiments. Two-tailed Student’s t-test. g, RNase A treatment of the 4T1 conditioned medium blunted endothelial phosphorylation of ERK1 and ERK2. h, Supplementation of basal medium with synthetic TLR9 ligand (CpG ODN, 2.5 or 12.5 μg/ml) did not induce endothelial SLIT2 upregulation (n = 3). Dot plot represents Slit2 levels measured by qPCR for each biological replicate with mean ± s.e.m. Two-tailed Student’s t-test. i, j, Supplementation of basal medium with synthetic TLR9 ligand (CpG ODN, 2.5 or 12.5 μg/ml) induced (i) endothelial Il6 (n = 3) and (j) Ifng mRNA expression (n = 3). Dot plot represents Il6 and Ifng levels measured by qPCR for each biological replicate with mean ± s.e.m. Two-tailed Student’s t-test. k, l, Quantification of RNA isolated from conditioned medium of (k) B16F0 (n = 3) and B16F10 cells (n = 3) and (l) 67NR (n = 3) and 4T1 cells (n = 3). Dot plot represents RNA concentrations detected in conditioned medium normalized by the cell number with mean ± s.e.m. Two-tailed Student’s t-test. m, RNA detection in plasma isolated from mice with 67NR (n = 3) and 4T1 (n = 5) mammary gland tumours. Tumour-free mice (n = 5) were used as a negative control. Increased concentrations of RNA were detected in the plasma of mice with the metastatic 4T1 tumours. Dot plot represents the RNA concentrations detected in the plasma of each mouse, either with no tumour or with 67NR and 4T1 tumours. Two-tailed Student’s t-test.
Extended Data Fig. 2 |
Extended Data Fig. 2 |. Endothelial SLIT2 deletion does not impair primary tumour growth and angiogenesis.
ac, Tumour growth rates (left) for (a) spontaneous MMTV-PyMT mammary gland tumours (total tumour burden) in wild-type (n = 8) and ecSLIT2-knockout mice (n = 7), (b) orthotopic 4T1 mammary tumours in wild-type (n = 11) and ecSLIT2-knockout mice (n = 8), and (c) subcutaneous LLC tumours in wild-type (n = 22) and ecSLIT2-knockout mice (n = 19). Mean tumour volume ± s.e.m. for each time point. Two-tailed t-test for last time point. d, Mammary gland tumours from tamoxifen-treated Cdh5(PAC)-creERT2;Slit2-floxed;MMTV-PyMT (ecSLIT2-knockout) or CreERT2-negative Slit2-floxed;MMTV-PyMT (ecSLIT2 wild-type) mice were sectioned and stained for endomucin. No significant difference in blood vessel density was observed between tumours growing in wild-type and ecSLIT2-knockout mice. Each dot represents the average of endomucin area relative to total DAPI area in sections for each tumour, measured with ImageJ. Mean ± s.e.m. ecSLIT2 wild type, n = 6; ecSLIT2 knockout, n = 6. Scale bar, 50 μm. Two-tailed Student’s t-test. e, The 4T1 tumour sections were stained for endomucin. No difference in vessel density was observed between tumours from wild-type and ecSLIT2-knockout mice. Dot plot depicts endomucin area relative to DAPI area for each tumour, quantified by ImageJ. Mean ± s.e.m. ecSLIT2 wild type, n = 6; ecSLIT2 knockout, n = 5; Scale bar, 50 μm. Two-tailed Student’s t-test. f, LLC tumour sections were stained for endomucin. No difference in blood vessel density was observed between tumours growing in ecSLIT2-knockout and wild-type mice. Mean ± s.e.m. ecSLIT2 wild type, n = 4; ecSLIT2 knockout, n = 4. Scale bar, 50 μm. Two-tailed Student’s t-test. g, h, Immunofluorescence staining for PyMT in lung sections of MMTV-PyMT ecSLIT2 wild type or ecSLIT2-knockout mice reveals reduction in both micrometastasis (g) and macrometastasis (h). Dot plot displays the number of lung nodules per mouse, divided into micrometastases or macrometastases. ecSLIT2 wild type, n = 9; ecSLIT2 knockout, n = 9. Data are mean ± s.e.m. Two-tailed Mann–Whitney test. Arrowheads indicate macrometastasis and arrows indicate micrometastasis. i, Wild-type and ecSLIT2-knockout mice bearing 4T1 primary tumours were intravenously injected with PE–PECAM antibody and Hoechst. The 4T1 tumour sections were prepared, and vessel permeability was quantified. Representative images of tumour sections showing Hoechst nuclear staining and perfused PE–PECAM vessels. Scale bar, 50 μm. Dot plot represents the mean ratio of Hoechst signal relative to PE–PECAM signal ± s.e.m.; ecSLIT2 wild type, n = 5; ecSLIT2 knockout, n = 5. j, Tumour sections from wild-type and ecSLIT2-knockout mice bearing 4T1 primary tumours were injected via tail vein with PE–PECAM antibody and stained for PECAM to quantify the proportion of perfused vessels relative to total tumour vessels. Representative images of tumour sections showing PE–PECAM perfused vessels (functional vessels) relative to total vessels stained with PECAM. White arrows indicate nonperfused blood vessels. Scale bar, 50 μm. Bar chart represents the mean ratio of Hoechst relative to endomucin staining ± s.e.m. ecSLIT2 wild type, n = 5; ecSLIT2 knockout, n = 5. i, j, Two-tailed Student’s t-test. k, Tumour growth rates for the MMTV-PyMT tumours in tuSLIT2-knockout (n = 12) or wild-type (n = 10) control mice. Tumour burden was calculated by adding individual tumours in each mouse. Data are mean ± s.e.m. Two-tailed t-test for last time point. l, Blood vessel density was measured by immunostaining for endomucin in sections of mammary gland tumours from MMTV-PyMT mice (tuSLIT2 wild type or tuSLIT2 knockout). Bar chart represents the average endomucin area relative to DAPI area ± s.e.m. Scale bar, 50 μm. tuSLIT2 wild type, n = 5; tuSLIT2 knockout, n = 5. m, Tumoural SLIT2 deletion was confirmed by immunostaining of tumours for SLIT2. Fluorescent quantification revealed a significant reduction in SLIT2 levels in tuSLIT2-knockout tumours. Bar chart with each dot representing the average of fluorescent quantification of different tumour sections for each mouse ± s.e.m. tuSLIT2 wild type, n = 5; tuSLIT2 knockout, n = 5. l, m, Two-tailed Student’s t-test. Scale bar, 50 μm.
Extended Data Fig. 3 |
Extended Data Fig. 3 |. Endothelial SLIT2 deletion does not affect metastatic colonization upon tail vein injection.
a, 4T1 cells were injected intravenously into the tail veins of ecSLIT2-knockout or wild-type littermate controls. Survival is depicted as the number of days until each mouse was euthanized owing to metastatic disease. ecSLIT2 wild type, n = 11; ecSLIT2 knockout, n = 12. log-rank (Mantel–Cox) test. b, Metastatic burden was measured by quantification of mean luminescence relative to day 0 ± s.e.m. ecSLIT2 wild type, n = 11; ecSLIT2 knockout, n = 12. Two-tailed Student’s t-test. c, H&E-stained lung sections were used for quantification of lung nodules 17 d after injection of cells. Dot plot represents the average number of lung nodules per mouse ± s.e.m. ecSLIT2 wild type, n = 6; ecSLIT2 knockout, n = 3. Scale bar, 0.5 cm. Two-tailed Student’s t-test. d, LLC cells were injected into the tail veins of wild-type or ecSLIT2-knockout littermate controls. Survival is depicted as in a. ecSLIT2 wild type, n = 11; ecSLIT2 knockout, n = 14. log-rank (Mantel–Cox) test. e, Metastatic burden was measured by mean bioluminescence quantification relative to day 0 ± s.e.m. ecSLIT2 wild type, n = 6, ecSLIT2 knockout, n = 6. Two-tailed Student’s t-test. f, H&E-stained lung sections revealed no significant difference in lung nodule numbers between groups, 15 d after injection. Data are mean ± s.e.m. ecSLIT2 wild type, n = 6; ecSLIT2 knockout, n = 6. Scale bar, 0.5 cm. Two-tailed Student’s t-test.
Extended Data Fig. 4 |
Extended Data Fig. 4 |. Time course of endothelial SLIT2 upregulation upon conditioned medium treatment.
C-terminal SLIT2 fragment is insufficient to promote 4T1 tumour cell migration. a, Endothelial cells overexpressing SLIT2-C–Flag were used to generate conditioned medium or lysed for protein extraction. Anti-Flag antibody was used to detect SLIT2 in either cell lysates or secreted SLIT2 in the conditioned medium. b, Western blot for SLIT2 to detect the full-length SLIT2 or its C-terminal fragment. HSC70 was used as a loading control. c, Endothelial cells were treated with conditioned medium from 4T1 cells for 3, 6, 12 and 24 h, and SLIT2 levels were assessed. Dot plot represents Slit2 mRNA levels for each biological replicate with mean ± s.e.m. n = 3 for each group. Two-tailed Student’s t-test. d, Western blot of SLIT2 protein upon treatment of wild-type endothelial cells or TLR3-knockout endothelial cells with conditioned medium from 4T1 cells or basal medium (control). e, The 4T1 tumour cells displayed enhanced migration towards increasing concentrations of recombinant SLIT2-N, but not SLIT2-C. Dot plot represents the number of migrated cells per optical field of view (10× objective) with mean ± s.e.m. Panel displays representative images from migrated cells (10× objective). n = 4 for each group. Two-tailed Student’s t-test. f, Adenoviral expression of full-length SLIT2 in ecSLIT2-knockout endothelial cells promoted tumour cell migration in a transwell assay while adenoviral expression of C-terminal SLIT2 (ecSLIT2 KO-C) or LacZ (ecSLIT2 KO-LacZ) did not enhance tumour cell migration. Mean ± s.e.m. Two-tailed Student’s t-test. Western blot with antibody against C-terminal region of SLIT2 detected full-length and C-terminal forms of SLIT2 in ecSLIT2-knockout endothelial cells transduced with adenovirus. n = 4 for each condition. g, SLIT2 depletion in 4T1 tumour cells using two independent shRNAs increased migration of tumour cells towards endothelial cells in a transwell migration assay. Dot plot represents the number of migrated 4T1 cells per optical field of view (10× objective) with mean ± s.e.m. P value between control and shRNA no. 1 and no. 2 corresponds to a one-tailed Student’s t-test. n = 4 for each condition. h, SLIT2 expression in 4T1 cells transduced with either scrambled shRNA or two independent shRNAs targeting SLIT2. Dot plot represents Slit2 mRNA levels for each biological replicate with mean ± s.e.m. Two-tailed Student’s t-test. n = 3 for each condition.
Extended Data Fig. 5 |
Extended Data Fig. 5 |. Endothelial and tumoural SLIT2 and tumoural ROBO1 levels are associated with cancer progression in patients with breast cancer.
a, b, Dot plots represent relative Robo1 mRNA expression by qPCR in mouse metastatic 4T1 (n = 4) and nonmetastatic 67NR cells (n = 4) (a) and parental 4T1 cells (primary n = 5) and 4T1-derived lung metastases (n = 5) (b). a, b Two-tailed Student’s t-test. c, SLIT2 quantification in endomucin-positive vessels of PDX tumours from patients with breast cancer revealed that high levels of endothelial SLIT2 correlate with worse prognosis. Survival data for the patients from whom the PDXs were isolated were stratified into high and low endothelial SLIT2 expression. High ecSLIT2 expression, n = 10 patients; low ecSLIT2 expression, n = 10 patients. log-rank (Mantel–Cox) test. d, RNA-seq data analysis from primary tumours and CTCs of patients with breast cancer from Gene Expression Omnibus GSE111842 revealed reduced or undetectable SLIT2 expression in CTCs from patients with stage II or III breast cancer when compared with SLIT2 levels of matched primary tumours. Dot plot represents the mean SLIT2 levels ± s.e.m. Primary tumour samples, n = 12; CTC samples, n = 16. Two-tailed Mann–Whitney test. e, f, Kaplan–Meier survival analysis for SLIT2 (e) and ROBO1 (f) expression in human breast tumours generated using KMPLOT, with auto select best cut-off selected. SLIT2, n = 1,660; ROBO1, n = 3,951. log-rank (Mantel–Cox) test.
Extended Data Fig. 6 |
Extended Data Fig. 6 |. TLR3 knockout in the tumour stroma reduces tumour cell intravasation, whereas synthetic dsRNA induces intravasation by tumour cells.
a, 4T1-Luc-zsGreen tumours were established in the mammary fat pads of wild-type and TLR3-knockout mice. Circulating tumour cells were isolated from the whole blood of mice, and quantified by identifying luciferase-positive colonies. Dot plot represents measured bioluminescence (photons s−1). Representative images of luciferase-positive colonies growing on 10-cm tissue culture dishes. TLR3 wild type, n = 10; TLR3 knockout, n = 11. b, Quantification of SLIT2 expression in the blood vessels of 4T1 mammary tumours in either wild-type or TLR3-knockout mice. Dot plot represents mean fluorescence intensities of SLIT2 in endomucin-positive vessels of 4T1 tumours ± s.e.m. TLR3 wild type, n = 9; TLR3 knockout, n = 9 tumours. a, b, Data are mean ± s.e.m. Two-tailed Student’s t-test. c, Injection of poly(I:C) (25 μg) into NSG mice promoted intravasation by tumour cells, measured by quantification of circulating tumour cells through detection of luminescence (photons s−1) from luciferase-positive colonies. Dot plot with each dot representing measured bioluminescence (photons s−1), for the whole-blood-derived colonies for each mouse. Control group (ctrl), n = 7; poly(I:C), n = 8. Representative images of luciferase-positive colonies growing on a 10-cm tissue culture dish. d, ImageJ quantification of immunofluorescent SLIT2 staining that co-localized with endomucin-positive vessels in 4T1 tumours injected with either PBS (control) or poly(I:C). Dot plot represents fluorescent intensities of SLIT2 in the vasculature of 4T1 tumours ± s.e.m. Control, n = 7; poly(I:C), n = 8 tumours. e, PE–PECAM antibody and Hoechst perfusion did not reveal changes in vascular permeability by poly(I:C) treatment. Representative images of tumour sections showing Hoechst nuclear staining and perfused PE–PECAM vessels. Scale bar, 50 μm. Bar chart represents the average ratio of Hoechst signal relative to PE–PECAM signal normalized to the control group ± s.e.m.; n = 5 tumours for each group. ce, Data are mean ± s.e.m. Two-tailed Student’s t-test. f, Robo1 knockdown in tumour cells with a second shRNA (Robo1 shRNA no. 2) inhibited poly(I:C)-induced intravasation. Dot plot with each dot representing measured bioluminescence (photons s−1), for the whole-blood-derived luciferase-positive colonies for each mouse with mean ± s.e.m. Control shRNA: control, n = 5; poly(I:C), n = 4; Robo1 shRNA no. 2: control, n = 5; poly(I:C), n = 6. One-tailed Student’s t-test. g, ROBO1 expression in 4T1-Luc-zsGreen cells transduced with either scrambled shRNA (control shRNA) or shRNA no. 2 targeting Robo1. Dot plot represents Robo1 mRNA levels for each replicate with mean ± s.e.m. Control shRNA, n = 3; Robo1 shRNA no. 2, n = 3. Two-tailed Student’s t-test.
Extended Data Fig. 7 |
Extended Data Fig. 7 |. SLIT2 promoter is hypermethylated in breast cancer in humans.
a, SLIT2 promoter methylation in normal breast tissues and invasive breast carcinomas, reproduced from the Human Cancer database (MethHC). Dot plot represents the mean SLIT2 promoter methylation ± s.e.m. Breast tissue, n = 92; Breast cancer, n = 735. b, Slit2 expression by real-time qPCR in 67NR and 4T1 tumour cells. Dot plot represents Slit2 mRNA levels for each biological replicate with mean ± s.e.m. 67NR, n = 3; 4T1, n = 3. c, Treatment of 4T1 tumour cells with the demethylating agent 5-azacytidine (5-aza) upregulated SLIT2 expression. Dot plot represents Slit2 mRNA levels for each biological replicate with mean ± s.e.m. Control group (ctrl) n = 3; 5-aza group, n = 3. d, Pre-mRNA levels were measured by real-time qPCR using primers that span the exon–intron junction. Dot plot represents pre-mRNA Slit2 levels for each biological replicate (n = 3) with mean ± s.e.m. e, Genomic copy number for Slit2 in 67NR and 4T1 tumour cells relative to mouse lung endothelial cells (MLEC). Dot plot represents Slit2 copy number (TaqMan assay) for each replicate (n = 3) with mean ± s.e.m. ae, Two-tailed Student’s t-test.
Extended Data Fig. 8 |
Extended Data Fig. 8 |. Tumoural SLIT2 deletion does not significantly affect apoptosis and expression of SLIT2-related cytokines.
a, No difference in cleaved caspase 3 staining in MMTV-PyMT tumour sections of wild-type versus ecSLIT2-knockout mice. Dot plot represents fluorescent intensity of cleaved caspase 3 in tumour sections. Mean ± s.e.m. tuSLIT2 wild type, n = 5; tuSLIT2 knockout, n = 5 tumours. Scale bar, 50 μm. b, Deletion of SLIT2 in the tumour compartment of MMTV-PyMT tumours did not significantly alter tumour netrin 1 expression. Dot plot represents fluorescent intensity of netrin 1 in tumour sections. Mean ± s.e.m. tuSLIT2 wild type, n = 5; tuSLIT2 knockout, n = 5 tumours. Scale bar, 50 μm. c, Deletion of SLIT2 in the tumour compartment of MMTV-PyMT tumours did not significantly affect tumour SDF1 expression; Dot plot represents fluorescent intensity of SDF1 in tumour sections ± s.e.m. tuSLIT2 wild type, n = 4; tuSLIT2 knockout, n = 6 tumours. Scale bar, 50 μm. d, Deletion of SLIT2 in the tumour compartment of MMTV-PyMT tumours did not significantly change tumour MCP1 expression; Dot plot represents fluorescent intensity of MCP1 in tumour sections ± s.e.m. tuSLIT2 wild type, n = 4; tuSLIT2 knockout, n = 4 tumours. Scale bar, 50 μm. e, Sdf1 (also known as Cxcl12) expression was measured by qPCR in endothelial cells treated with conditioned medium from the poorly metastatic 67NR or highly metastatic 4T1 cells, or with basal medium (control). Bar chart represents the mean expression levels of SDF1 ± s.e.m. Each group, n = 3. f, Mcp1 (also known as Mcpt1) expression was measured by qPCR in endothelial cells treated with conditioned medium from poorly metastatic 67NR or highly metastatic 4T1 cells, or basal medium (control). Bar chart depicts the mean expression of MCP1 ± s.e.m. Each group, n = 3. g, Cxcr4 expression was assessed by qPCR in endothelial cells treated with conditioned medium from poorly metastatic 67NR or highly metastatic 4T1 cells, or basal medium (control). Bar chart represents the mean expression values of CXCR4 ± s.e.m. Each group, n = 3. ag, Two-tailed Student’s t-test.
Extended Data Fig. 9 |
Extended Data Fig. 9 |. Increased detection of dsRNA and ERVs in highly metastatic tumours.
dsRNA was detected by immunostaining of tumours with the J2 antibody. a, b, Fluorescent quantification revealed a significant increase in dsRNA signal in highly metastatic B16F10 relative to B16F0 tumours (a) and in metastatic 4T1 relative to nonmetastatic 67NR tumours (b). Bar chart with each dot representing the mean relative fluorescent quantification of different tumour sections for each tumour normalized to the low-metastatic B16F0 or 67NR tumours ± s.e.m. B16F0, n = 6; B16F10, n = 6; 67NR, n = 5; 4T1, n = 5. Representative images are shown for the immunostaining of dsRNA (J2), endomucin and DAPI in tumour sections of B16F0 and B16F10, and 67NR and 4T1, tumours. Scale bar, 50μm. a, b, Two-tailed Student’s t-test. c, d, Volcano plot displays the log2-transformed fold differences in expression of ERVs between B16F10 relative to B16F0 cells (c) as well as 4T1 relative to 67NR cells (d). Out of 12,332 annotations, 123 ERV sequences were detected in our RNA-seq libraries. n = 3 biological replicates. e, Cell-free RNA was isolated from the conditioned medium of 67NR and 4T1 cell cultures, and RNA-seq libraries were generated for analysis of the aforementioned 123 ERVs. Volcano plot displays the log2-transformed fold differences in detected ERVs in the supernatant of 4T1 cells relative to 67NR cells. n = 3 biological replicates. f, Pull-down of dsRNA with the J2 antibody followed by RNA-seq detected ERVs secreted by 4T1 cells. Table shows the total counts of ERV reads detected for two immunoprecipitation replicates (4T1–1 and 4T1–2).
Extended Data Fig. 10 |
Extended Data Fig. 10 |. ROBO1 knockdown in human MDA cells reduces orthotopic lung metastasis.
a, Two independent shRNAs were used to knockdown ROBO1 in human breast cancer MDA cells. Both ROBO1 knockdown (shRNA no. 1 and shRNA no. 2) and control shRNA (control) cells were injected into the mammary fat pads of NSG mice. Tumours were measured at days 7, 10, 21, 28, 35 and 38, and surgically resected on day 38. P values for the last time point (control–shRNA no. 1 and control–shRNA no. 2) are shown. Two-tailed Student’s t-test. b, Lung metastasis was assessed by bioluminescence imaging (photons per second). n = 5 for each group. P values for the last time point (control–shRNA no. 1 and control–shRNA no. 2) are shown. Two-tailed Student’s t-test. Representative images of lung bioluminescence are shown with colour scale (photons per s per cm2 per sr) for each independent group (ctrl and shRNA no. 1 or no. 2) c, Robo1 knockdown levels were confirmed by qPCR (n = 3). Two-tailed Student’s t-test. d, Blood vessel density was assessed by staining tumour sections with endomucin and DAPI. No significant difference in blood vessel density was detected between the control and Robo1-knockdown tumour groups (shRNA no. 1 or no. 2). Dot plot represents endomucin area relative to DAPI area for each tumour, quantified using ImageJ. Mean ± s.e.m. n = 5 each group. Two-tailed Student’s t-test. Scale bar, 50 μm.
Fig. 1 |
Fig. 1 |. Highly metastatic tumours induce SLIT2 expression in endothelial cells.
The RiboTag model and endothelial-specific (CDH5) Cre-mediated recombination were used to immunopurify haemagglutinin (HA)-tagged RPL22 ribosomal protein and associated transcripts for sequencing. a, b, Volcano plot (a) and bar chart (b) show log2-transformed fold differences in endothelial gene expression between highly metastatic B16F10 (n = 7) and poorly metastatic B16F0 (n = 5) tumours. Two-sided Wald tests. c, d, Dot plots depict Slit2 expression in tumour blood vessels determined by quantitative real-time PCR (c) (B16F0, n = 4; B16F10, n = 8; two-sided Mann–Whitney test), and fluorescent intensities of SLIT2 expression in tumour blood vessels (d) in highly metastatic B16F10 tumours (n = 8) compared to poorly metastatic B16F0 tumours (n = 8). Unpaired two-tailed Student’s t-test. Mean ± s.e.m. Representative immunofluorescent images (right) depict SLIT2 (green) and endomucin (red) expression, and DAPI staining (blue). Arrows indicate co-localization of SLIT2 and endomucin in blood vessels. e, Dot plots depict fluorescent intensities of SLIT2 protein immunostaining in tumour blood vessels in highly metastatic 4T1 (n = 8) and nonmetastatic 67NR (n = 8 unpaired two-tailed Student’s t-test) isogenic mammary tumours (e) and in mouse lung endothelial cells treated with conditioned medium from 67NR (n = 9) and 4T1 cells (f) (n = 9) (two-tailed Student’s t-test) cells. Representative images as in d. Data are mean ± s.e.m.
Fig. 2 |
Fig. 2 |. Endothelial-specific deletion of SLIT2 suppresses metastasis in several models of metastatic breast and lung cancer.
a, b, Slit2 expression by qPCR (mean Slit2 expression in ecSLIT2 knockout (KO) relative to wild type (WT) ± s.e.m; n = 3; two-tailed Student’s t-test) (a), and SLIT2 expression by western blot for ecSLIT2-knockout and wild-type mouse lung endothelial cells (MLECs). HSC70 was used as a loading control. c, Representative immunofluorescent images depict SLIT2 (green) and endomucin (red) expression, and DAPI staining (blue), in wild-type (left) and ecSLIT2-knockout (right) mice bearing 4T1 tumours. Arrows indicate co-localization of SLIT2 and endomucin in blood vessels. Three independent experiments. Scale bar, 100 μm. d, e, g, Dot plots represent numbers of metastatic lung nodules per mouse, from MMTV-PyMT ecSLIT2 wild-type (n = 12) and MMTV-PyMT ecSLIT2-knockout (n = 12) mice (two-tailed Mann–Whitney test) (d); 4T1-bearing wild-type (n = 4) and ecSLIT2-knockout (n = 5) mice (unpaired two-tailed Student’s t-test) (e); and Lewis-lung-carcinoma (LLC)-bearing wild-type (n = 5) and ecSLIT2-knockout (n = 7) mice (two-tailed Mann–Whitney test) (g). Representative haematoxylin and eosin (H&E) images of lungs are shown (right). f, h, Kaplan–Meier curves comparing post-surgical survival after primary tumour resection of 4T1-bearing wild-type (grey) (n = 11) and ecSLIT2-knockout (green) (n = 8) mice (Gehan–Breslow–Wilcoxon test) (f) and LLC-bearing wild-type (grey) (n = 16) and ecSLIT2-knockout (green) (n = 12) mice (Gehan–Breslow–Wilcoxon test) (h). In all H&E images, scale bars are 1 cm. Data are mean ± s.e.m.
Fig. 3 |
Fig. 3 |. Endothelial SLIT2 promotes intravasation and migration of tumour cells via tumoural ROBO1.
a, Left, dot plot depicts bioluminescence quantification of luciferase-positive circulating tumour cell colonies isolated from whole blood of wild-type (n = 10) and ecSLIT2-knockout (n = 10) mice. Unpaired two-tailed Student’s t-test. Right, representative images of luciferase-positive colonies cultured from blood. b, Schematic (left) and dot plot quantification (right) of quantified B16F10 and 4T1 tumour cells per optical field (10× magnification) that migrated across the transwell towards increasing concentrations of recombinant SLIT2. B16F10 and 4T1 migration, n = 4 for each condition. Two-tailed Student’s t-test. c, Schematic (left) and dot plot quantification (right) of 4T1 tumour cells per optical field that migrated across the transwell towards (middle and right) no endothelial cells (EC) (n = 3), wild-type endothelial cells (n = 3) and SLIT2-overexpressing (OE) endothelial cells (n = 3). Bar chart (right) depicts the same migration assay with no endothelial cells (n = 4), wild-type endothelial cells (n = 4) or ecSLIT2-knockout endothelial cells (n = 4). Two-tailed Student’s t-test. df, Dot plots represent number of control or Robo1 shRNA-depleted B16F10 tumour cells that migrated towards 300 ng ml−1 recombinant mouse SLIT2 per optical field (10× magnification). d, Scrambled shRNA control (control, n = 4; SLIT2, n = 4). e, Robo1 shRNA hairpin 1 (control, n = 4; SLIT2, n = 4). f, Robo1 shRNA hairpin 2 (control, n = 4; SLIT2, n = 4). Two-tailed Student’s t-test. g, h, Dot plot represents NIH tissue microarray of blood vessels of primary human breast cancer (g) or Abcam tissue array of breast cancer vessels (h) with vascular or tumoural SLIT2 fluorescence intensity of lymph-node (LN)-negative (n = 28) and -positive (n = 46) primary breast cancers (g) (unpaired one-tailed Student’s t-test) or primary (n = 15) or lymph-node-metastatic (n = 15) cancers (h) (two-tailed Student’s t-test). Data are mean ± s.e.m.
Fig. 4 |
Fig. 4 |. dsRNA secreted by metastatic cells activates endothelial TLR3 to induce SLIT2 expression.
a, b, Dot plots represent Slit2 mRNA expression by qPCR in endothelial cells exposed to 4T1 conditioned medium (CM) (n = 3), basal OPT medium (control, n = 3), and 4T1 conditioned medium that had undergone 10-kDa (n = 3) or 50-kDa (n = 3) filtration (a) or RNase A treatment (25 μg ml−1) (n = 3) (b). Two-tailed Student’s t-test. c, d, Same as a, except that poly(I:C) (2.5 μg ml−1) was added to basal medium (control, n = 3; conditioned medium, n = 3; poly(I:C), n = 3) (two-tailed Student’s t-test) (c) or to 10-kDa-filtered 4T1 conditioned medium (conditioned medium, n = 3; +poly(I:C), n = 3) (d). One-tailed Student’s t-test. e, Same as a, except dimethyl sulfoxide (DMSO) (control, n = 3; conditioned medium, n = 3) or CU CPT 4a (control, n = 3; conditioned medium, n = 3) was added. Two-tailed Student’s t-test. f, Dot plot depicting Slit2 mRNA levels (by qPCR) induced by diluted 4T1 conditioned medium (1:8) in either wild-type endothelial cells (control, n = 3; conditioned medium, n = 3) or TLR3-knockout endothelial cells (control, n = 3; conditioned medium, n = 3). Two-tailed Student’s t-test. af, Biological replicates, each replicate represented by different symbol. g, Dot plot represents the number of metastatic lung nodules per mouse (left) and representative images of MMTV-PyMT-driven tumours (right) in tuSLIT2-knockout (n = 12) and wild-type (n = 10) mice. One-tailed Student’s t-test. Scale bar, 1 cm. h, Dot plot represents ROBO1 expression in 4T1-Luc-zsGreen cells expressing control shRNA (control shRNA, n = 4) or Robo1 shRNA (n = 4). Two-tailed Student’s t-test. i, Dot plot represents bioluminescence signal of whole-blood-derived circulating tumour cell colonies from tumours expressing control or Robo1 shRNA in NSG mice that were injected intravenously with 25 μg poly(I:C) or phosphate-buffered saline (PBS). Control shRNA: control, n = 3; poly(I:C), n = 4. Robo1 shRNA1: control, n = 4; poly(I:C), n = 4. Two-tailed Student’s t-test. Representative images (right) of bioluminescence imaging of plates containing circulating tumour cell colonies. j, Proposed model. Highly metastatic tumour cells release dsRNA, which is detected by endothelial-cell TLR3 RNA-sensing receptors—leading to endothelial SLIT2 induction. Endothelial SLIT2 acts on tumoural ROBO1 receptors to drive tumour-cell migration towards vessels, which facilitates intravasation by tumour cells and, consequently, metastatic dissemination. Data are mean ± s.e.m.

References

    1. Strilic B et al. Tumour-cell-induced endothelial cell necroptosis via death receptor 6 promotes metastasis. Nature 536, 215–218, doi:10.1038/nature19076 (2016). - DOI - PubMed
    1. Png KJ, Halberg N, Yoshida M & Tavazoie SF A microRNA regulon that mediates endothelial recruitment and metastasis by cancer cells. Nature 481, 190–194, doi:10.1038/nature10661 (2012). - DOI - PubMed
    1. Pencheva N et al. Convergent multi-miRNA targeting of ApoE drives LRP1/LRP8-dependent melanoma metastasis and angiogenesis. Cell 151, 1068–1082, doi:10.1016/j.cell.2012.10.028 (2012). - DOI - PMC - PubMed
    1. Pencheva N & Tavazoie SF Control of metastatic progression by microRNA regulatory networks. Nat Cell Biol 15, 546–554, doi:10.1038/ncb2769 (2013). - DOI - PMC - PubMed
    1. Rafii S, Butler JM & Ding BS Angiocrine functions of organ-specific endothelial cells. Nature 529, 316–325, doi:10.1038/nature17040 (2016). - DOI - PMC - PubMed

Methods References

    1. Tavazoie SF et al. Endogenous human microRNAs that suppress breast cancer metastasis. Nature 451, 147–U143, doi:Doi 10.1038/Nature06487 (2008). - DOI - PMC - PubMed
    1. Reynolds LE & Hodivala-Dilke KM Primary mouse endothelial cell culture for assays of angiogenesis. Methods Mol Med 120, 503–509 (2006). - PubMed
    1. Aslakson CJ & Miller FR Selective events in the metastatic process defined by analysis of the sequential dissemination of subpopulations of a mouse mammary tumor. Cancer Res 52, 1399–1405 (1992). - PubMed
    1. Fidler IJ Biological behavior of malignant melanoma cells correlated to their survival in vivo. Cancer Res 35, 218–224 (1975). - PubMed
    1. May T et al. Establishment of murine cell lines by constitutive and conditional immortalization. J Biotechnol 120, 99–110, doi:10.1016/j.jbiotec.2005.03.027 (2005). - DOI - PubMed

Publication types

MeSH terms

Substances