. 2020 Oct;586(7829):457-462.
doi: 10.1038/s41586-020-2770-2. Epub 2020 Sep 30.

Structural basis for pH gating of the two-pore domain K+ channel TASK2

Affiliations

Structural basis for pH gating of the two-pore domain K+ channel TASK2

Baobin Li et al. Nature. 2020 Oct.

Abstract

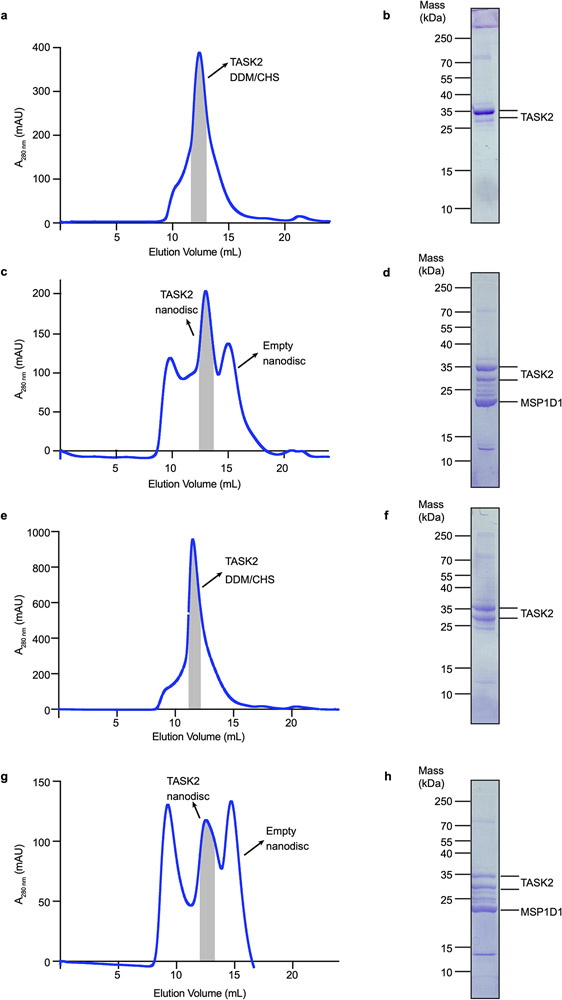
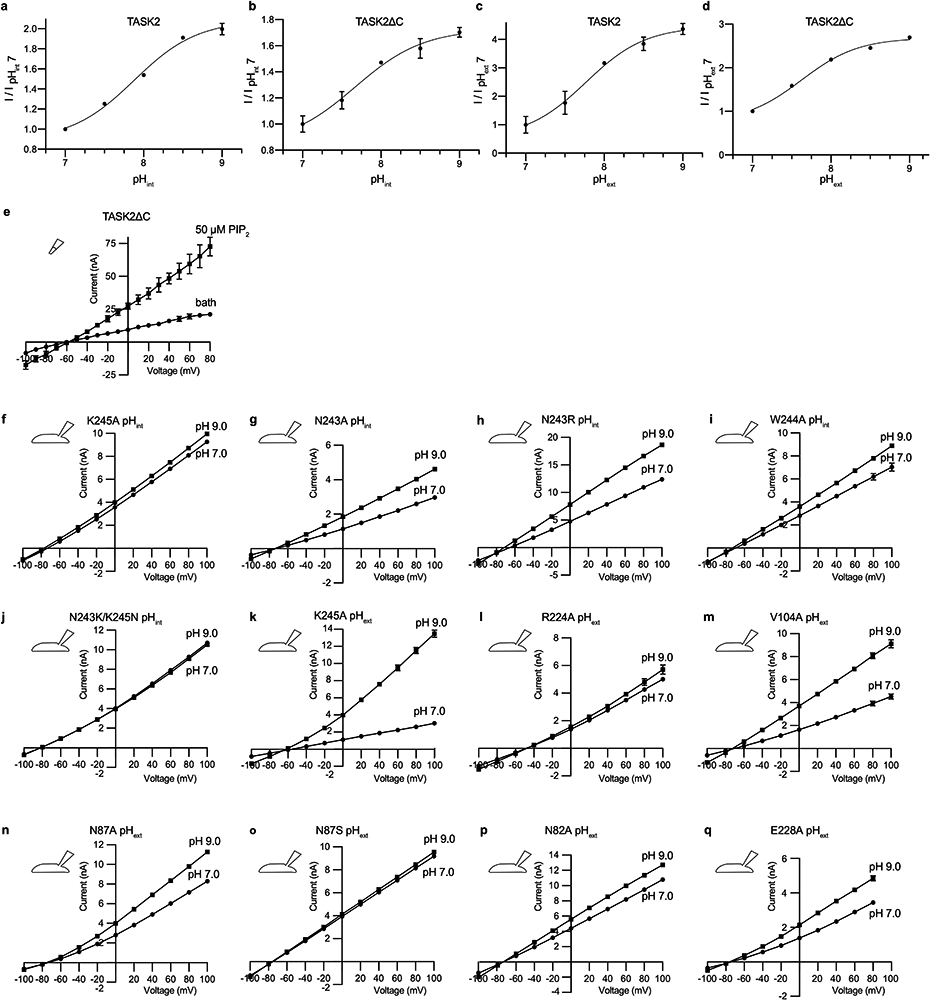
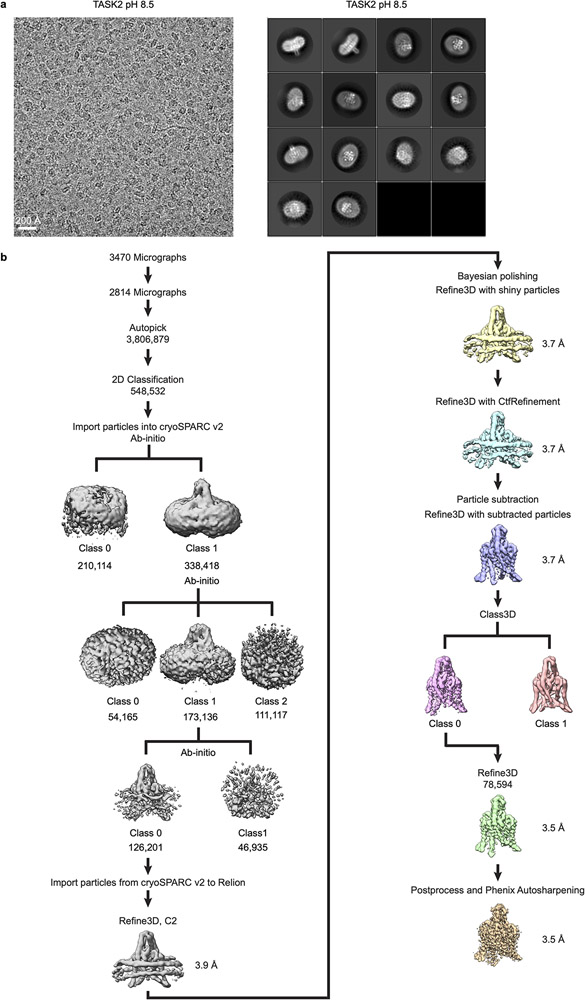
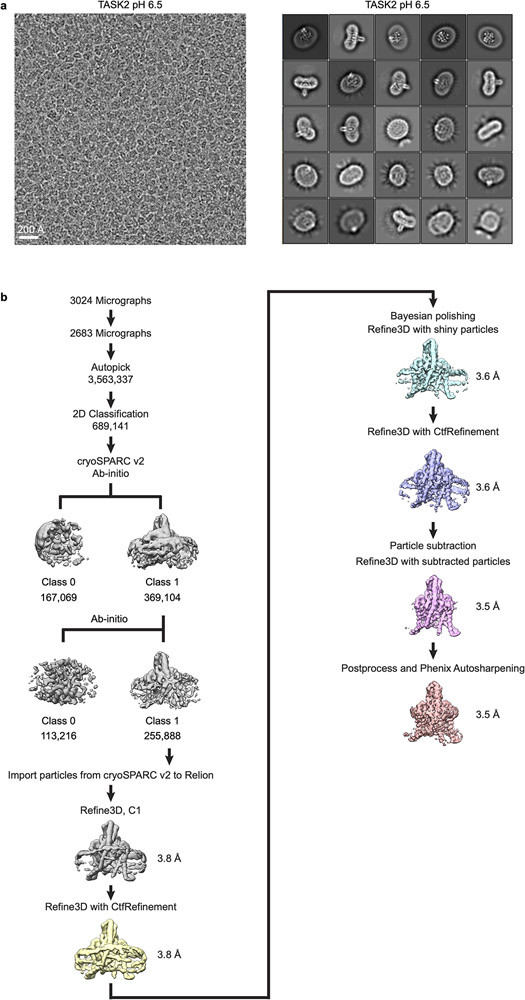
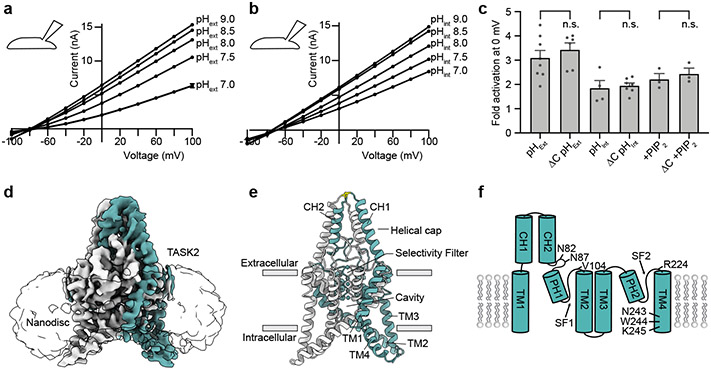
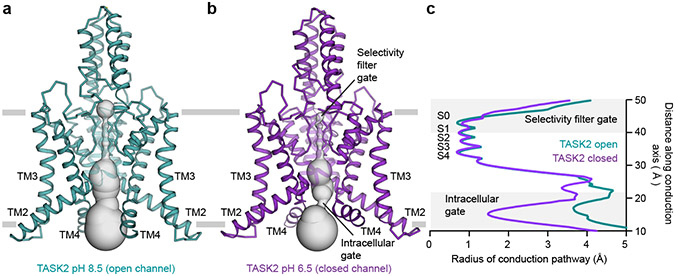
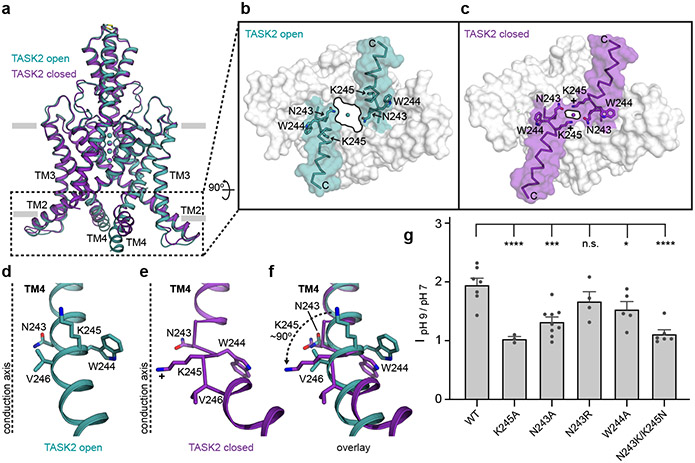
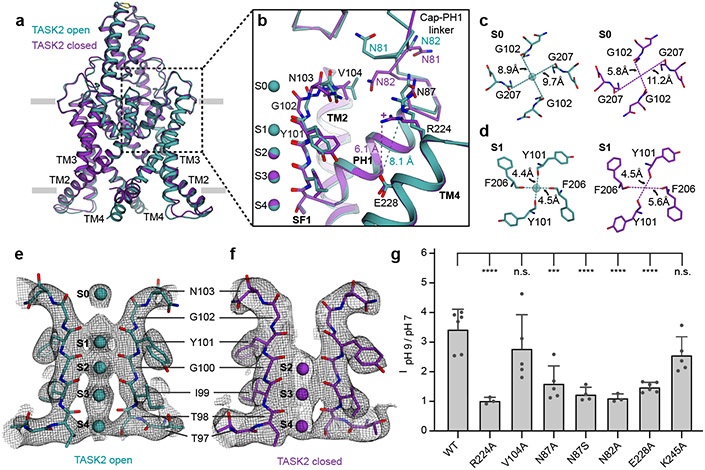
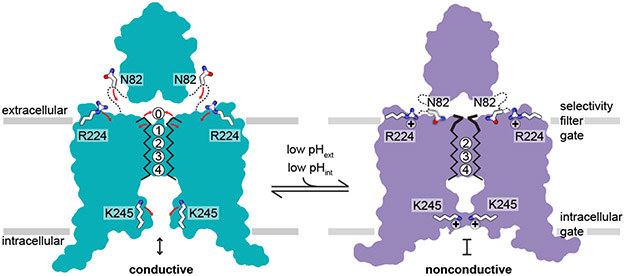
TASK2 (also known as KCNK5) channels generate pH-gated leak-type K+ currents to control cellular electrical excitability1-3. TASK2 is involved in the regulation of breathing by chemosensory neurons of the retrotrapezoid nucleus in the brainstem4-6 and pH homeostasis by kidney proximal tubule cells7,8. These roles depend on channel activation by intracellular and extracellular alkalization3,8,9, but the mechanistic basis for TASK2 gating by pH is unknown. Here we present cryo-electron microscopy structures of Mus musculus TASK2 in lipid nanodiscs in open and closed conformations. We identify two gates, distinct from previously observed K+ channel gates, controlled by stimuli on either side of the membrane. Intracellular gating involves lysine protonation on inner helices and the formation of a protein seal between the cytoplasm and the channel. Extracellular gating involves arginine protonation on the channel surface and correlated conformational changes that displace the K+-selectivity filter to render it nonconductive. These results explain how internal and external protons control intracellular and selectivity filter gates to modulate TASK2 activity.


Figures

Extended Data Figure 1 –
Extended Data Figure 1 –. Purification and reconstitution of TASK2.
(a-d) Data for assembly of TASK2-nanodisc samples at pH 8.5. (a) Chromatogram from a Superdex 200 gel filtration of TASK2 purified in DDM/CHS. (b) Coomassie-stained SDS-PAGE of pooled TASK2-containing fractions indicated by gray bar in (a). (c) Chromatogram from Superdex 200 gel filtration of TASK2 reconstituted in MSP1D1 lipid nanodiscs. (d) Coomassie-stained SDS-PAGE of final pooled TASK2-MSP1D1 nanodisc sample indicated by gray bar in (c). (e-h) Same as (a-d), but for samples at pH 6.5. Purifications were performed once. Gels were run once. For gel source data, see Supplementary Fig. 3.
Extended Data Figure 2 –
Extended Data Figure 2 –. pH and PIP2 dependence of TASK2 and pH dependence of TASK2 mutant constructs
(a,b) pHint and (c,d) pHext dependence from a representative cell expressing (a,c) full length TASK2 and (b,d) the C-terminally truncated TASK2 construct used for structure determination. Normalized fold-activation of current by (a,b) alkaline pHint (pHint =9/pHint =7 at 0 mV) or (c,d) alkaline pHext versus pH is plotted. Mean ± s.e.m. from three sweeps are plotted. Fits to Hill equations are drawn with pK1/2=7.7, 7.9, 7.8, and 7.6 and Hill slope=1.0, 1.1, 1.1, and 1.2 for (a-d), respectively. Plots are shown with different scales. (e) Current-voltage relationships from a representative inside-out patch from a TASK2-expressing cell before (circles) and after (squares) the addition of 50μM C8-PIP2. (f-j) Current-voltage relationships recorded from a representative cell expressing TASK2 mutants K245A, N243A, N243R, W244A, and N243K/K245N with pHint=7 (circles) and pHint=9. (squares). (k-q) Current-voltage relationships recorded from a representative cell expressing TASK2 mutants K245A, R224A, V104A, N87A, N87S, N82A, and E228A with pHext=7 (circles) and pHext=9. (squares). Data in (e-q) are mean currents ± s.e.m. from three consecutive sweeps at the indicated voltage.
Extended Data Figure 3 –
Extended Data Figure 3 –. Cryo-EM processing pipeline for TASK2 at pH 8.5
(a) Example micrograph (left) and selected 2D class averages (right) of TASK2 in MSP1D1 lipid nanodiscs at pH 8.5. 2D classification was performed with an extracted box size of 200 pixels. (b) cryo-EM data processing steps in Relion and cryoSPARC2. See Methods for details. Cryo-EM data were collected once. The micrograph in (a) is representative of the 2814 micrographs selected for analysis.
Extended Data Figure 4 –
Extended Data Figure 4 –. Cryo-EM processing pipeline for TASK2 at pH 6.5
(a) Example micrograph (left) and selected 2D class averages (right) of TASK2 in MSP1D1 lipid nanodiscs at pH 6.5. 2D classification was performed with an extracted box size of 160 pixels. (b) cryo-EM data processing steps in Relion and cryoSPARC2. See Methods for details. Cryo-EM data were collected once. The micrograph in (a) is representative of the 2683 micrographs selected for analysis.
Extended Data Figure 5 –
Extended Data Figure 5 –. Cryo-EM validation
Data for TASK2-nanodisc samples at (a-d) pH 8.5 and (e-h) pH 6.5. (a,e) Angular distribution of particles used in final refinement with final map for reference. (b,f) Local resolution estimated in Relion colored as indicated on the final map. TM4s are indicated in a view from the cytoplasm. (c,g) Fourier Shell Correlation (FSC) relationships between (black) the two unfiltered half-maps from refinement and used for calculating overall resolution at 0.143, (teal) final map versus model, (pink) half-map one versus model, and (orange) half-map two versus model. (d,h) Cryo-EM density carved around TM4A and TM4B with the position of K245 indicated.
Extended Data Figure 6 –
Extended Data Figure 6 –. Extracellular ion pathways and lateral membrane openings in TASK2
(a,b) Structures of TASK2 determined at (a) pH 8.5 and (b) pH 6.5. The surface of a bifurcated extracellular pathway from the top of the selectivity filter underneath the helical cap to the extracellular solution on either side is shown in gray. (c) Radius of the extracellular pathway as a function of distance from the conduction axis. The path is similarly accessible to K+ ions in both structures. (d,e) View from the membrane plane of the cytoplasmic sides of TASK2 TM4 and TM2 from (d) low pH (closed) (e) high pH (open) structures. Protein surface is shown half transparent. (f) Change in channel cross sectional area upon opening as a function of membrane depth for TASK2 and TRAAK. TRAAK expands within the membrane upon opening while TASK2 constricts near the membrane-cytoplasm interface. (g,h) View from the membrane plane of the cytoplasmic sides of TRAAK TM4 and TM2 from (g) nonconductive (closed) and (h) conductive (open) structures. (i) Minimum cross-sectional areas of membrane-facing lateral openings in TASK2 closed, and TASK2 open, TRAAK closed, and TRAAK open structures. Cross-sectional areas for each structure correspond to the narrowest 1 Å segment of a path connecting the channel cavity and membrane bilayer calculated using a spherical probe. The cross-sectional area of a lipid acyl chain methylene is drawn with a dashed line for comparison. An acyl chain could access the cavity of TASK2 and TRAAK channels in closed, but not open, conformations.
Extended Data Figure 7 –
Extended Data Figure 7 –. Comparison of selectivity filters and selectivity filter gates in TASK2 and other K+ channels
(a-n) Two opposing selectivity filter regions and positions of bound K+ ions from structures of the channels indicated: (a) open TASK2 SF1, (b) closed TASK2 SF1, (c) overlaid open and closed TASK2 SF1s, (d) open TASK2 SF2, (e) closed TASK2 SF2, (f) overlaid open and closed TASK2 SF2s, (g) open Kv1.1-2.1, (h) inactivated Kv1.1-2.1 mutant V406W, (i) overlaid open and inactivated Kv1.1-2.1 mutant V406W, (j) overlaid inactivated Kv1.1-2.1 and closed TASK2 SF1, (k) open KcsA, (l) low K+ inactivated KcsA, (m) overlaid open and inactivated KcsA, and (n) overlaid inactivated KcsA and closed TASK2 SF1.
Extended Data Figure 8 –
Extended Data Figure 8 –. Comparison of inner gates in TASK2 and other K+ channels
(a-g) Stereo views from the membrane plane highlighting inner gate regions of selected K+ channels: (a) open MthK, (b) closed KcsA, (c) open TASK2, (d) closed TASK2, and (e) closed TASK1. (f) An overlay of the TASK2 open and closed structures with the canonical “bundle crossing” inner gating channels KcsA and MthK, colored as in (a-d). (g) An overlay of the TASK2 open and closed structures with TASK1, with a distinct inner “X” gate, colored as in (c-e).
Figure 1 –
Figure 1 –. Structure and function of TASK2
Current-voltage relationships from a TASK2-expressing whole cell in response to varied (a) pHext and (b) pHint. Currents in (a,b) are mean ± s.e.m. from three sweeps at each voltage. (c) Normalized fold-activation of full length TASK2 (3.10±0.31) and TASK2ΔC (3.43±0.28) by pHext=9/pHext=7, of full length TASK2 (1.85±0.32) and TASK2ΔC (1.95±0.11) by pHint=9/pHint=7, and of full length TASK2 (2.21±0.24) and TASK2ΔC (2.43±0.24) by 50 μM di-C8 PIP2. Mean ± s.e.m. are reported and plotted for n=8, 6, 4, 7, 3, and 3 cells from 2, 3, 2, 4, 2, and 3 independent transfections, respectively. Differences were assessed with unpaired two-tailed Student’s t-test. P=0.45, 0.72, and 0.54 (P>0.05 not significant (n.s.)) for pHext, pHint, and PIP2, respectively. (d) Cryo-EM map at pH 8.5 viewed from the membrane plane with density for nanodisc transparent and for TASK protomers teal and white. (e) TASK2 structure at pH 8.5 colored as in (d) with K+ ions teal and disulfide yellow. (f) Cartoon representation of a TASK2 protomer with transmembrane helices (TM1-4), cap helices (CH1,2), pore helices (PH1,2), selectivity filters (SF1,2), and key residues discussed in the text indicated.
Figure 2 –
Figure 2 –. Comparison of open and closed TASK2 structures captured in high and low pH
Structures of TASK2 determined at (a) pH 8.5 and (b) pH 6.5. The surface of the conduction pathway through the channel is shown in gray. (c) Radius of the channel interior as a function of distance along the conduction pathway. Plot is drawn at the same scale as surfaces in (a,b). The positions of K+ coordination sites S0-S4, the extracellular selectivity filter gate, and the intracellular gate at the membrane-cytoplasm interface are indicated.
Figure 3 –
Figure 3 –. A TASK2 intracellular gate controlled by pHint
(a) Overlay of closed and open conformations of TASK2 viewed from the membrane plane highlighting conformational changes in the cytoplasmic end of TM4. (b,c) Surface representation of the region boxed in (a) viewed from the cytoplasmic side for (b) open and (c) closed channels. Residues involved in gating and the positive charge on K245 at low pH are indicated. (d-f) View from the membrane plane of one TM4 and intracellular gating residues from (d) open, (e) closed, and (f) and both structures overlaid. In (d) and (e), a dashed line is drawn at the center of the K+ conduction axis for reference. (g) Normalized fold-activation of current by alkaline pHint (pHint=9/pHint=7 at 0 mV) for wildtype TASK2 (1.95±0.11) and mutants K245A (1.03±0.04), N243A (1.32±0.08), N243R (1.67±0.16), W244A (1.53±0.13), and N243K/K245N (1.11±0.07). Mean ± s.e.m. are reported and plotted for n=7, 3, 9, 4, 5, 6 cells from 4, 2, 5, 3, 2, and 2 independent transfections, respectively. Differences were assessed with a one-way ANOVA with Dunnett correction for multiple comparisons. P<0.0001(****) for K245A and N243K/K245N. P=0.0002(***), 0.04(*), and 0.34 (n.s., not significant) for N243A, W244A, and N243R, respectively.
Figure 4 –
Figure 4 –. A TASK2 selectivity filter gate controlled by pHext
(a) Overlay of closed and open conformations of TASK2 viewed from the membrane plane highlighting conformational changes in the extracellular side of the selectivity filter. (b) View of the region boxed in (a). Residues involved in gating and the positive charge on R224 at low pH are indicated. (c,d) Inter-carbonyl distances at K+-binding sites (c) S0 and (d) S1 in open and closed structures viewed from the extracellular side. (e,f) Comparison of ion occupancy in the selectivity filter of cryo-EM maps from (e) open TASK2 and (f) closed TASK2. (g) Normalized fold-activation of current by alkaline pHext (pHext=9/pHext=7 at 0 mV) for wild-type TASK2 (3.43±0.28 (n=6)) and mutants R224A (1.02±0.07 (n=3)), V104A (2.78±0.51 (n=5)), N87A (1.60±0.27 (n=5)), N87S (1.24±0.12 (n=4)), N82A (1.11±0.08 (n=3)), E228A (1.48±0.07 (n=6)), and K245 (2.56±0.28 (n=5)). Mean ± s.e.m. are reported and plotted for n=6, 3, 5, 5, 4, 3, 6, and 5 cells from 3, 1, 2, 2, 2, 1, 2, and 2 independent transfections, respectively. Differences were assessed with a one-way ANOVA with Dunnett correction for multiple comparisons. P<0.0001(****) for N82A, N87S, R224A, and E228A. P=0.0002(***), 0.14, and 0.39 (n.s., not significant) for N87A, K245A, and V104A, respectively.
Figure 5 –
Figure 5 –. Structural model for pH gating of the TASK2 channel
At high pH, TASK2 is conductive. An unobstructed path for K+ exists from the cytoplasmic to extracellular solution through the channel cavity and selectivity filter with four internal and one extracellular K+ coordination sites. At low pH, TASK2 is nonconductive. Protonation of K245 and conformational changes in TM4 create a protein seal at the inner gate. Protonation of R224 and conformational changes relayed to the K+ sites S0 and S1 sites disfavor K+ coordination at the selectivity filter gate.

References

    1. Reyes R et al. Cloning and expression of a novel pH-sensitive two pore domain K+ channel from human kidney. J Biol Chem 273, 30863–30869 (1998). - PubMed
    1. Enyedi P & Czirják G Molecular background of leak K+ currents: two-pore domain potassium channels. Physiol Rev 90, 559–605 (2010). - PubMed
    1. Cid LP et al. TASK-2: a K2P K(+) channel with complex regulation and diverse physiological functions. Front Physiol 4, 198 (2013). - PMC - PubMed
    1. Niemeyer MI, Cid LP, Barros LF & Sepúlveda FV Modulation of the two-pore domain acid-sensitive K+ channel TASK-2 (KCNK5) by changes in cell volume. J Biol Chem 276, 43166–43174 (2001). - PubMed
    1. Warth R et al. Proximal renal tubular acidosis in TASK2 K+ channel-deficient mice reveals a mechanism for stabilizing bicarbonate transport. Proc Natl Acad Sci USA 101, 8215–8220 (2004). - PMC - PubMed

Publication types

MeSH terms