. 2020 Nov;587(7832):103-108.
doi: 10.1038/s41586-020-2778-7. Epub 2020 Sep 30.

A single bacterial genus maintains root growth in a complex microbiome

Affiliations

A single bacterial genus maintains root growth in a complex microbiome

Omri M Finkel et al. Nature. 2020 Nov.

Abstract

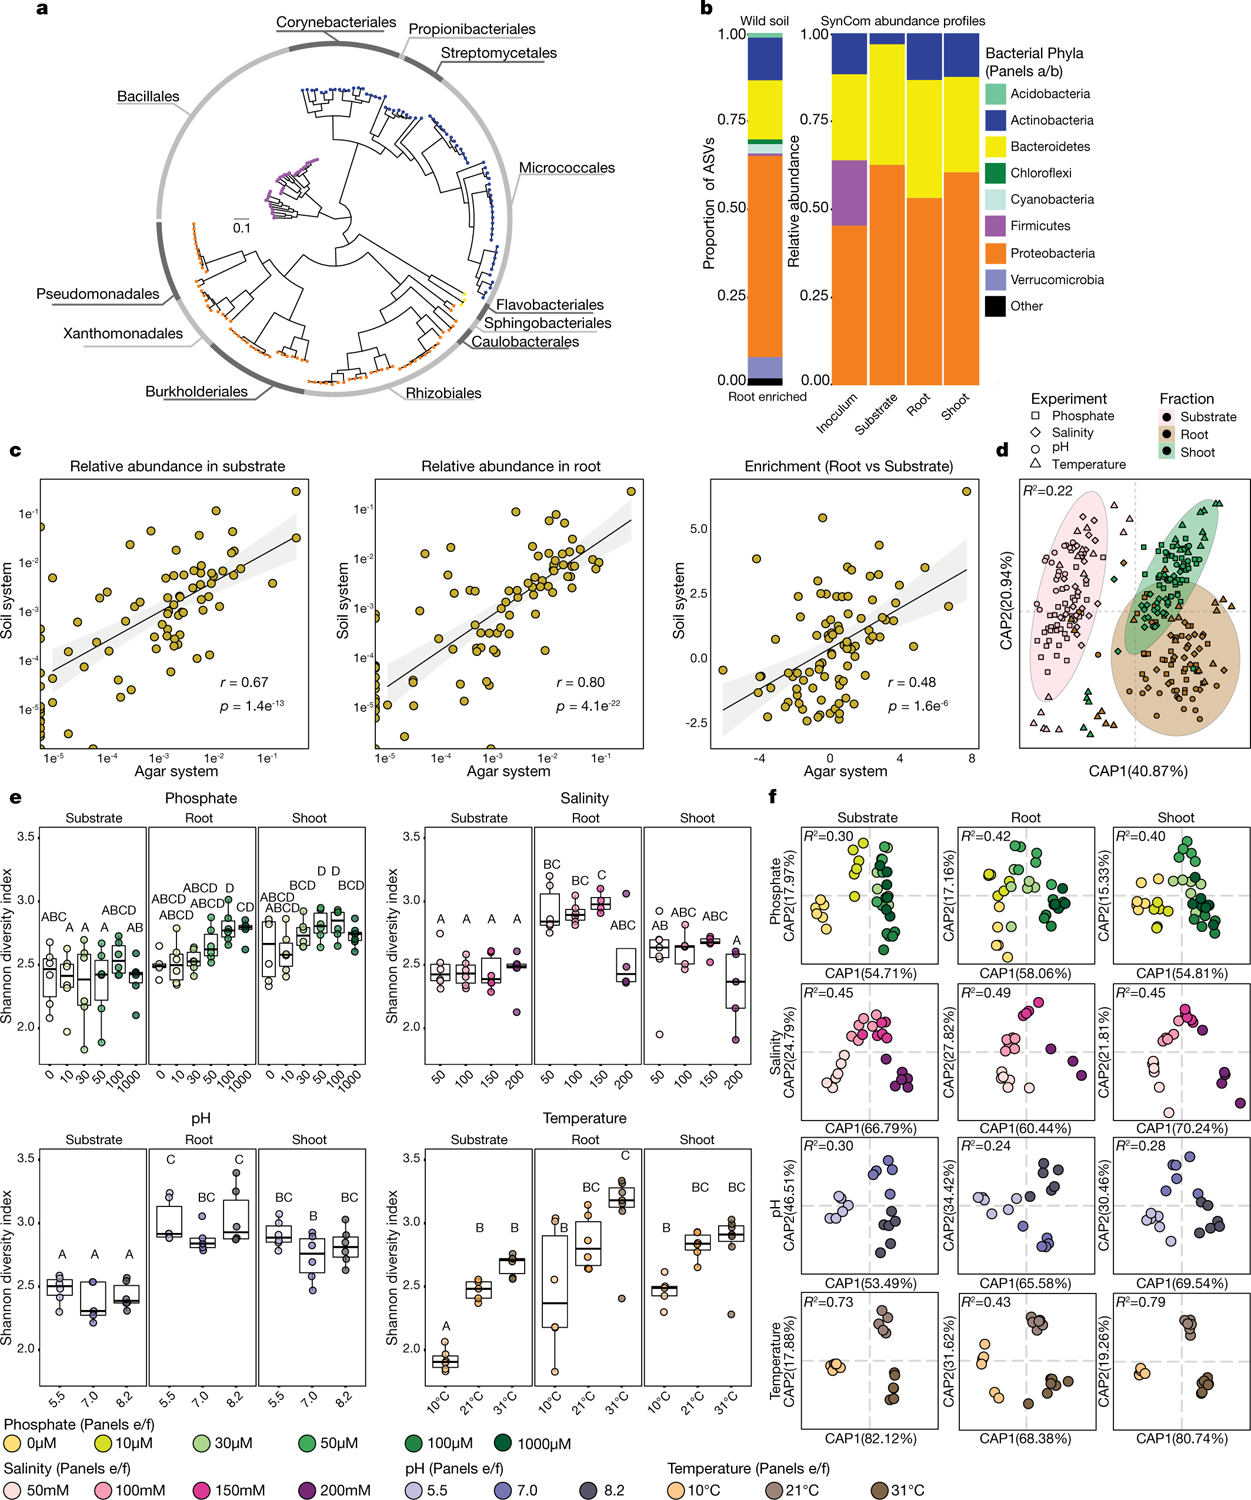
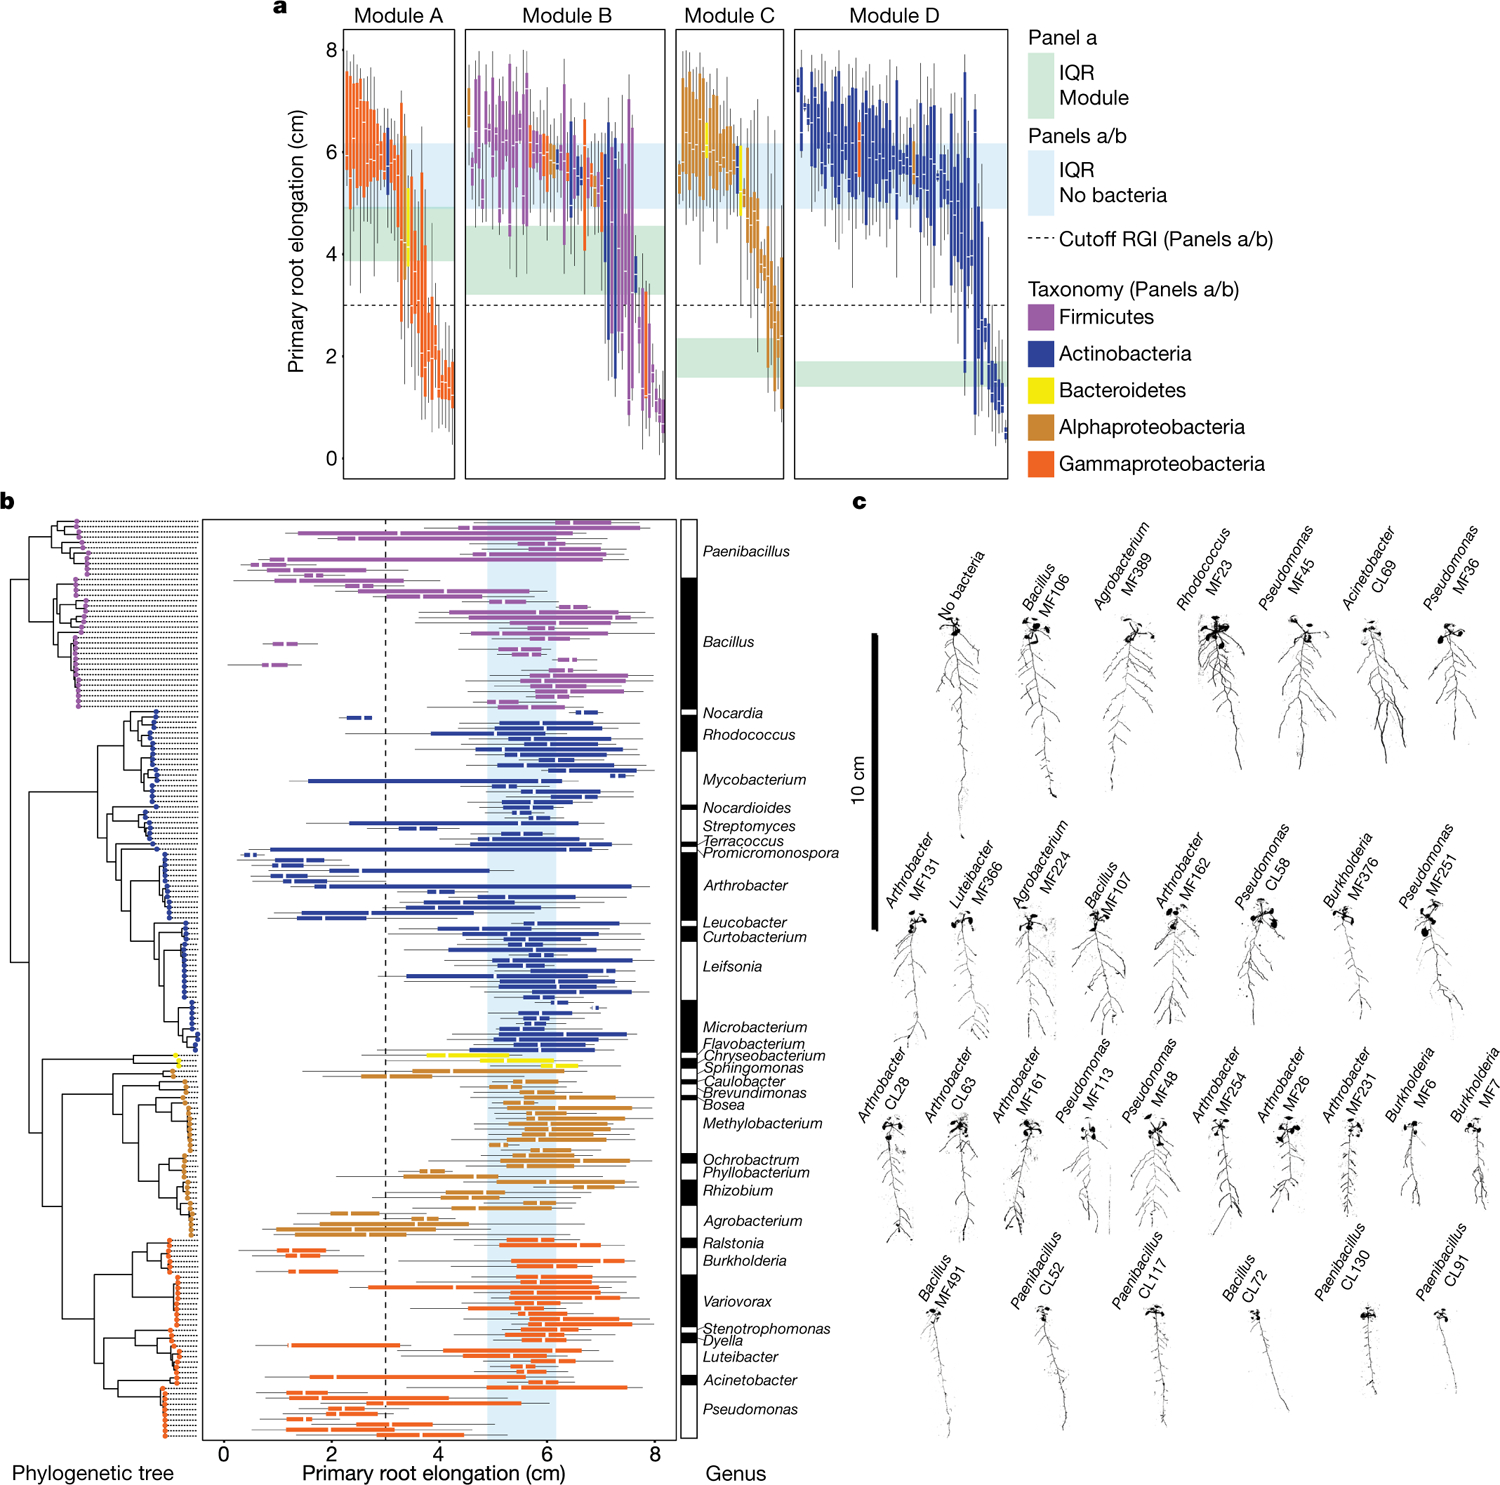
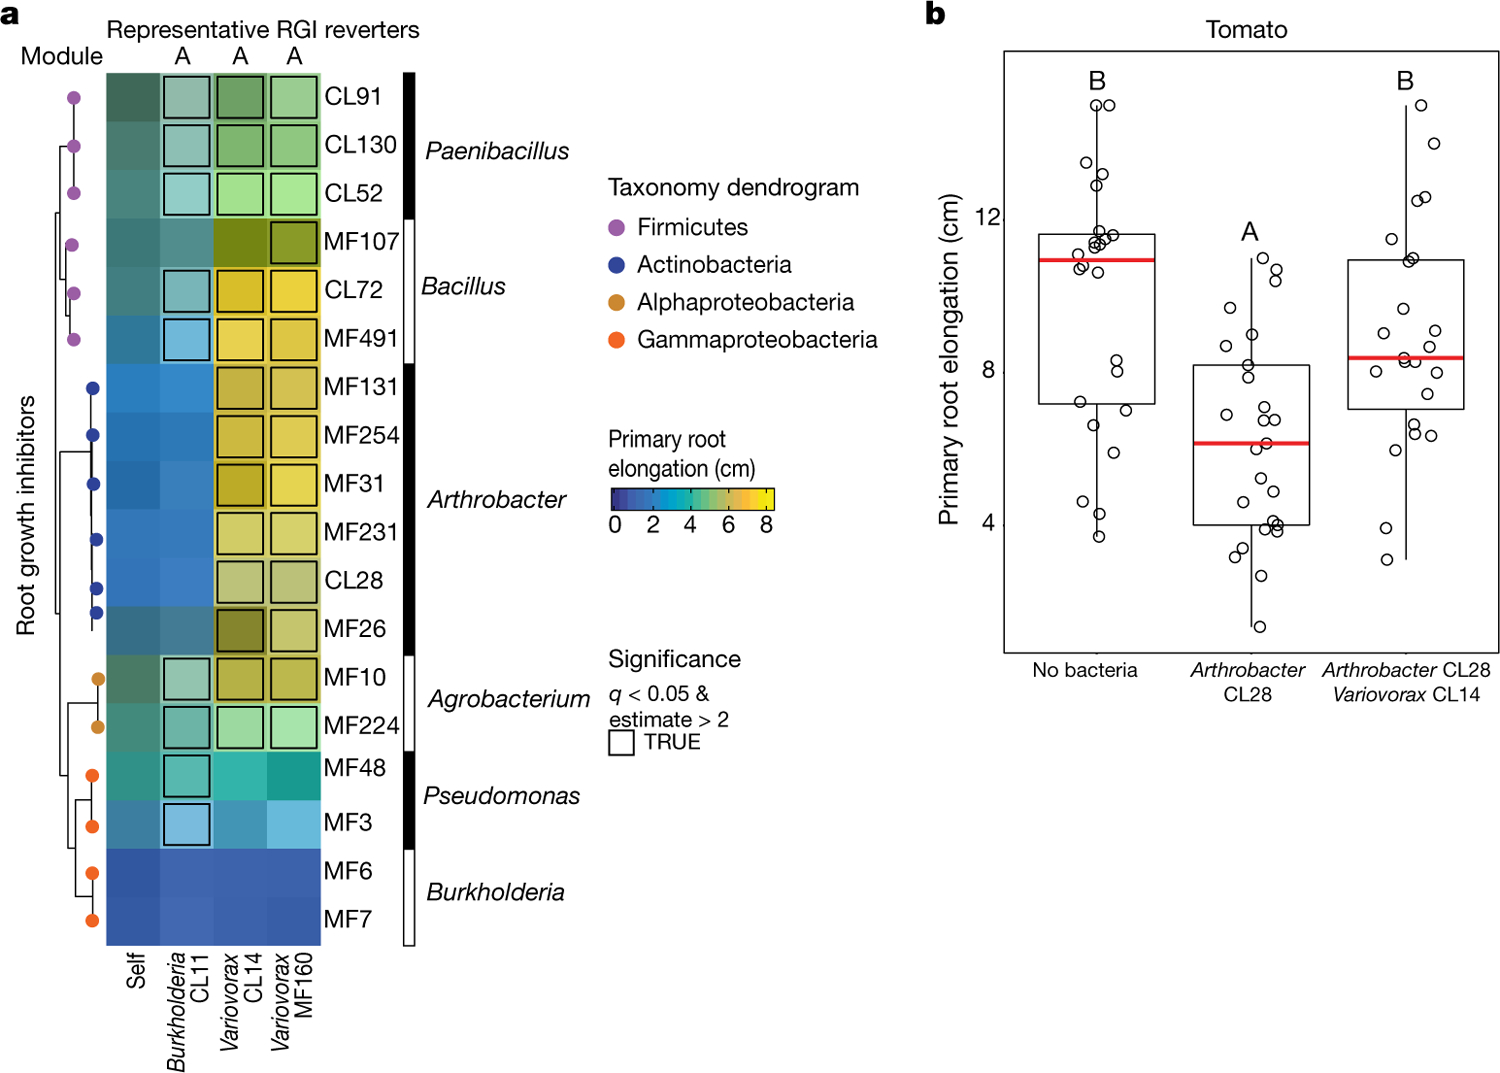
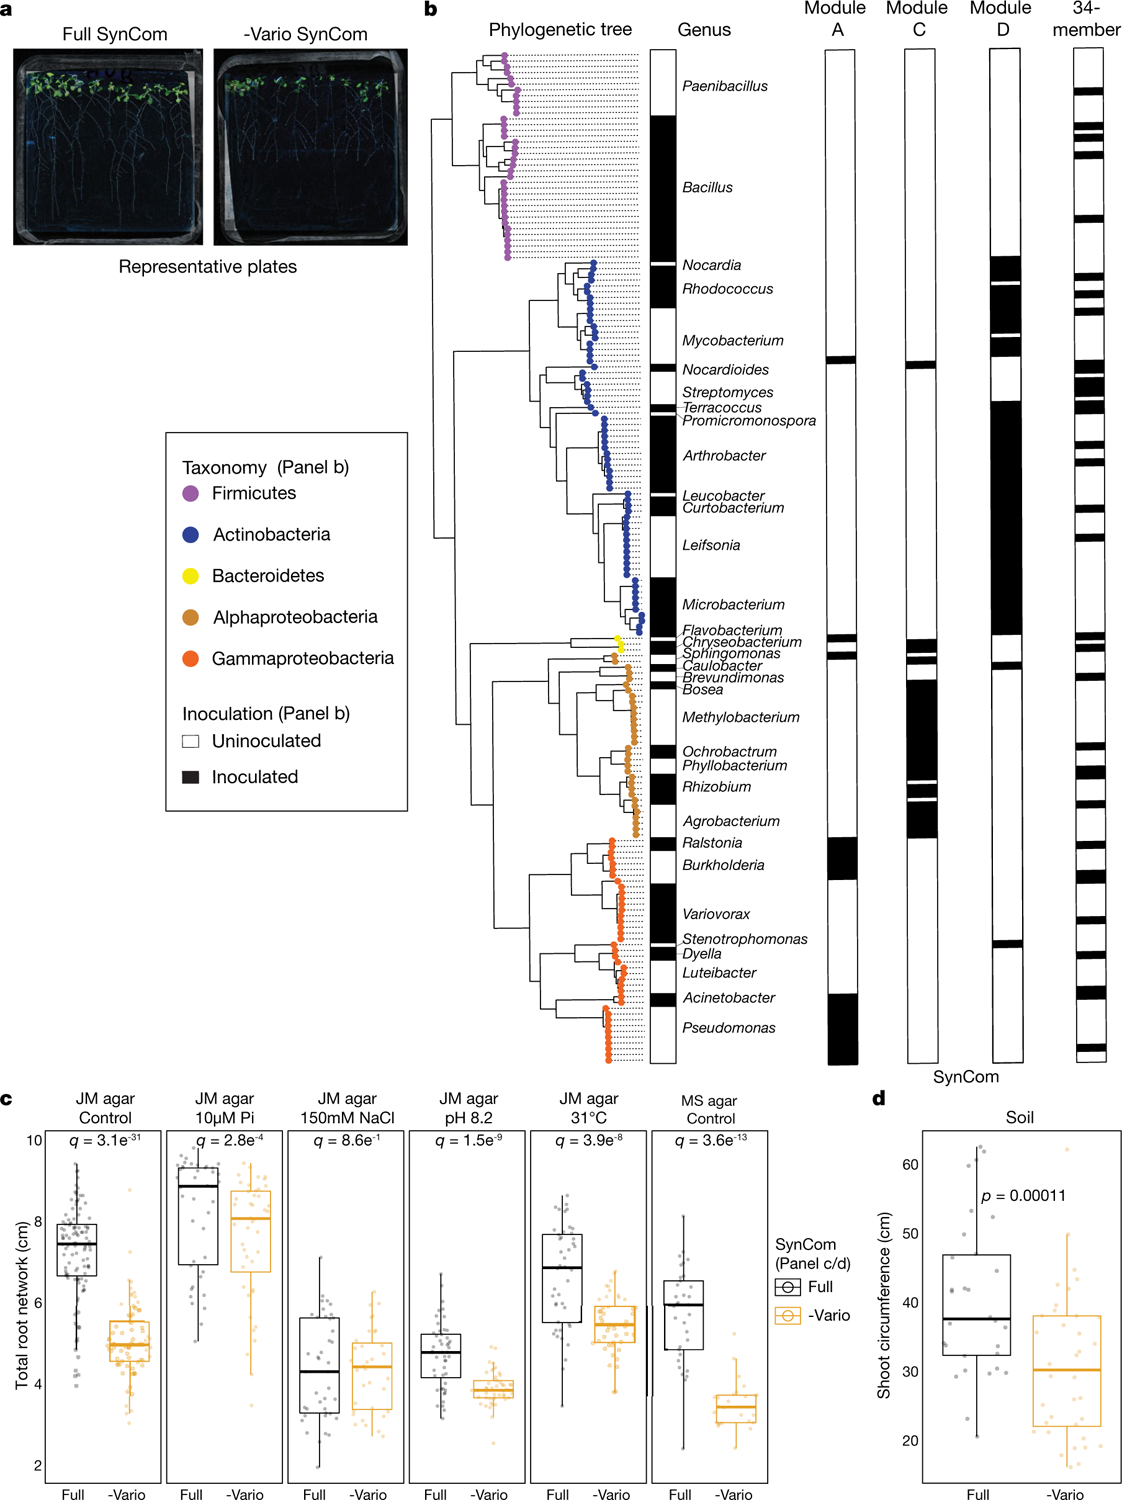
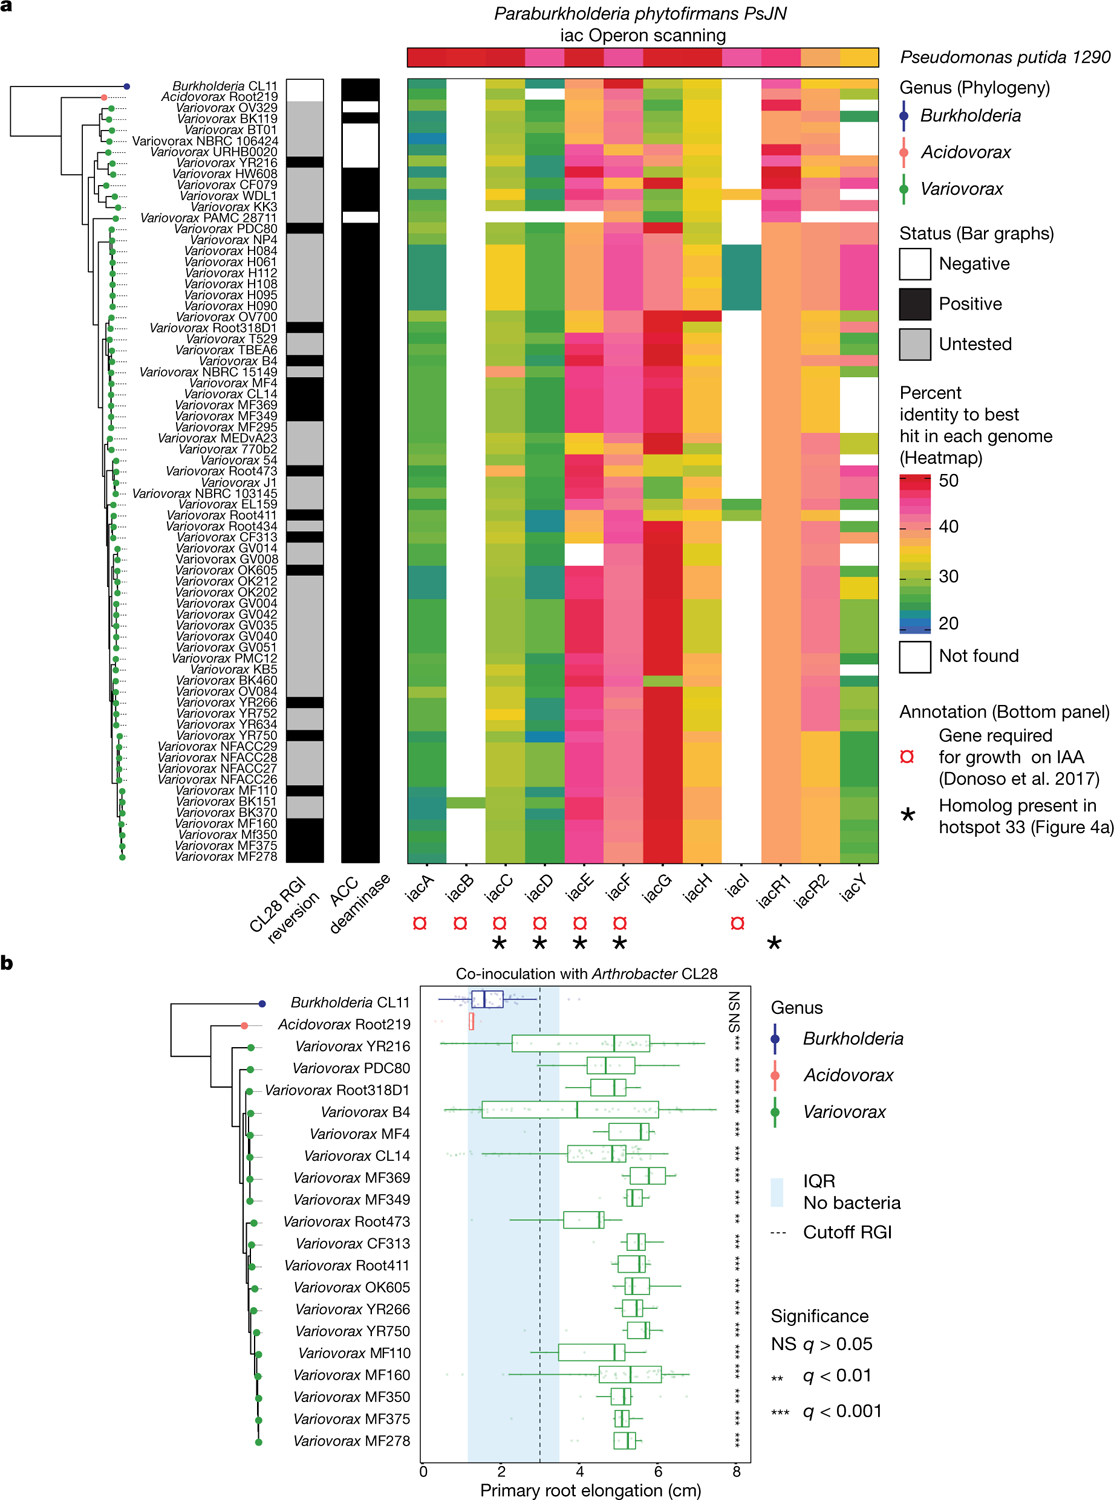
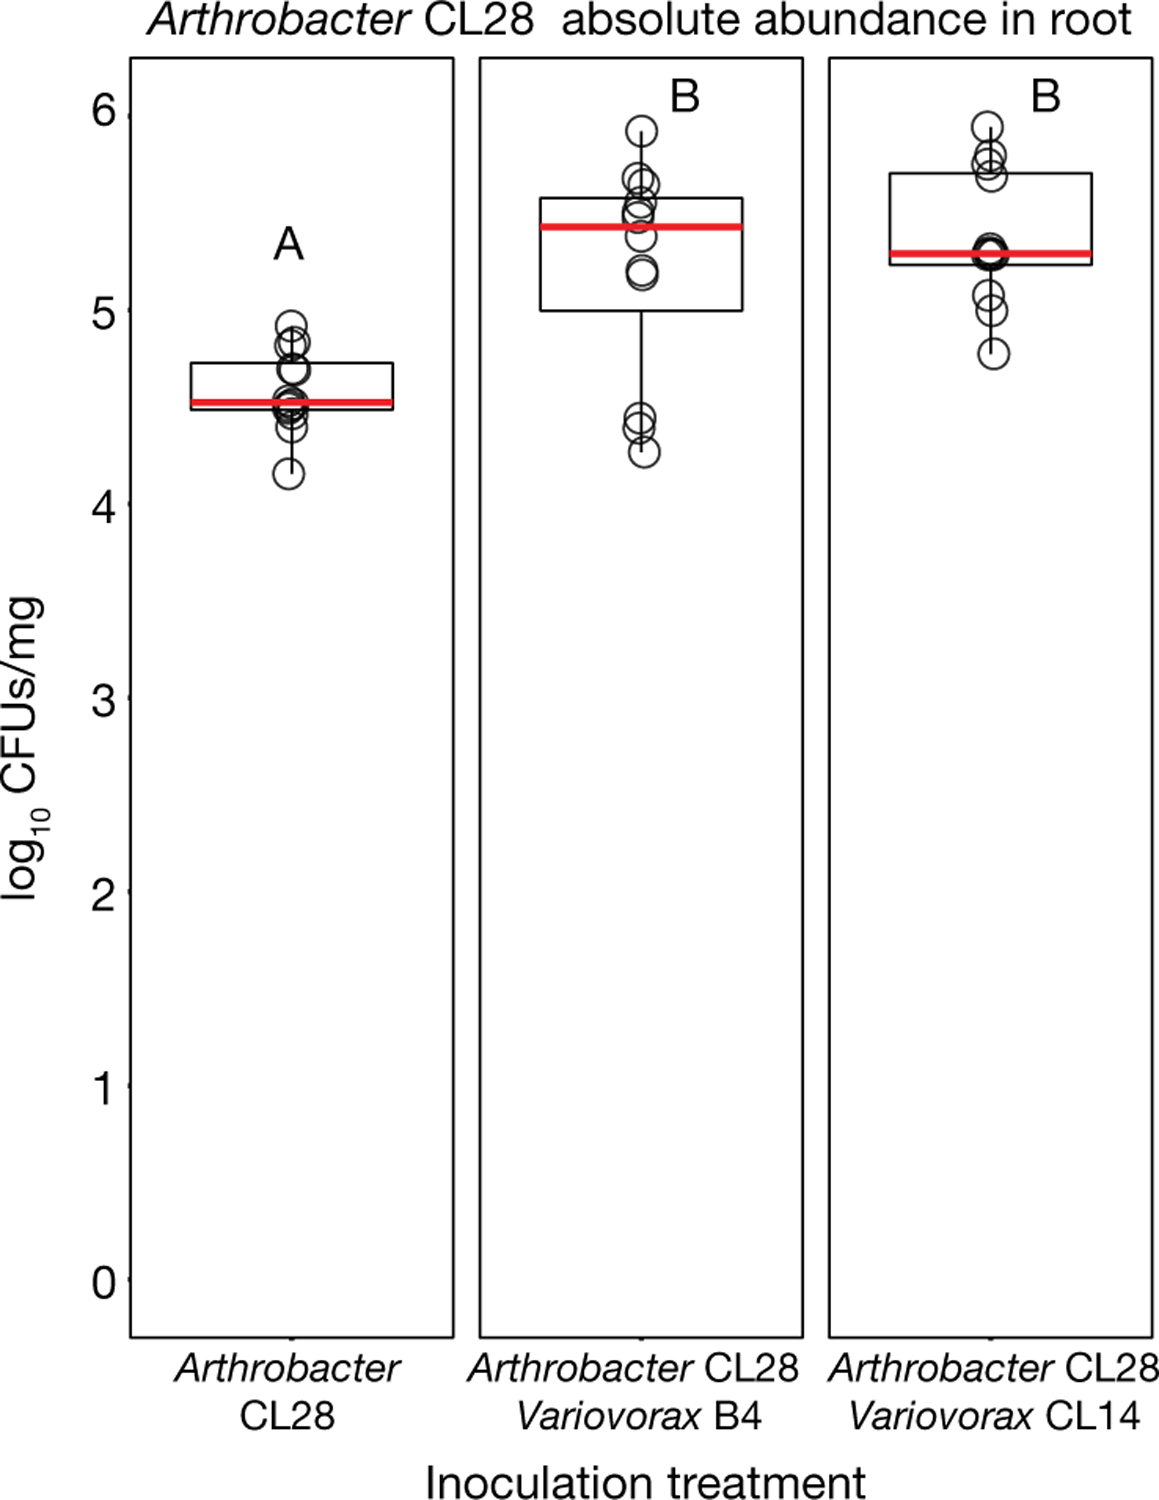
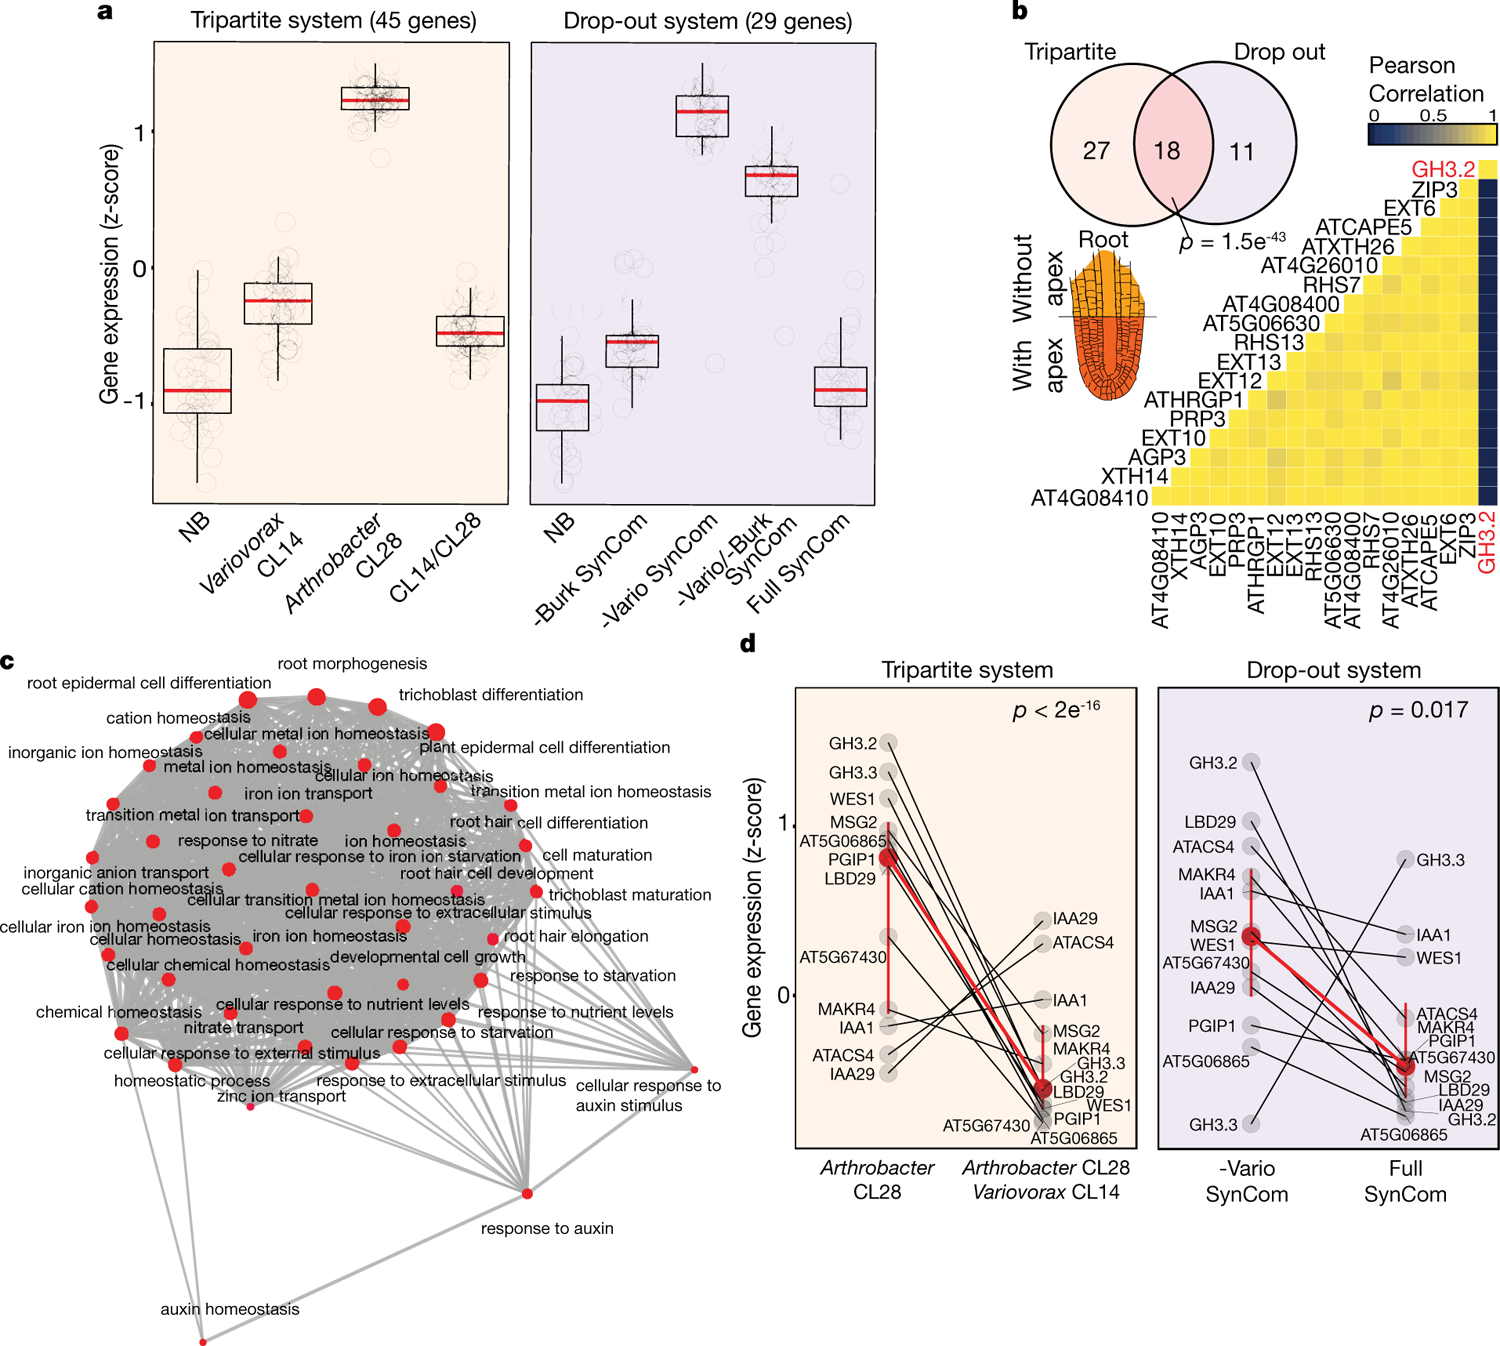
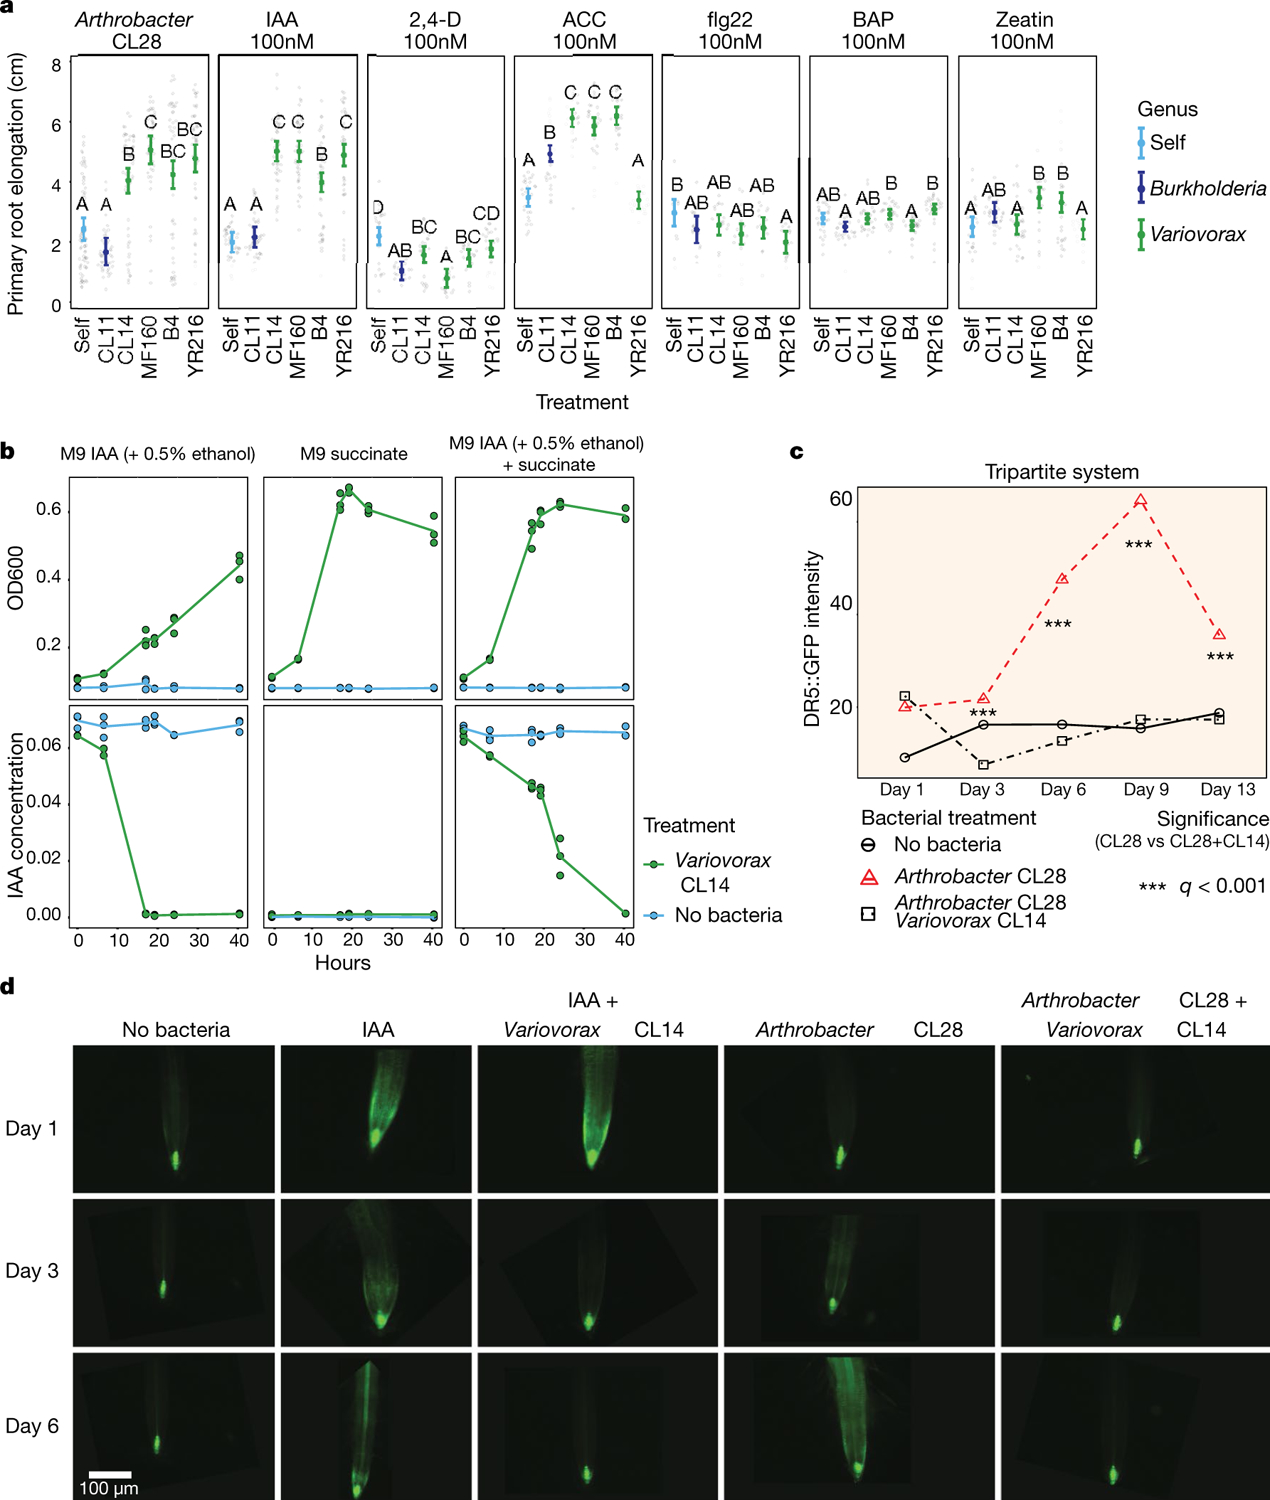
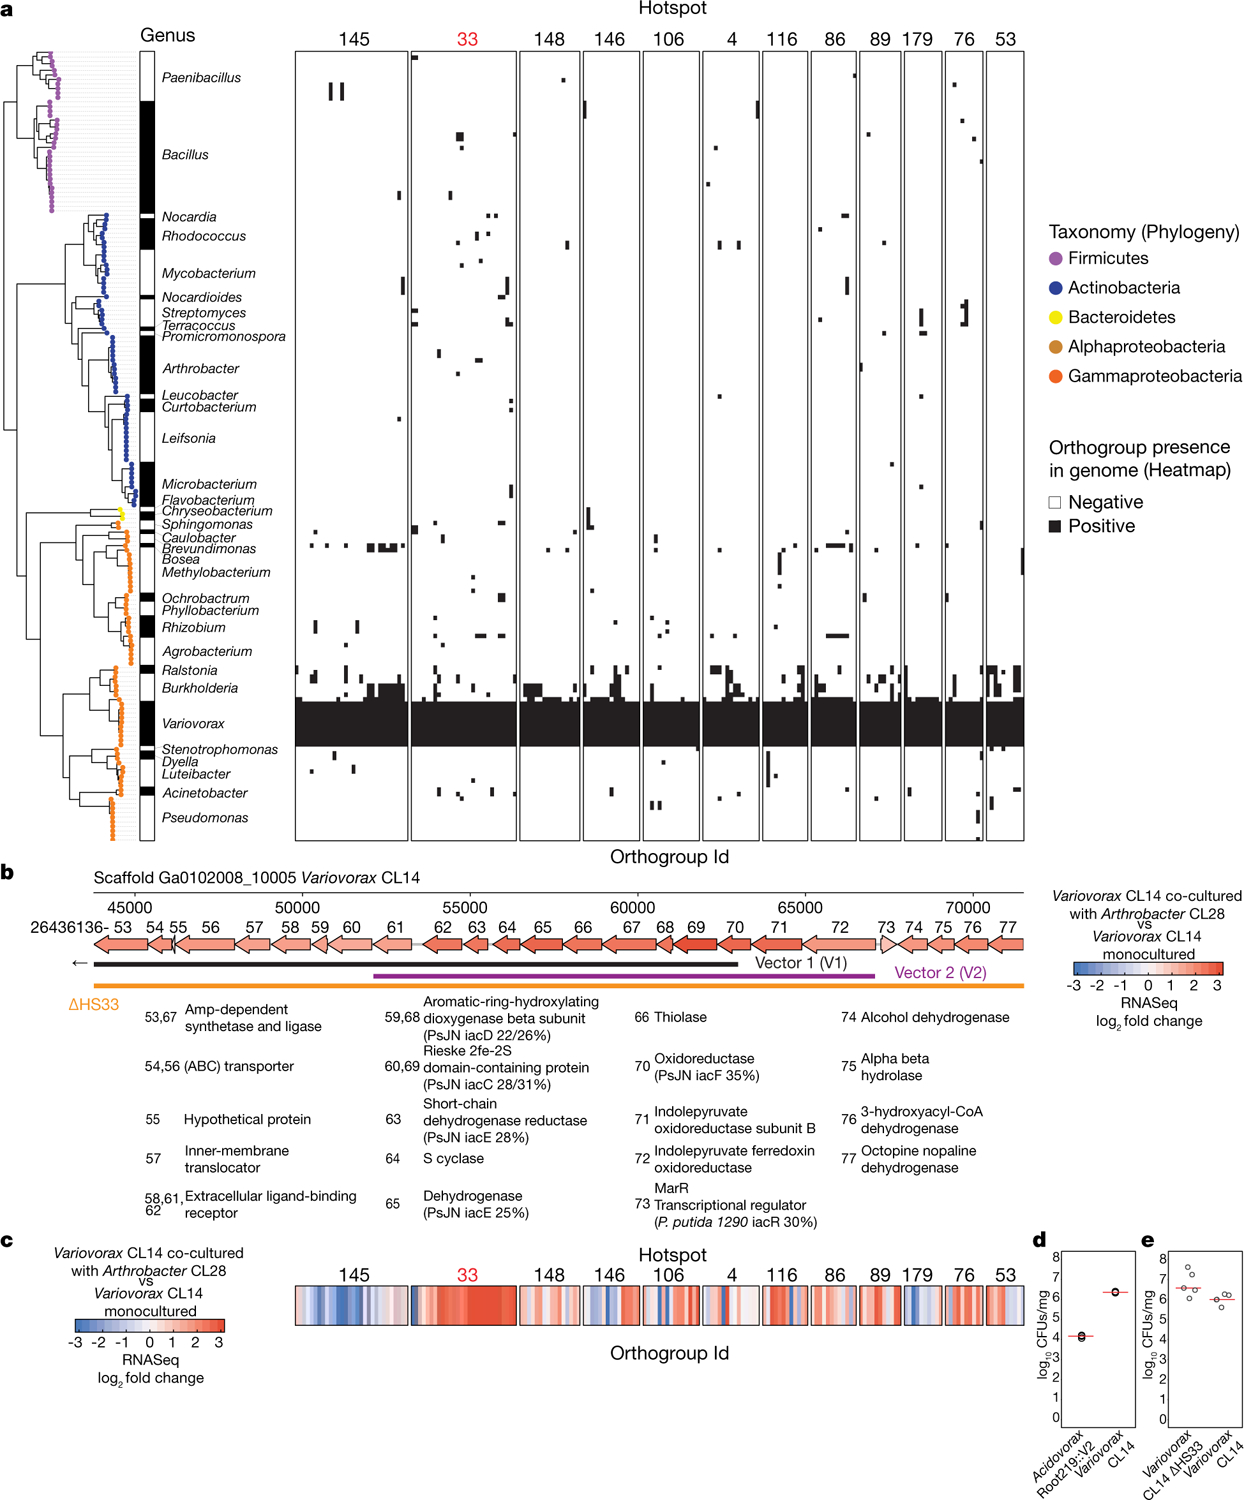
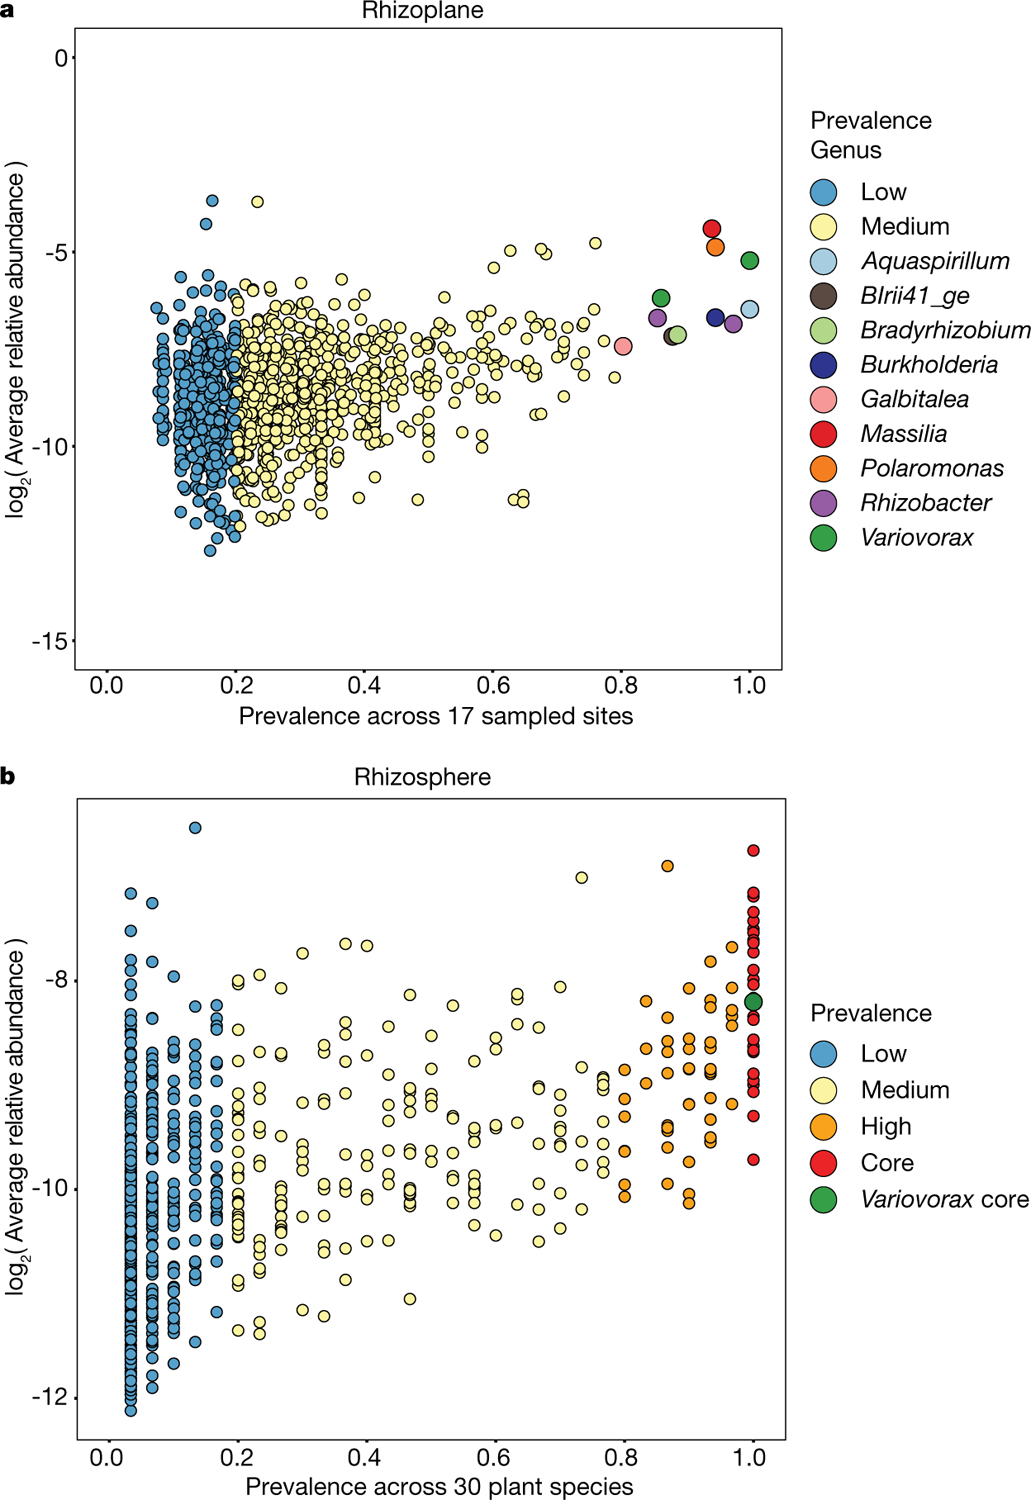
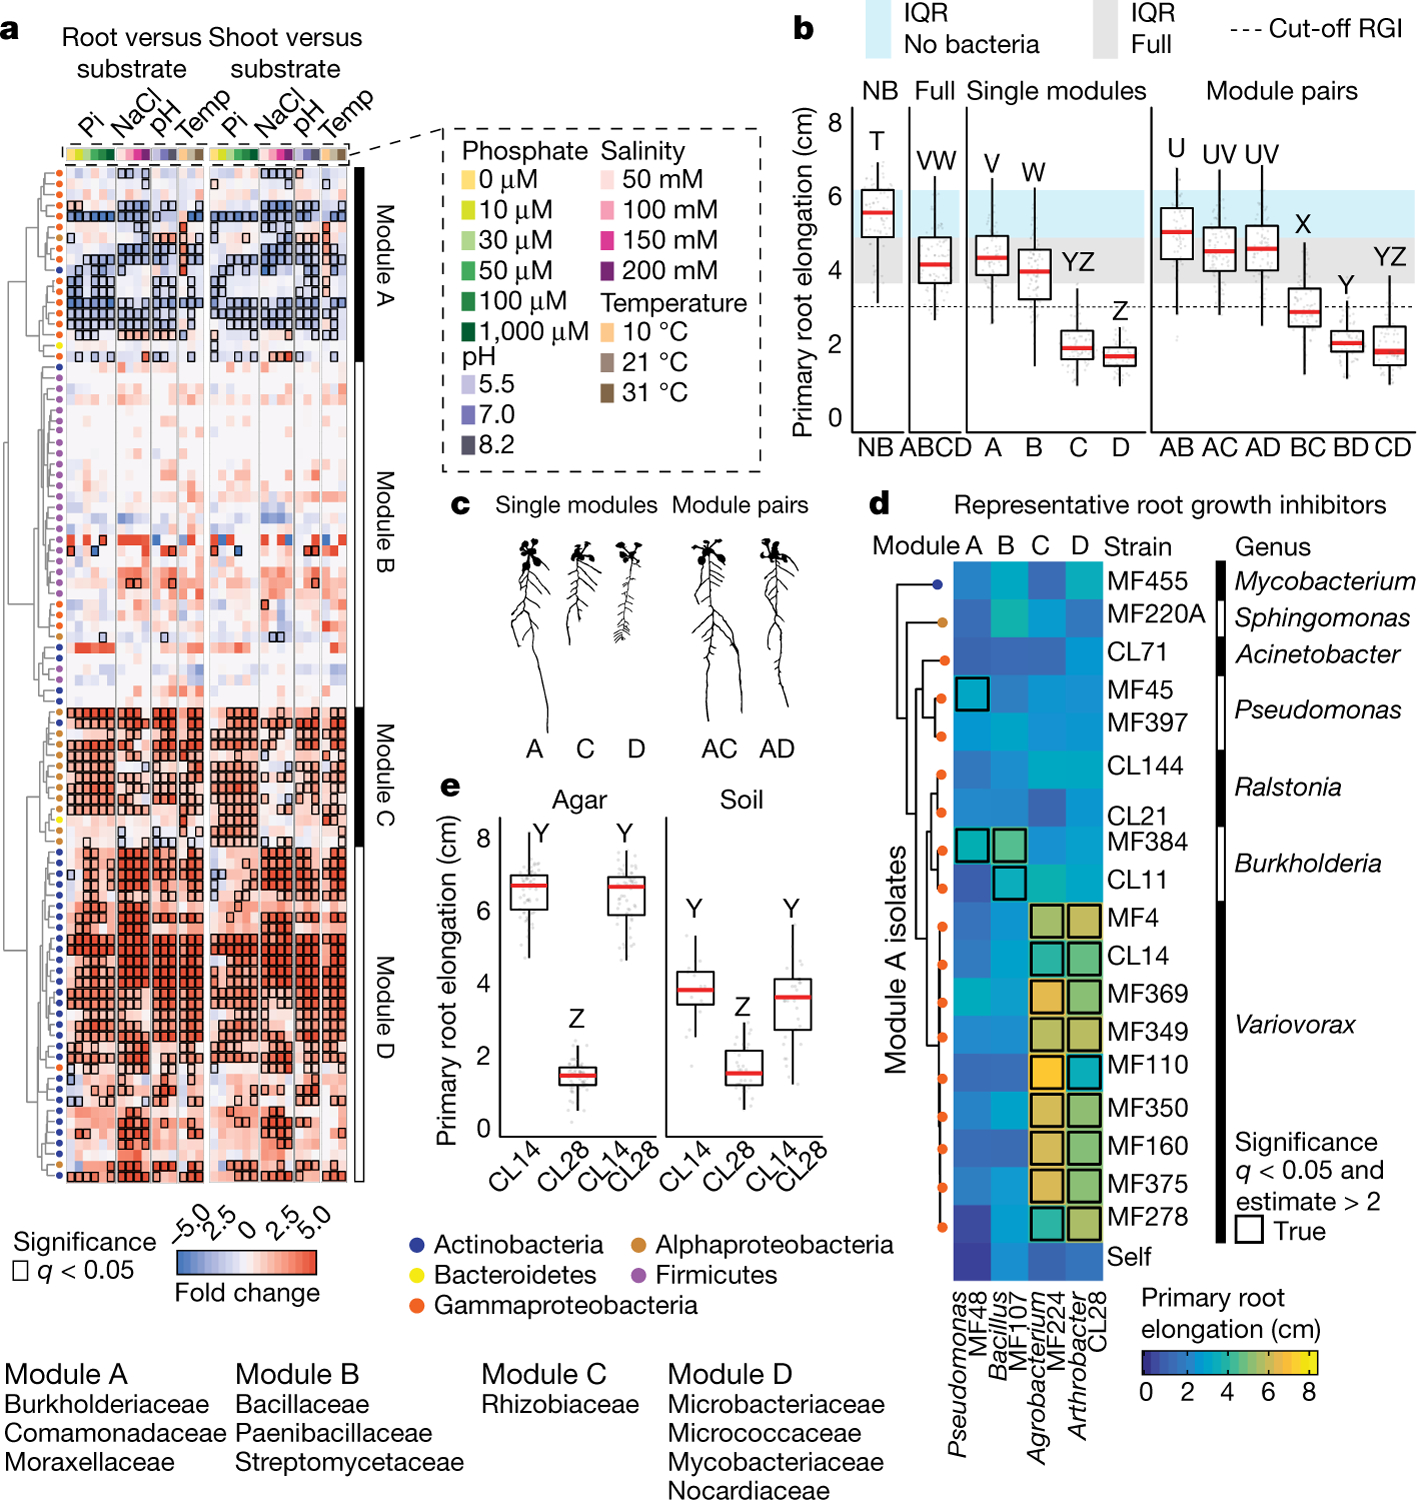
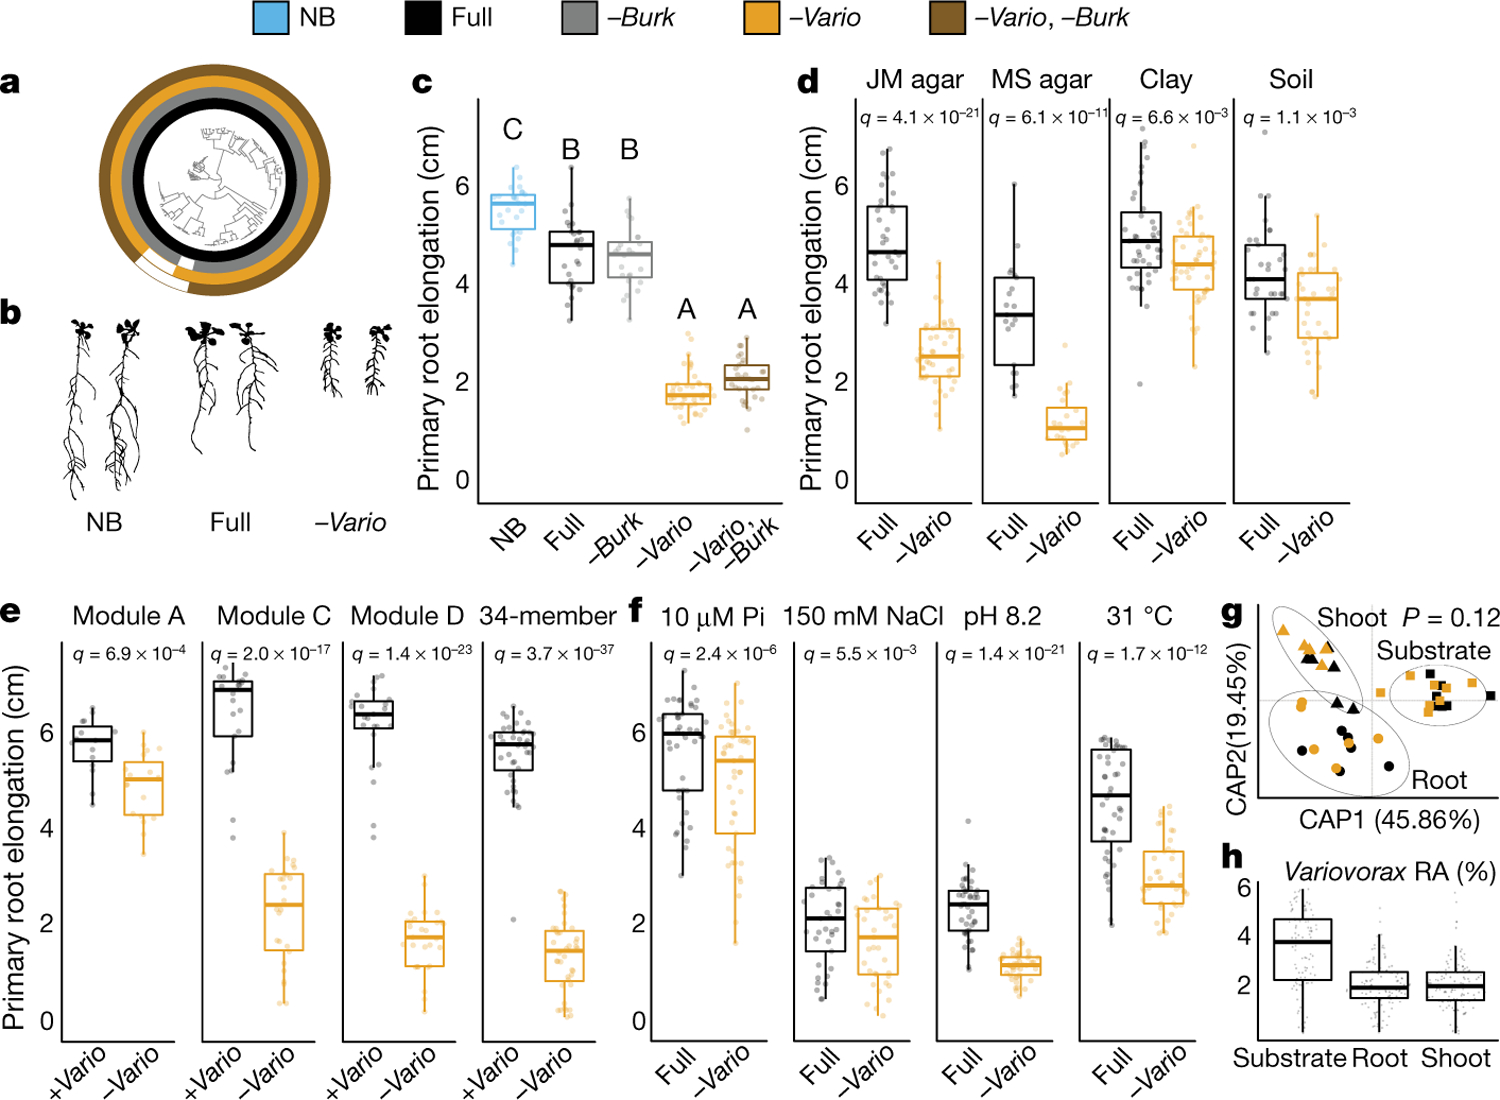
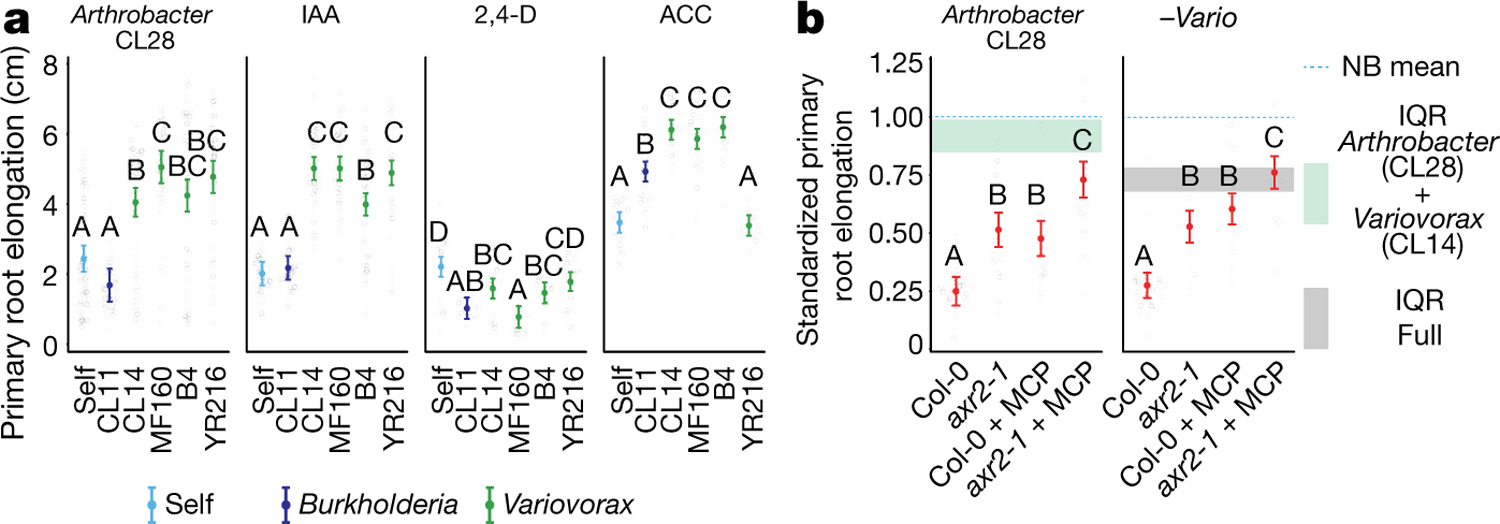
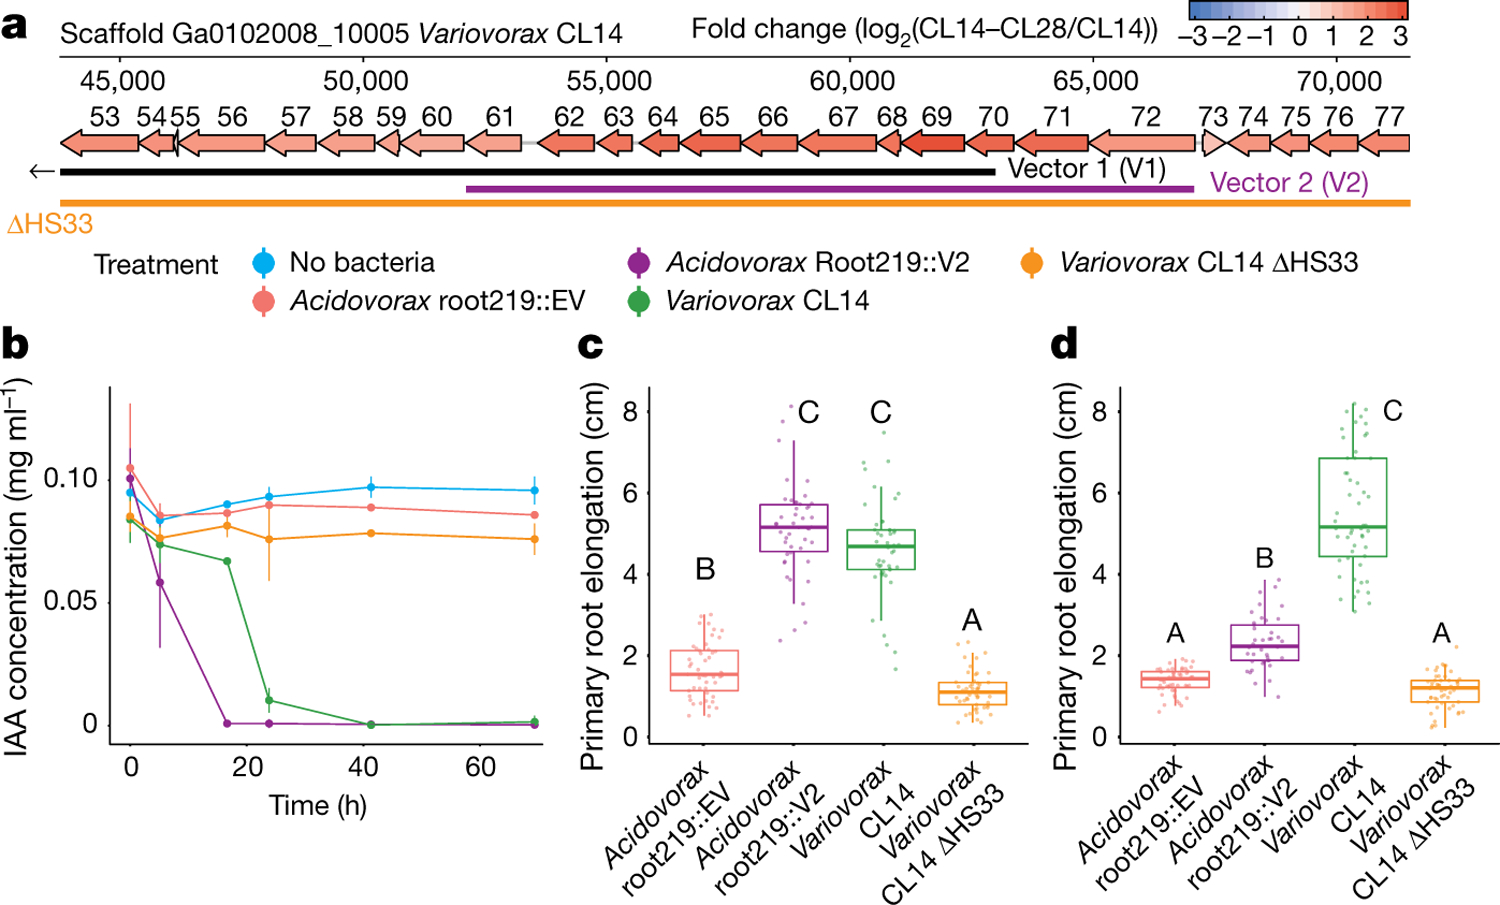
Plants grow within a complex web of species that interact with each other and with the plant1-10. These interactions are governed by a wide repertoire of chemical signals, and the resulting chemical landscape of the rhizosphere can strongly affect root health and development7-9,11-18. Here, to understand how interactions between microorganisms influence root growth in Arabidopsis, we established a model system for interactions between plants, microorganisms and the environment. We inoculated seedlings with a 185-member bacterial synthetic community, manipulated the abiotic environment and measured bacterial colonization of the plant. This enabled us to classify the synthetic community into four modules of co-occurring strains. We deconstructed the synthetic community on the basis of these modules, and identified interactions between microorganisms that determine root phenotype. These interactions primarily involve a single bacterial genus (Variovorax), which completely reverses the severe inhibition of root growth that is induced by a wide diversity of bacterial strains as well as by the entire 185-member community. We demonstrate that Variovorax manipulates plant hormone levels to balance the effects of our ecologically realistic synthetic root community on root growth. We identify an auxin-degradation operon that is conserved in all available genomes of Variovorax and is necessary and sufficient for the reversion of root growth inhibition. Therefore, metabolic signal interference shapes bacteria-plant communication networks and is essential for maintaining the stereotypic developmental programme of the root. Optimizing the feedbacks that shape chemical interaction networks in the rhizosphere provides a promising ecological strategy for developing more resilient and productive crops.


Conflict of interest statement

Competing interests J.L.D. is a co-founder of, and shareholder in, AgBiome LLC, a corporation with the goal of using plant-associated microorganisms to improve plant productivity.

Figures

Extended Data Fig. 1 |
Extended Data Fig. 1 |. Synthetic community resembles the taxonomic make-up of natural communities.
a, Phylogenetic tree of 185 genome-sequenced isolates obtained from surface-sterilized Arabidopsis roots, included in the synthetic community. The composition of this synthetic community captures the diversity of Actinobacteria, Proteobacteria and Bacteroidetes; the three major root-enriched phyla,–,; and Firmicutes, which are abundant in plant-associated culture collections. Tree tips are coloured according to phylum. The outer ring shows the distribution of the 12 bacterial orders present in the synthetic community. b, Comparison of proportions of Proteobacteria, Bacteroidetes and Actinobacteria in synthetic-community (SynCom)-inoculated roots to root microbiota derived from plants grown in natural soil. Firmicutes, which are not plant-enriched, were reduced to <0.1% of the relative abundance (Fig. 1a). The left panel (wild soil) shows the proportion of ASVs enriched (q value < 0.1) in the plant root in comparison to soil in a microbiota profiling study from the same soil from which the synthetic community strains were isolated. ASVs are coloured according to phylum and proteobacterial ASVs are coloured by class. The right panel (synthetic community) represents the relative abundance profiles of bacterial isolates across the initial inoculum, planted agar, and root and shoot in plants inoculated with the full synthetic community. c, Comparison of synthetic community composition in agar versus the soil-based microcosms. Left, relative abundance in the substrate. Middle, relative abundance in root. Right, enrichment in root versus substrate. Each dot represents a single unique sequence. Pearson correlation line, 95% confidence intervals, r value and P value are shown for each comparison. n = 24 (soil system) and 8 (agar system) biological replicates. d, Canonical analysis of principal coordinates (CAP) showing the influence of the fraction (planted agar, root or shoot) on the assembly of the bacterial synthetic community across the four gradients used in this Article (phosphate, salinity, pH and temperature). Different colours differentiate between the fractions, and different shapes differentiate between experiments. Ellipses denote the 95% confidence interval of each fraction. Fraction (substrate, root or shoot) explains most (22%) of the variance across all abiotic variables. n = 94 (substrate), 90 (root) and 95 (shoot) biological replicates across 8 independent experiments. e, Abiotic conditions displayed reproducible effects on α-diversity. Each panel represents bacterial α-diversity across the different abiotic gradients (phosphate, salinity, pH and temperature) and fractions (substrate, root and shoot) used in this Article. Bacterial α-diversity was estimated using Shannon diversity index. Letters represent the results of the post hoc test of an ANOVA model testing the interaction between fraction and abiotic condition. f, Canonical analysis of principal coordinates scatter plots showing the effect on the composition of the synthetic community of each of the four abiotic gradients (phosphate, salinity, pH and temperature) within the substrate, root and shoot fractions. PERMANOVA R2 values are shown within each plot. e, f, Phosphate, n = 6, 5, 6, 6, 6, 6, 6, 6, 6, 6, 6, 6, 6, 6, 6, 6, 5 and 6; salinity n = 6, 6, 6, 6, 6, 6, 6, 4, 5, 6, 4 and 5; pH, n = 6, 6, 6, 5, 5, 6, 6, 6 and 6; temperature n = 6, 6, 6, 6, 6, 6, 6, 6 and 6. All samples are biologically independent and represent two independent experiments.
Extended Data Fig. 2 |
Extended Data Fig. 2 |. RGI trait is distributed across bacterial phylogeny.
a, b, Primary root elongation of seedlings inoculated with single bacterial isolates (one box plot per isolate). Isolates are coloured by taxonomy. a, Isolates are grouped by module membership. The strips across the panels correspond to the interquartile range (IQR), as noted at the far right. The dotted line represents the cut-off used to classify isolates as root-growth inhibiting (cutoff RGI). b, Isolates are ordered according to the phylogenetic tree on the left, and coloured on the basis of their genome-based taxonomy. The vertical blue stripes across the panel correspond to the IQR of plants grown in sterile conditions. The vertical dotted line represents the 3-cm cut-off used to classify strains as RGI strains. The bar on the right denotes the genus classification of each isolate. c, Binarized image of representative seedlings grown axenically (no bacteria) or with 34 RGI strains individually.
Extended Data Fig. 3 |
Extended Data Fig. 3 |. Variovorax-mediated reversion of RGI.
a, Heat map coloured by average primary root elongation of seedlings inoculated with eighteen RGI-inducing strains (rows) alone (self) or in combination with Burkholderia CL11, Variovorax CL14 or Variovorax MF160 (columns). Statistically significant RGI reversions were determined via ANOVA and are outlined in black. b, Variovorax-mediated reversion of RGI is maintained in a second plant species. Primary root elongation of uninoculated tomato seedlings (no bacteria) or seedlings inoculated with the RGI-inducer Arthrobacter CL28 individually or along with Variovorax CL14 grown on vertical agar plates. Significance was determined via ANOVA while controlling for experiment; letters correspond to a Tukey post hoc test. n = 24, 25 and 23 biological replicates across 2 independent experiments.
Extended Data Fig. 4 |
Extended Data Fig. 4 |. Variovorax maintain stereotypic plant growth.
a, Representative plate images of plants grown with the full 185-member synthetic community (full SynCom) or the Variovorax drop-out community (−Vario SynCom) for 12 d. b, Bar graphs showing the isolate composition of synthetic communities composed by module A, module C, module D and a previously described 34-member synthetic community (34-member). Isolates are ordered according to the phylogenetic tree on the left. The tips of the phylogenetic tree are coloured on the basis of the genome-based taxonomy of each isolate. Presence of an isolate across the different synthetic communities is denoted by a black filled rectangle (labelled ‘inoculated’). c, Total root network quantification of Arabidopsis seedlings grown with the full synthetic community (full), or with the full synthetic community excluding Variovorax (−Vario), across different abiotic conditions: JM agar control, low phosphate (JM agar 10 μM Pi), high salt (JM agar 150 mM NaCl), high pH (JM agar pH 8.2) and high temperature (JM agar 31 °C), as well as half Murashige and Skoog medium (MS agar control). Significance was determined within each condition via ANOVA while controlling for experiment. n = 110, 77, 42, 44, 41, 35, 48, 49, 44, 45, 33 and 26 biological replicates across 2 independent experiments. d, Shoot circumference of plants grown in pots with potting soil with the full synthetic community or with the full synthetic community excluding Variovorax. Significance was determined within each condition via ANOVA while controlling for experiment. n = 30 and 36 biological replicates across 2 independent experiments.
Extended Data Fig. 5 |
Extended Data Fig. 5 |. Reversion of RGI is prevalent across the Variovorax phylogeny.
a, Phylogenetic tree of 69 publically available Variovorax genomes and 2 outgroup isolates, Acidovorax root 219 and Burkholderia CL11. The CL28 RGI reversion bar categorizes (positive, negative or untested) the ability of each isolate in the phylogeny to revert the RGI caused by Arthrobacter CL28. The ACC deaminase bar denotes the presence of the KEGG Orthology (KO) term KO1505 (1-aminocyclopropane-1-carboxylate deaminase) in each of the genomes. The heat map denotes the per cent identity of BLASTp hits in the genomes to the genes from the auxin-degrading iac operon in Paraburkholderia phytophirmans, described by ref.. Synteny is not necessarily conserved, as these BLAST hits may be spread throughout the genomes. b,All tested Variovorax isolates reverted RGI. Phylogenetic tree of 19 Variovorax genomes and 2 outgroup isolates (Acidovorax root 219 and Burkholderia CL11) that were tested for their ability to revert the RGI imposed by Arthrobacter CL28. The blue vertical stripe denotes the IQR of plants treated solely with Arthrobacter CL28. The dotted vertical line denotes the 3-cm cut-off used to classify a treatment as an RGI. Each box plot is coloured according to the genus classification of each isolate. Significance was determined via ANOVA while controlling for experiment, letters correspond to a Tukey post hoc test. n = 59, 9, 55, 71, 10, 10, 10, 9, 10, 10, 57, 10, 10, 48, 10, 10, 10, 9, 10, 10 and 9 biological replicates across 2 independent experiments.
Extended Data Fig. 6 |
Extended Data Fig. 6 |. Variovorax does not compete with or antagonize RGI strains.
To test whether Variovorax attenuates RGI by inhibiting the growth of RGI-inducing strains, we compared the bacterial relative abundance profiles in seedlings colonized with the full synthetic community to that of seedlings colonized with the Variovorax drop-out community. We found no changes in the abundances of RGI-inducing strains in response to the Variovorax drop-out (Fig. 2g). In addition, we measured in planta absolute abundance of Arthrobacter CL28 when inoculated alone or with two Variovorax representatives: Variovorax B4 and Variovorax CL14. Here we show log-transformed CFUs of Arthrobacter CL28 normalized to root weight. To selectively count Arthrobacter CL28, CFUs were counted on Luria Bertani (LB) agar plates containing 50 μg ml−1 of apramycin, on which neither Variovorax B4 nor Variovorax CL14 grow. Arthrobacter CL28 CFUs are not reduced in the presence of Variovorax. Notably, Variovorax account for only about 1.5% of the root community (Fig. 2h). These results rule out the possibility that Variovorax enforces stereotypic root growth by antagonizing or outcompeting RGI inducers. Significance was determined via ANOVA, letters correspond to a Tukey post hoc test. n = 12 biologically independent samples.
Extended Data Fig. 7 |
Extended Data Fig. 7 |. Auxin-responsive genes are induced in response to RGI strains.
a, Box plots showing the average standardized expression of genes significantly induced only under RGI conditions (RGI-induced), across the following treatments. Left (tripartite system), uninoculated seedlings (NB) or seedlings inoculated with Variovorax CL14, Arthrobacter CL28 or both Arthrobacter CL28 and Variovorax CL14 (CL14/CL28). Right (drop-out system), uninoculated seedlings (NB), Burkholderia drop-out synthetic community (−Burk SynCom), Variovorax drop-out synthetic community (−Vario SynCom), Variovorax and Burkholdria drop-out synthetic community (−Vario −Burk SynCom) or the full synthetic community (full SynCom). RGI-induced genes are defined as genes that are significantly overexpressed in RGI treatments. Left, genes overexpressed in Arthrobacter CL28-inoculated seedling versus NB and in Arthrobacter CL28-inoculated seedlings versus CL14/CL28. Right, genes overexpressed in −Vario versus NB and in −Vario versus full. n = 3 (left); 5 (right). b, Venn diagram showing the overlap of enriched genes between the tripartite and drop-out systems. The heat map shows the pairwise correlation in expression of these 18 genes across tissues on the basis of the Klepikova Atlas. Seventeen of the 18 genes show high correlation across the atlas, with the exception of the auxin-conjugating gene GH3.2. A root apex diagram from the Arabidopsis eFP Browser (http://bar.utoronto.ca/efp/cgi-bin/efpWeb.cgi) is shown, illustrating the spatial distribution of transcripts from the 17 highly correlated root apex-associated genes in the Klepikova Atlas. Significance of the overlap of enriched genes was determined via hypergeometric test. c, RGI-related genes share gene ontologies. Network of statistically significant gene ontology terms contained within the 18 overlapping RGI-induced genes (a, b). The network was computed using the emapplot function from the package clusterProfiler in R. A P value for terms across the gene ontology was computed using a hypergeometric test (only significant ontologies are shown). Point size (gene ontology term) denotes the number of genes mapped to that particular term. d, Standardized expression of 12 late-responsive auxin genes across the tripartite and drop-out systems. Each dot represents a gene. Identical genes are connected between bacterial treatments with a black line. Mean expression (95% confidence intervals) of the aggregated 12 genes in each treatment is highlighted in red and connected between bacterial treatments with a red line. Significance was calculated using a resampling approach, in which we compared the calculated difference between means across groups. After 10,000 resamplings, we calculated the P value by comparing the distribution of means calculated against the real observed differences between means.
Extended Data Fig. 8 |
Extended Data Fig. 8 |. Variovorax degrades auxin and quenches auxin perception by the plant.
a, Primary root elongation of seedlings grown with six hormonal or microbial-associated molecular pattern RGI treatments (panels) individually (self) or with either Burkholderia CL11 or each of four Variovorax isolates (CL14, MF160, B4 and YR216). Significance was determined via ANOVA within each panel; letters correspond to a Tukey post hoc test. n = 74, 46, 61, 48, 49, 49, 45, 44, 46, 43, 49, 40, 22, 19, 22, 19, 20, 25, 28, 30, 29, 29, 29, 29, 12, 12, 21, 20, 19, 18, 26, 30, 30, 29, 30, 30, 29, 30, 30, 26, 29 and 28 biological replicates across 2 independent experiments. b, Variovorax degrades auxin. Growth curves showing optical density at OD600 (top) and IAA concentrations (mg ml−1) (bottom) in Variovorax CL14 cultures grown in M9 medium with different carbon sources. Left, IAA (+ 0.5% ethanol as solvent); middle, succinate; right, succinate and IAA (+ 0.5% ethanol as solvent). c, Variovorax quenches induction of the auxin bioreporter DR5::GFP. Quantification of GFP intensity in DR5::GFP Arabidopsis seedlings grown with no bacteria, Arthrobacter CL28 and Arthrobacter CL28 + Variovorax CL14. GFP fluorescence was imaged 1, 3, 6, 9 and 13 d after inoculation, and quantified in the root elongation zone. Significance was determined via ANOVA within each time point, while controlling for experiment, and denoted with asterisks. n = 20 biological replicates across 2 independent experiments. d, Representative primary root images of DR5::GFP plants quantified in c, showing roots from 1, 3 and 6 d after inoculation. In addition to the bacterial treatments shown in c, an exogenous IAA control is shown (IAA, second column), as well as IAA-treated plants inoculated with Variovorax CL14, illustrating that IAA-induced fluorescence is quenched in the presence of Variovorax CL14 within 3 d.
Extended Data Fig. 9 |
Extended Data Fig. 9 |. Detection of CL28-responsive Variovorax-unique operons.
a, Presence–absence matrix denoting the distribution of 12 Variovorax-unique hotspots containing at least 10 genes across the 185 members of the synthetic community. Hotspots are defined using the Variovorax CL14 genome as a reference. Phylogeny of the 185 members of the synthetic community is shown to the left of the matrix. We determined the presence of an orthogroup based on a hidden Markov model profile scanning of each core Variovorax (genus) orthogroup across the 185 genomes in the synthetic community. b, A map of the auxin-degrading hotspot 33. Genes are annotated with the last two digits of their IMG gene identifier (26436136XX) and their functional assignments are shown below the map, including per cent identity of any to genes from a known auxin degradation locus. Genes are coloured by the log2-transformed fold change in their transcript abundance in Variovorax CL14 cocultured with Arthrobacter CL28 versus Variovorax CL14 monoculture, as measured by RNA-seq (shown in c). The overlap of this region with vectors 1 and 2 and the region knocked out in Variovorax CL14 ΔHS33 are shown below the map. Vector 1 extends beyond this region. c, Results of RNA-seq on Variovorax CL14 transcripts. Variovorax CL14 was cocultured with Arthrobacter CL28 versus Variovorax CL14 monoculture. Only Variovorax- unique genomic hotspots are presented, aligned with the genes in a. Genes are coloured by the log2-transformed fold change in their transcript abundance in Variovorax CL14 cocultured with Arthrobacter CL28 vs Variovorax CL14 monoculture. Note uniform upregulation of genes in cluster 33. d, log-transformed CFUs of Variovorax CL14 or with the Acidovorax gain-of-function strain Acidovorax root219::V2 normalized to root weight. Each of these two strains was co-inoculated with Arthrobacter CL28 onto 7-d-old seedlings and collected after 12 d of growth. CFU counts were determined on LB plates containing 100 μg ml−1 ampicillin, for which Arthrobacter CL28 is susceptible and Variovorax CL14 and Acidovorax root219::V2 are naturally resistant. n = 3 biologically independent samples. Significance was determined using a two-sided Student’s t-test. P = 2.57 × 10⁻⁵. Line represents median. e, log-transformed CFUs of Variovorax CL14 or of the loss-of-function strain Variovorax CL14 ΔHS33 normalized to root weight. Each of these two strains was inoculated individually onto 7-d-old seedlings and collected after 12 d of growth. CFU counts were determined on LB plates. n = 5 biologically independent samples. Significance was determined using a two-sided Student’s t-test. P = 0.049 (mutant is slightly higher). Red lines represent median.
Extended Data Fig. 10 |
Extended Data Fig. 10 |. Variovorax are highly prevalent across naturally occurring Arabidopsis microbiomes and across 30 plant species.
a, Correlation plot of data reanalysed from ref., comparing bacterial ASV prevalence to log-transformed relative abundance in A. thaliana rhizoplane samples taken across 3 years in 17 sites in Europe. b, Correlation plot of data reanalysed from ref., comparing bacterial ASV prevalence to log-transformed relative abundance across 30 phylogenetically diverse plant species grown in a common garden experiment.
Fig. 1 |
Fig. 1 |. Arabidopsis root length is governed by bacteria–bacteria interactions within a community.
a, Fraction enrichment patterns of the synthetic community across abiotic gradients. Each row represents a unique sequence. The four modules of co-occurring strains (A, B, C and D) are represented. Dendrogram tips are coloured by taxonomy. Heat maps are coloured by log2-transformed fold changes derived from a fitted generalized linear model and represent enrichments in plant tissue (root or shoot) compared with substrate. Comparisons with false-discovery-rate (FDR)-corrected q-value < 0.05 are contoured in black. Enriched families within each module are listed below the heat map. n = 6 biological replicates across 2 independent experiments. Pi, inorganic phosphate; temp, temperature. b, Primary root elongation of seedlings grown axenically (no bacteria, NB), with the full synthetic community (ABCD) or its subsets: modules A, B, C and D alone (single modules), and all pairwise combination of modules (module pairs). Significance was determined via analysis of variance (ANOVA); letters correspond to a Tukey post hoc test. n = 75, 89, 68, 94, 87, 77, 76, 96, 82, 84, 89 and 77 (from left to right) biological replicates across 2 independent experiments. c, Binarized image of representative seedlings inoculated with modules A, C and D, and with module combinations A–C and A–D. d, Heat map coloured by average primary root elongation of seedlings inoculated with four representative RGI-inducing strains from each module (columns A–D) in combination with isolates from module A (rows) or alone (self). Significance was determined via ANOVA. e, Primary root elongation of seedlings inoculated with Arthrobacter CL28 and Variovorax CL14 individually or jointly across two substrates. Significance was determined via ANOVA, letters are the results of a Tukey post hoc test. n = 64, 64, 63, 17, 36 and 33 (from left to right) biological replicates across 2 independent experiments. In all box plots, the centre line represents the median, box edges show the 25th and 75th percentiles, and whiskers extend to 1.5× the interquartile range (IQR).
Fig. 2 |
Fig. 2 |. Variovorax maintains stereotypic root development.
a, Phylogenetic tree of 185 bacterial isolates. Concentric rings represent isolate composition of each synthetic community treatment. NB, uninoculated (no bacteria); full, full synthetic community; −Burk, Burkholderia drop-out; −Vario, Variovorax drop-out; −Vario, −Burk, Burkholderia and Variovorax drop-out. b, Binarized image of representative seedlings inoculated or not with the full synthetic community or the Variovorax drop-out synthetic community. c, Primary root elongation of seedlings grown axenically (NB) or inoculated with the different synthetic community treatments outlined in a. Significance was determined via ANOVA, letters correspond to a Tukey post hoc test. n = 26, 26, 24, 37 and 29 (from left to right) biological replicates. d, Primary root elongation of seedlings inoculated with the full synthetic community or with the Variovorax drop-out synthetic community across different substrates: Johnson medium (JM) agar, Murashige and Skoog (MS) agar, sterilized clay or potting soil. n = 36, 47, 21, 24, 43, 48, 33 and 36 (from left to right) biological replicates across 2 independent experiments. e, Primary root elongation of seedlings inoculated with four subsets of the full synthetic community (module A, C, D or a previously described 35-member synthetic community with its single Variovorax strain removed (34-member)), with (+Vario) or without (−Vario) Variovorax isolates. n = 40, 40, 15, 19, 22, 26, 25 and 29 (from left to right) biological replicates across 2 independent experiments. f, Primary root elongation of seedlings inoculated with the full synthetic community or with the Variovorax drop-out synthetic community across different abiotic stresses: low phosphate, high salt, high pH and high temperature. n = 43, 45, 37, 37, 43, 44, 44 and 43 (from left to right) biological replicates across 2 independent experiments. Significance was determined within each condition via ANOVA in d, f, and with a two-sided t-test in e. FDR-adjusted P values are displayed. g, Canonical analysis of principal coordinates (CAP) scatter plots comparing the compositions of the full synthetic community and Variovorax drop-out synthetic community (colour code as in a) across fractions (substrate (squares), root (circles) and shoot (triangles)). Permutational multivariate ANOVA (PERMANOVA) P value is shown. n = 7 (substrate + full), 8 (substrate + −Vario), 6 (root + full), 6 (root + −Vario), 5 (shoot + full) or 5 (shoot + −Vario). h, Relative abundance (RA) of the Variovorax genus within the full synthetic community across the agar, root and shoot fractions. n = 127, 119 and 127 biological replicates for agar, root and shoot, respectively, across 16 independent experiments.
Fig. 3 |
Fig. 3 |. Variovorax suppression of RGI is related to auxin and ethylene signalling.
a, Primary root elongation of seedlings grown with RGI-inducing Arthrobacter CL28 or three hormonal treatments (100 nM IAA, 2,4-dichlorophenoxyacetic acid (2,4-D) or ACC), individually (self) or with Burkholderia CL11 or one of four Variovorax isolates (CL14, MF160, B4 or YR216). Significance was determined within each treatment via ANOVA; letters correspond to a Tukey post hoc test. n = 74, 46, 61, 48, 49, 49, 45, 44, 46, 43, 49, 40, 22, 19, 22, 19, 20, 25, 28, 30, 29, 29, 29 and 29 (from left to right) biological replicates across 2 independent experiments. b, Primary root elongation, standardized to axenic conditions, of wild-type (Col-0), auxin-unresponsive (axr2-1), ethylene-unresponsive (Col-0 + MCP) or auxin- and ethylene-unresponsive (axr2-1 + MCP) seedlings inoculated with RGI-inducing Arthrobacter CL28 or the Variovorax drop-out synthetic community (−Vario). The blue dotted line marks the relative mean length of uninoculated seedlings. Horizontal shading is the IQR of seedlings grown with Arthrobacter CL28 +Variovorax CL14 (aqua) or the full synthetic community (grey). Significance was determined via ANOVA; letters correspond to a Tukey post hoc test. n = 37, 25, 24, 23, 35, 21, 22 and 20 (from left to right) biological replicates across 2 independent experiments. In a, b, data represent the mean ± 95% confidence interval.
Fig. 4 |
Fig. 4 |. An auxin-degrading operon in Variovorax is required for root development.
a, A map of the auxin-degrading hotspot 33. Genes are annotated with the last two digits of their IMG gene identifier (26436136XX) (Extended Data Fig. 9b), and are coloured by the log2-transformed fold change in their transcript abundance in Variovorax CL14 cocultured with Arthrobacter CL28 (CL14–CL28) relative to Variovorax CL14 (CL14) in monoculture (measured by RNA-seq). Genes contained in vector 1 (V1) and vector 2 (V2), and the region knocked-out in Variovorax CL14 ΔHS33, are shown below the map. b, In vitro degradation of IAA by Acidovorax root219::EV, Acidovorax Root219::V2, Variovorax CL14 and Variovorax CL14 ΔHS33. n = 3 biological replicates. c, d, Primary root elongation of seedlings treated with IAA (c) or co-inoculated with Arthrobacter CL28 combined with Acidovorax root219::EV, Acidovorax root219::V2, Variovorax CL14 and Variovorax CL14 ΔHS33 (d). Significance was determined via ANOVA; letters correspond to a Tukey post hoc test. c, n = 49, 46, 46 and 49 (from left to right); d, n = 51, 41, 52 and 53 (from left to right) biological replicates across 2 independent experiments.

References

    1. Castrillo G et al. Root microbiota drive direct integration of phosphate stress and immunity. Nature 543, 513–518 (2017). - PMC - PubMed
    1. Durán P et al. Microbial interkingdom interactions in roots promote Arabidopsis survival. Cell 175, 973–983.e14 (2018). - PMC - PubMed
    1. Herrera Paredes S et al. Design of synthetic bacterial communities for predictable plant phenotypes. PLoS Biol. 16, e2003962 (2018). - PMC - PubMed
    1. Fitzpatrick CR et al. Assembly and ecological function of the root microbiome across angiosperm plant species. Proc. Natl Acad. Sci. USA 115, E1157–E1165 (2018). - PMC - PubMed
    1. Finkel OM et al. The effects of soil phosphorus content on plant microbiota are driven by the plant phosphate starvation response. PLoS Biol. 17, e3000534 (2019). - PMC - PubMed

Publication types

Supplementary concepts