Comparative Study
. 2020 Oct;586(7828):262-269.
doi: 10.1038/s41586-020-2781-z. Epub 2020 Sep 30.

Innovations present in the primate interneuron repertoire

Affiliations
Comparative Study

Innovations present in the primate interneuron repertoire

Fenna M Krienen et al. Nature. 2020 Oct.

Erratum in

  • Author Correction: Innovations present in the primate interneuron repertoire.
    Krienen FM, Goldman M, Zhang Q, Del Rosario RCH, Florio M, Machold R, Saunders A, Levandowski K, Zaniewski H, Schuman B, Wu C, Lutservitz A, Mullally CD, Reed N, Bien E, Bortolin L, Fernandez-Otero M, Lin JD, Wysoker A, Nemesh J, Kulp D, Burns M, Tkachev V, Smith R, Walsh CA, Dimidschstein J, Rudy B, Kean LS, Berretta S, Fishell G, Feng G, McCarroll SA. Krienen FM, et al. Nature. 2020 Dec;588(7837):E17. doi: 10.1038/s41586-020-2874-8. Nature. 2020. PMID: 33230336

Abstract

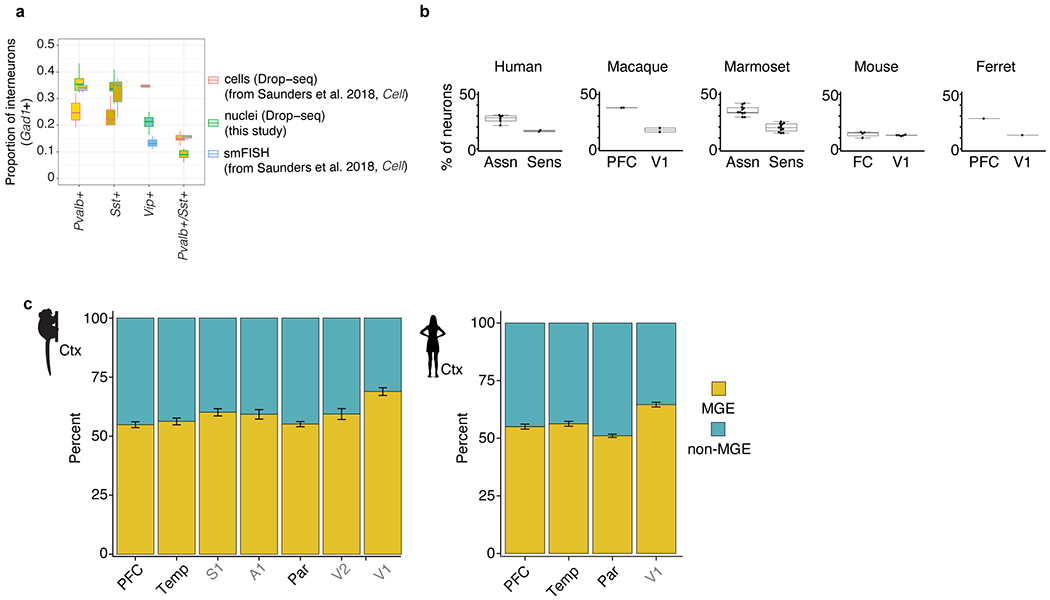
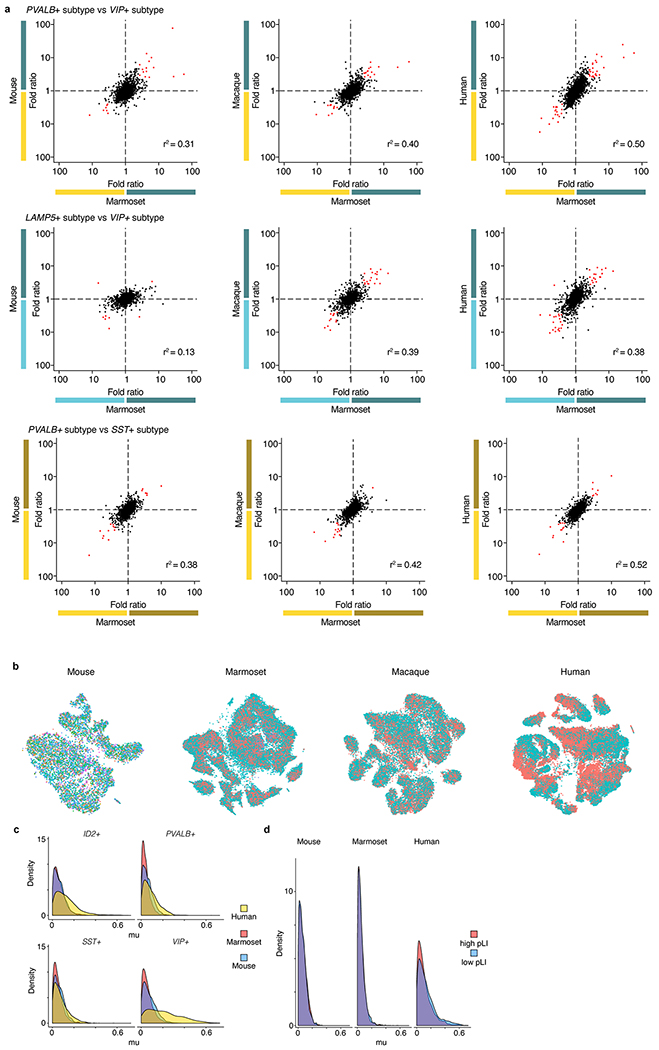
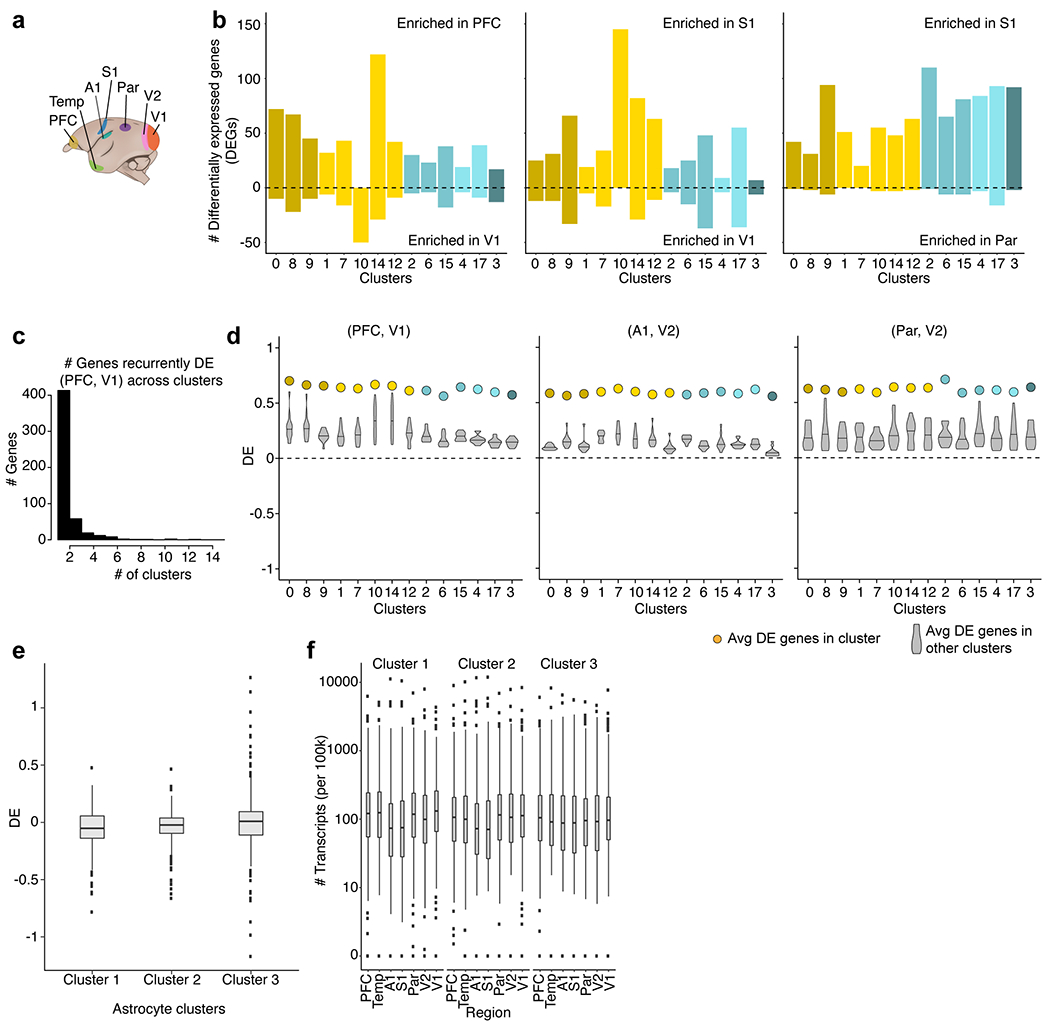
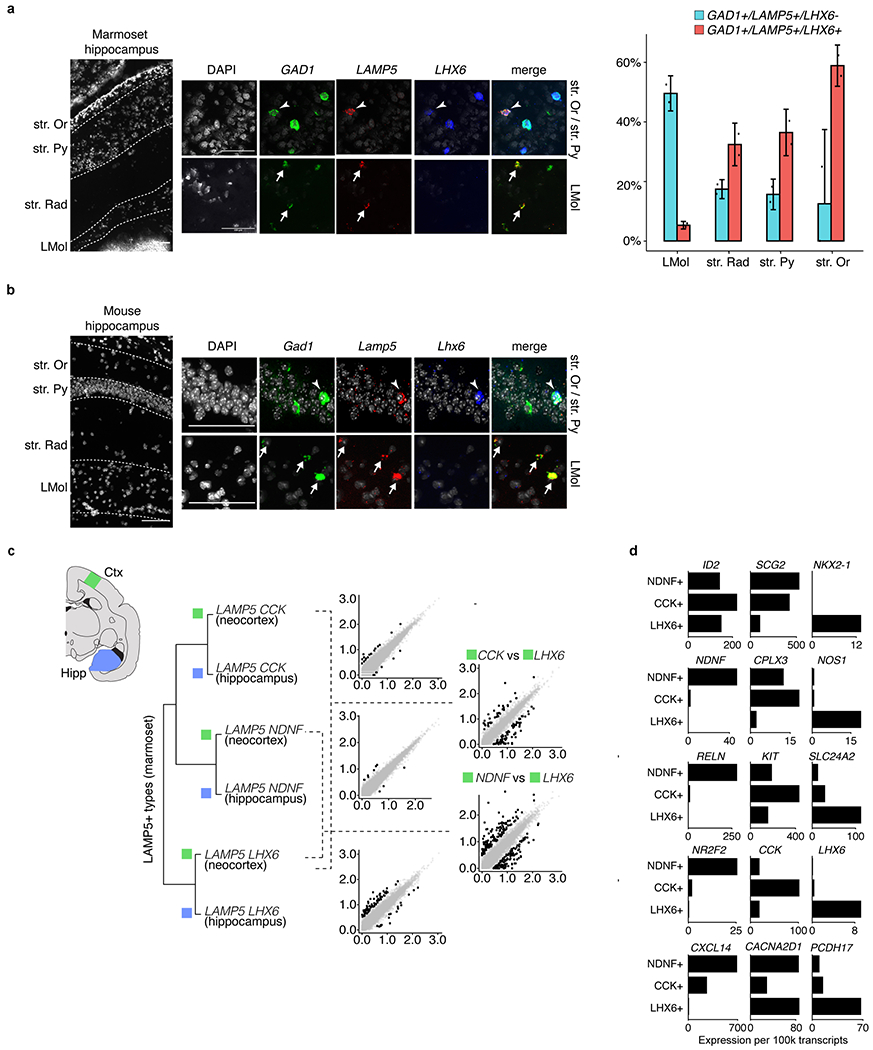
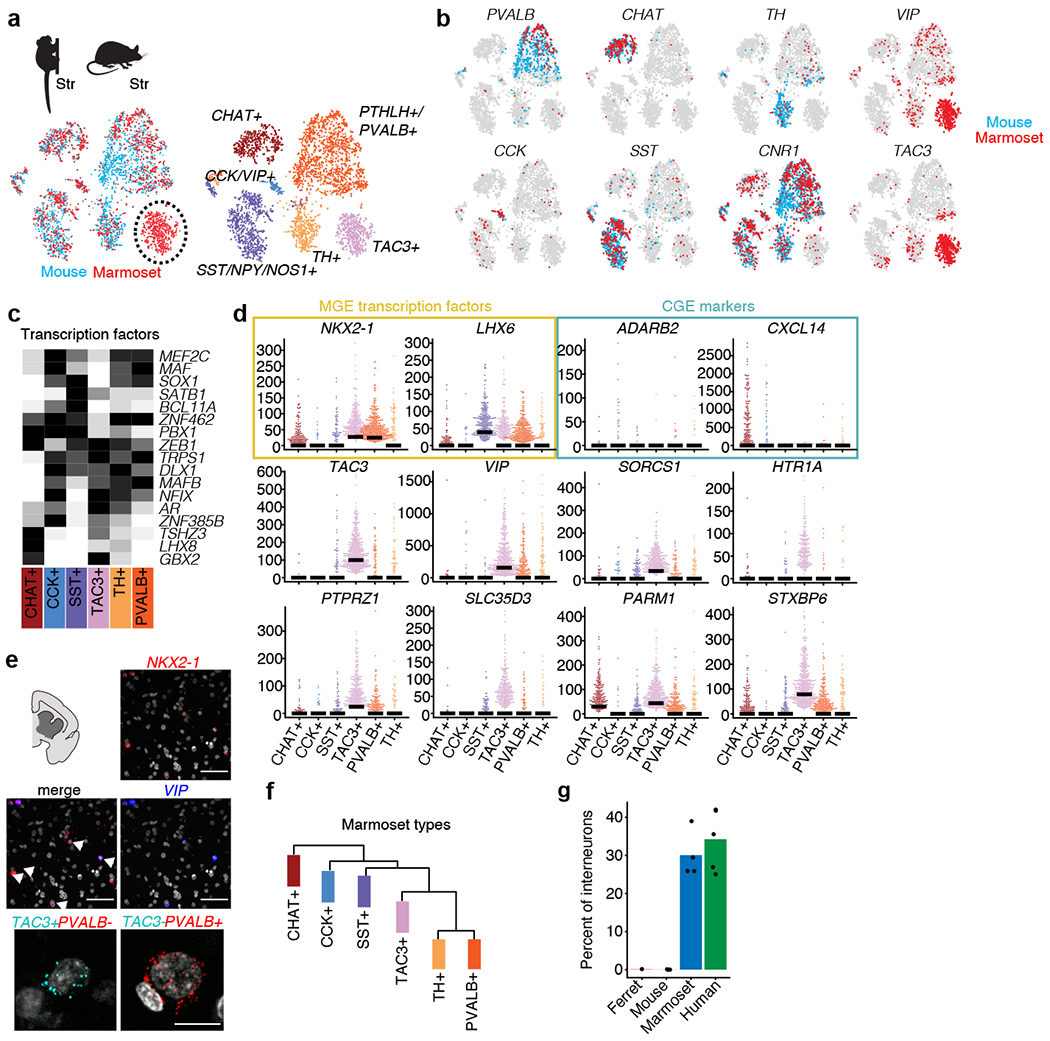
Primates and rodents, which descended from a common ancestor around 90 million years ago1, exhibit profound differences in behaviour and cognitive capacity; the cellular basis for these differences is unknown. Here we use single-nucleus RNA sequencing to profile RNA expression in 188,776 individual interneurons across homologous brain regions from three primates (human, macaque and marmoset), a rodent (mouse) and a weasel (ferret). Homologous interneuron types-which were readily identified by their RNA-expression patterns-varied in abundance and RNA expression among ferrets, mice and primates, but varied less among primates. Only a modest fraction of the genes identified as 'markers' of specific interneuron subtypes in any one species had this property in another species. In the primate neocortex, dozens of genes showed spatial expression gradients among interneurons of the same type, which suggests that regional variation in cortical contexts shapes the RNA expression patterns of adult neocortical interneurons. We found that an interneuron type that was previously associated with the mouse hippocampus-the 'ivy cell', which has neurogliaform characteristics-has become abundant across the neocortex of humans, macaques and marmosets but not mice or ferrets. We also found a notable subcortical innovation: an abundant striatal interneuron type in primates that had no molecularly homologous counterpart in mice or ferrets. These interneurons expressed a unique combination of genes that encode transcription factors, receptors and neuropeptides and constituted around 30% of striatal interneurons in marmosets and humans.


Conflict of interest statement

Competing interests The authors declare no competing interests.

Figures

Extended Data Fig. 1 |
Extended Data Fig. 1 |. Interneuron abundances and gene expression in neocortex.
a, Comparison of measured abundances (expressed as the percentage of all Gad1+ cells) of select interneuron populations across three modalities: single-cell Drop-seq (n = 3,859 cells, n = 7 biological replicates), nucleus Drop-seq (8,622 nuclei, n = 11 biological replicates) and stereological counting of smFISH in mouse cortex (n = 3,891 counted cells, n = 3 biological replicates). Cell Drop-seq and smFISH values were obtained from a previous study. Box plots show median and interquartile range. b, Percentage of interneurons (expressed as a percentage of all neurons) in sensory and association cortex measured with snRNA-seq. Box plots show the median and interquartile range; dots indicate individual brain regions. Ferret, n = 20,285 neurons; mouse, n = 90,159 neurons; marmoset, n = 576,345 neurons; human, n = 303,733 neurons. c, Proportion of MGE and non-MGE interneurons in cortical association regions (PFC, temporal pole and lateral parietal association cortex) and in cortical sensory regions in marmoset (n = 25,946 interneurons across 7 regions from 1 replicate) and human (n = 42,042 interneurons across 4 regions from 2 replicates). Error bars represent binomial confidence intervals.
Extended Data Fig. 2 |
Extended Data Fig. 2 |. Marker gene expression across species.
a, Examples of markers that are consistent, or that vary across species, within the four primary interneuron classes. Values are scaled UMI counts per 100,000 transcripts. b, Triple smFISH characterization of IQGAP2, PVALB and VIP in mouse (n = 1 biological replicate) and marmoset (n = 1 biological replicate) cortex. Arrows indicate double-positive cells (either IQGAP2+ PVALB+ or IQGAP2+ VIP+). Scale bar, 10 μm.
Extended Data Fig. 3 |
Extended Data Fig. 3 |. Comparisons of neocortical interneuron types across and within species.
a, Examples of correlation (Pearson’s r) in fold difference of expressed genes between pairs of MGE-derived and of nonMGE-derived interneuron types across pairs of species. Comparing within and then across species corrects for potential species-specific (for example, sequence-related) influences on RNA sampling, as well as for latent technical variables that might distinguish brains of different species. Genes in red have >3-fold expression difference in either cell type in each species pair, showing that the most extreme DEGs (largely consisting of known ‘markers’ of each type) tended to be consistent between species, despite modest correlations overall. Expression values obtained from n = 10,177 mouse and n = 63,096 marmoset cortical interneurons. b, Cortical interneuron t-SNE plots for each species (same data as Fig. 1c), coloured by individual replicate. c, Measure of inter-individual variability in gene expression (mu) in major interneuron types in mouse, marmoset and human. For each cell type, normalized gene expression levels (averaged across individual cells) are compared between pairs of individuals of the same species. Marmosets and mice both exhibited more modest inter-individual differences than humans did, which probably reflects the effects of life histories, environments and age at sampling, which are more uniform in a laboratory setting. Higher values indicate greater variability. Note that while the mice are isogenic, whole-genome sequencing of the marmosets revealed that they exhibited sequence variation comparable to humans. d, mu scores stratified by pLI gene scores. Human haplo-insufficient (high-pLI) genes tended to have lower expression variability than low-pLI genes in humans but not in marmosets or mice.
Extended Data Fig. 4 |
Extended Data Fig. 4 |. Regional gene expression variation in neocortex.
a, Schematic of neocortical region locations in marmoset. b, Histogram of the number of rDEGs (>3-fold expression difference) between three representative pairs of regions, in each cell type (cluster) for which there were at least 50 cells per region. c, Histogram of the number of interneuron clusters (cell types) in which a given gene is differentially expressed. At a threshold of >3-fold, most genes are only differentially expressed in a single cell type (cluster). d, Average fold difference of regional enrichment across regions and clusters. Coloured dots represent average fold difference of DEGs in each cluster in marmoset interneurons computed from the region pair depicted. Violin plots represent the distribution of average fold differences in each cluster (cell type) when using rDEGs from other clusters. Three representative region pairs are shown (n = 517 rDEGs genes across clusters for PFC and V1; n = 2,271 genes for A1 and V2; n = 1,622 genes for Par and V2). Horizontal bars on violin plots represent the median differential expression score (when using rDEGs from other clusters). rDEGs identified for any one interneuron type (cluster) tended to also exhibit the same regional bias in the other types (clusters). This suggests that most such differences reflect a common regional signature that is shared by diverse interneurons, rather than being specific to particular interneuron types. e, Fold ratios (log10-transformed) between PFC and V1 for three astrocyte subtypes (n = 32,600 nuclei) in marmosets using rDEGs identified in interneurons in the same brain regions. Box plots show interquartile ranges and medians. Dots show outlier genes. f, As in e but for all seven brain regions. Regions are arranged in anterior–posterior order on the x axis. Box plots show interquartile ranges and medians. Dots show outlier genes.
Extended Data Fig. 5 |
Extended Data Fig. 5 |. smFISH validation of graded gene expression in PVALB+ interneurons.
a, Top, sagittal sections of marmoset brain (n = 1 marmoset, at least two tissue sections stained per probe set) stained for PVALB and ASS1 (left) or CRYM (right), two genes that showed quantitatively graded expression in the interneuron snRNA-seq data (see Fig. 2d). Bottom, representative cells from each of the three imaged regions (blue boxes in the top panels). Scale bar, 10 μm. b, Top, spatial distribution of PVALB+ and double-positive interneurons plotted from three imaging windows (blue boxes in a) across the sagittal plane. Bottom, proportion of single-positive (PVALB+ only) and double-positive (PVALB+ASS1+ or PVALB+CRYM+) cells binned along the rostrocaudal axis within imaged regions. c, Mean intensity for each probe within cells identified in b (n = 14,195 double-positive cells in the PVALB+ASS1+ experiments and n = 26,194 double-positive cells in the PVALB+CRYM+ experiments). PVALB itself shows a graded expression (in terms of signal intensity per cell) across the rostrocaudal extent in our snRNA-seq data, with the highest expression (and highest cell numbers) located in the caudal pole (V1). Box plots represent the interquantile range and median values.
Extended Data Fig. 6 |
Extended Data Fig. 6 |. Conserved and divergent gene expression across neocortical types.
a, Liger-integrated marmoset (n = 6,739 interneurons) and mouse (n = 6,852 interneurons) datasets. b, Heat map of exemplar genes that had consistent patterns of expression in Liger-integrated marmoset–mouse clusters from a. Each gene (row) is scaled to the scaled maximum (black) expression (values given outside plots) for each species separately. The coloured top bar codes each cluster as one of the major types (as in Fig. 1). Column labels follow labels in a. c, Heat map of exemplar genes that have divergent expression patterns in Liger-integrated marmoset–mouse clusters from a. Each gene (row) is scaled to the scaled maximum (black) expression (values given outside plots) for each species separately. Exemplar genes include those that are widely used as markers for particular interneuron populations but have divergent gene expression across mice and marmosets, such as CALB1 and CALB2.
Extended Data Fig. 7 |
Extended Data Fig. 7 |. Integration of marmoset and human interneurons.
a, Liger-integrated marmoset (n = 6,739 interneurons; the same data are used in Extended Data Fig. 6) and human (n = 4,164 interneurons). Human data are from the middle temporal gyrus dataset available from a previously published study (SMART-seq v.4). Marmoset data are from temporal lobe interneurons (Drop-seq). b, Heat map of the proportional representation of individual-species clusters (rows) within Liger clusters (columns) labelled as in a. Marmoset clusters were generated from an ICA-based pipeline (see Methods). Human clusters and labels are from a previously publishes study (for example, see figure 5d of the previous study). In both datasets, most clusters contributed predominately to a single Liger cluster, and cells that clustered together in the data for each species (by separate analyses) tended to remain clustered together in the interspecies Liger analysis, suggesting that the integrated analysis preserved the structure present in the individual datasets. Consistent with the finer clustering in the previous study (they obtained 45 human interneuron clusters, whereas our marmoset data resolved to 22 clusters), several human clusters often contributed to a Liger cluster, whereas most marmoset clusters singly contributed to a Liger cluster. For example, Liger cluster 22 corresponds to a single marmoset cluster (cluster 1-11) and two distinct (but related) human clusters (Inh L1-2 PAX6 TNFAIP8L3 and Inh L1-2 PAX6 CDH12).
Extended Data Fig. 8 |
Extended Data Fig. 8 |. Interneuron distributions in cortex and hippocampus.
a, Left, smFISH for GAD1, LAMP5 and LHX6 in marmoset hippocampal layers (CA1/CA2 subfields; n = 2 biological replicates). Arrowhead indicates triple-positive cells; arrow indicates the LHX6 population. Top row, strata oriens (Str. Or) and strata pyramidale (Str. Py). Bottom row, strata lacunosum moleculare (LMol). Scale bars, 100 μm. Right, quantification of GAD1+LAMP5+LHX6+ (red) and GAD1+LAMP5+LHX6 (cyan) cells as a percentage of all GAD1+ cells in marmoset hippocampus (n = 446 GAD1+ cells counted) (compare to previously published mouse data). Data are mean ± s.e.m.; dots represent biological replicates. b, smFISH for Gad1, Lamp5 and Lhx6 in mouse hippocampal layers (CA1; n = 2 biological replicates). c, Scatter plots of relative normalized gene expression (log10-transformed) across pairs of marmoset LAMP5 types in neocortex and hippocampus. Data from Fig. 3d; neocortical (n = 5,114 interneurons) and hippocampal (n = 1,589 interneurons). d, Scaled, normalized expression of select gene markers that distinguish the three main LAMP5+ types in marmoset.
Extended Data Fig. 9 |
Extended Data Fig. 9 |. Analysis of striatal interneurons.
a, Clustering of an additional dataset of 2,718 marmoset striatal interneurons (acquired using 10X 3′ Chromium v.3 chemistry) confirms the existence of the large TAC3+ population and reveals additional diversity within the main striatal interneuron clusters. The marmoset TAC3+ population comprises two subtypes; markers distinguishing between the two included SULF1, ASB18, ANGPT1 and PLCXD3 (note these are also expressed at varying levels in some of the other striatal interneuron types). This dataset also identified additional markers for the TAC3+ population as a whole relative to other striatal interneurons, such as genes that encode the extracellular matrix protein LTBP2, corticotropin-releasing hormone receptor 2 (CRHR2), the transcriptional repressor PRDM8 and α-1D adrenergic receptor (ADRA1D). b, Scatter plots showing gene expression (log10-transformed) between TAC3+ and PVALB+ or SST+ populations in marmoset striatum. Differentially expressed (>3-fold difference) neuropeptides and transcription factors are labelled. c, The analysis in Fig. 4a was repeated, but additionally included all mouse extra-striatal interneurons from a previous study. For display, the t-SNE plot shows marmoset striatal interneurons (red), mouse striatal interneurons (blue) and any extra-striatal mouse interneuron that expressed Vip or Tac2 in the previously published dataset (grey). Circled cells indicate marmoset TAC3+ population. d, Liger integration of mouse and ferret striatal interneurons. Right, mouse interneurons in a mouse-only ICA-based t-SNE, with cells coloured according to their Liger clusters to confirm that clusters identified by Liger correspond meaningfully to clusters produced by a single-species analysis.
Extended Data Fig. 10 |
Extended Data Fig. 10 |. Cross-species patterns of gene expression within striatal interneurons.
a, individual species-based ICA clustering of ferret (10X 3′ v.3, n = 709 interneurons), mouse (Drop-seq, n = 2,166 interneurons), marmoset (10X 3′ v.3, n = 2,707 interneurons) and human (10X 3′ v.3, n = 1,509 interneurons) striatal datasets. Shades of blue are used to represent the diverse populations of ADARB2+ types (non-MGE+ types, including subpopulations of CCK+ types previously identified in mice). b, Scaled expression of marker genes among the four most numerous striatal interneuron types that are conserved in all species examined (SST+, CHAT,+ TH+ and PVALB+ PTHLH+). Bars coloured according to scheme in a. The differential expression of CALB1 across species is one of the most marked examples observed of human-specific expression of a gene in a conserved cell type. c, Gene expression differences in human caudate interneurons between TAC3+ and PVALB+ (left) or TAC3+ and SST+ (right) populations. Neuropeptides (red), transcription factors (purple) and ion channels (yellow) are labelled. d, Data as in c, but instead highlighting genes that were differentially expressed in both marmoset and human (red, with gene symbols) or only in marmoset (blue).
Fig. 1 |
Fig. 1 |. Analysis of cortical interneurons in ferret, mouse, marmoset, macaque and human.
a, Schematic showing possible changes In cellular assemblies across species. b, Experimental workflow, numbers of interneurons sampled in each species, and uniform manifold approximation and projection (UMAP) embedding of datasets. Ctx, neocortex; Hipp, hippocampus; Str, striatum. c, Cortical interneurons in each species. Cells are coloured according to one of four major neocortical types: SSl+, PVALB+, VIP+ or LAMP5+ (dark brown or dark green cells indicate cells that co-express SST and PVALB or LAMP5 and VIP, respectively). n = 2,930 ferret interneurons; n = 10,177 mouse interneurons; n = 63,096 marmoset interneurons; n = 22,305 macaque interneurons; n = 56,648 human interneurons. Coloured dots are plotted over the dots of non-target species (grey). d, Percentage of MGE-derived (SSl+ or PVALB+) and non-MGE-derived (VIP+ or LAMP5+) types across two regions: frontal cortex (mouse) or PFC (other species) and V1 (all species). Error bars represent 95% binomial confidence intervals. e, Examples of genes with similar or distinct cell-type-specific expression patterns across species (Extended Data Fig. 2). Values are scaled expression levels (number of transcripts per 100,000 transcripts) for each of the four main cortical interneuron types. Note that quantitative differences across species summarized across major types could have several underlying causes: for example, selective expression within particular subtypes, versus overall lower expression within a type in a given species. f, Correlation (Pearson’s r) between scaled expression levels for NRG1 in human compared with the other species across major interneuron types. Values were calculated as in e. Dots are coloured as in c. g, Density histograms showing correlation (Pearson’s r) distribution of expressed genes between pairs of species. Red, primate–primate pairs; blue, primate–mouse pairs; yellow, ferret–non-ferret pairs).
Fig. 2 |
Fig. 2 |. Comparing cortical interneurons within regions and across species.
a, Integrated analysis (using Liger) of snRNA-seq data from seven marmoset neocortical regions. t-Distributed stochastic neighbour embedding (t-SNE) plots with cells (n = 63,096) coloured by cortical region of origin (left) or cluster assignment (right). A1, primary auditory cortex; Par, parietal association cortex; S1, primary somatosensory cortex; Temp, temporal association cortex; V2, extrastriate visual area. b, Histogram of the number of rDEGs (more than threefold difference in expression) between marmoset PFC and V1 in each cluster for which at least 50 cells per region were available. c, rDEGs (n = 618 unique genes across all clusters) in marmoset (PFC and V1) tend to share regional differences with other species. Left, percentage of genes expressed in the other species that are consistent with marmoset pattern. The dashed line represents chance. Right, log10-transformed magnitude of differential expression (DE). Dots represent cluster averages from the cluster with the most DEGs in common with each marmoset cluster. Box plots represent median and interquartile range. d, Normalized expression of rDEGs (PFC versus V1) across the seven marmoset neocortical regions sampled. The x axis is arranged by anterior–posterior order of the regions shown in a. The top three DEGs for the PVALB+ cluster outlined in a for each contrast (PFC > V1, V1 > PFC) are shown. Dots are individual replicates within each region. e, Dots show averaged spatial correlations across rDEGs identified in each cluster (n = 618 total genes) when regions (n = 5, excluding PFC and V1) are arranged in anterior–posterior order. Grey box plots show averaged correlations of the same rDEGs in each cluster when permuting region order (n = 120 possible orderings). Box plots represent median and interquartile range.
Fig. 3 |
Fig. 3 |. Cortical LHX6+LAMP5+ interneurons are much more numerous in primates and are molecuiariy similar to conserved hippocampal interneurons.
a, Neocortical cells that express LHX6 and/or LAMP5 from mouse (n = 10,177 interneurons) and marmoset (n = 63,096 interneurons) on UMAP embedding from Fig. 1. Dots from the target species are plotted over all dots from the non-target species. b, Abundances of LHX6+ LAMP5+ cells, expressed as the percentage of GAD1+ interneurons sampled by Drop-seq for each species, by neocortical region. c, Left, smFISH in marmoset neocortex showing an example of an LHX6+LAMP5+GAD1+ cell. Scale bar, 20 μm. Right, quantification by layer of LAMP5+ LHX6 GAD1+ cells (blue) and LAMP5+LHX6+GAD1+ cells (red) in marmoset neocortex (n = 1,796 cells counted across 2 marmosets). Data are mean ± s.e.m.; individual replicates are shown as dots. d, UMAP embedding of Liger integration including marmoset neocortical, hippocampal and striatal interneurons and mouse interneurons across major structures from a previous study (n = 12,399 interneurons in mouse; n = 16,563 in marmoset). LAMP5+ subtypes are labelled. e, Hierarchical clustering of marmoset LAMP5+ subtype expression profiles showing that neocortical (n = 5,114 interneurons) and hippocampal (n = 1,589 interneurons) counterparts are more similar to each other than to the other subtypes within the same tissue. Clusters were produced using an independent component analysis-based approach (Methods) that, in contrast to Liger, does not explicitly attempt to integrate datasets, and is agnostic to which dataset a given cell comes from. f, A single Nkx2.1 lineage gives rise to Lamp5+Lhx6+ cells in the mouse hippocampus and neocortex. Left, Overview of labelled cells (n = 3 mice). Top middle, the hippocampus is abundantly labelled. Bottom middle, labelling is extremely sparse and mostly restricted to layer 6 (L6) of the neocortex. Labelled cells could be found rarely in layers 2 and 3, but not in layer 1. Right, a biocytin-filled mouse ld2;Nkx2.1 interneuron in neocortical layer 6 (n = 2 mice).
Fig. 4 |
Fig. 4 |. A primate striatal interneuron type not observed in mouse or ferret.
a, integrative cross-species alignment (using Liger) of marmoset (n = 2,227 interneurons) and mouse (n = 2,209 interneurons) striatal interneurons. Left, cells coloured by species (red, marmoset; blue, mouse). Right, cells coloured by cluster (cell type). b, Markers for each interneuron cluster plotted for marmoset (red) and mouse (blue). c, Heat map of transcription factors expression in marmoset striatal subtypes. Each gene is scaled to its maximum value across types (black, maximum value; white, minimum value). d, Beeswarm plots showing additional markers distinguishing TAC3+ interneurons from other interneuron types in marmoset, including MGE transcription factors (yellow) and CGE markers (blue). Dots are individual cells; bars indicate median expression. The y axes show the normalized expression of the indicated genes (number of transcripts per 100,000 transcripts). Top and middle, smFISH for VIP and NKX2-1 in marmoset striatum (n = 1 marmoset). Cells that co-express both genes are identified by arrows. Bottom, smFISH for TAC3 and PVALB identifies non-overlapping populations (n = 1 marmoset). Scale bars, 100 μm. f, Hierarchical clustering of marmoset striatal interneurons. g, Percentage of interneurons per species (out of the indicated total neurons; n = 702 ferret striatal interneurons, n = 2,209 mouse striatal interneurons, n = 3,284 marmoset striatal interneurons, n = 4,303 human striatal interneurons) assigned to the TAC3 cluster when integrated (by Liger) with marmoset data. Dots are individual replicates.

Similar articles

Cited by

References

    1. Kumar S, Stecher G, Suleski M & Hedges SB TimeTree: a resource for timelines, timetrees, and divergence times. Mol. Biol. Evol 34, 1812–1819 (2017). - PubMed
    1. Northcutt RG & Kaas JH The emergence and evolution of mammalian neocortex. Trends Neurosci. 18, 373–379 (1995). - PubMed
    1. Laclef C & Métin C Conserved rules in embryonic development of cortical interneurons. Semin. Cell Dev. Biol 76, 86–100 (2018). - PubMed
    1. Katz PS & Harris-Warrick RM The evolution of neuronal circuits underlying species-specific behavior. Curr. Opin. Neurobiol 9, 628–633 (1999). - PubMed
    1. Herculano-Houzel S The remarkable, yet not extraordinary, human brain as a scaled-up primate brain and its associated cost. Proc. Natl Acad. Sci. USA 109, 10661–10668 (2012). - PMC - PubMed

Publication types