

Hydrogen Variability in the Murray Formation, Gale Crater, Mars
- PMID: 32999802
- PMCID: PMC7507757
- DOI: 10.1029/2019JE006289
Hydrogen Variability in the Murray Formation, Gale Crater, Mars
Abstract
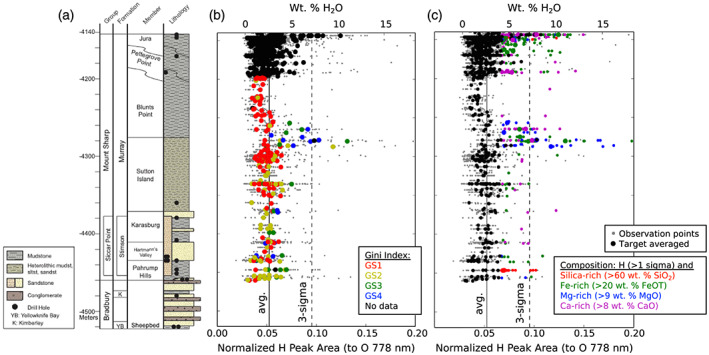
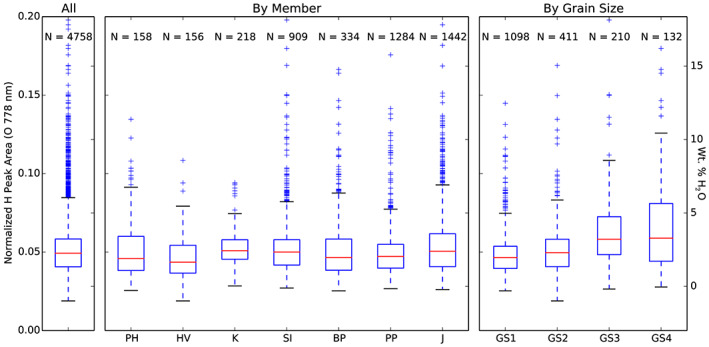
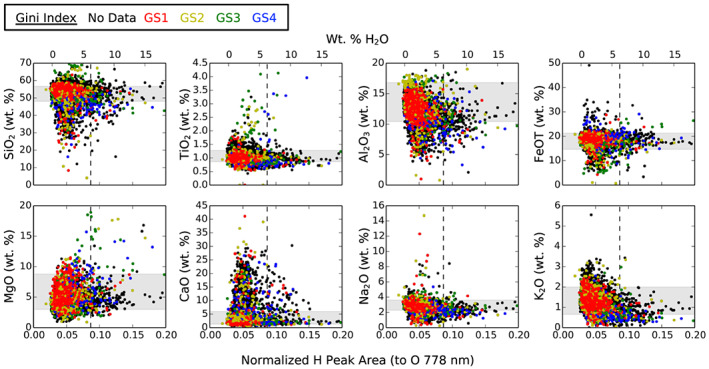
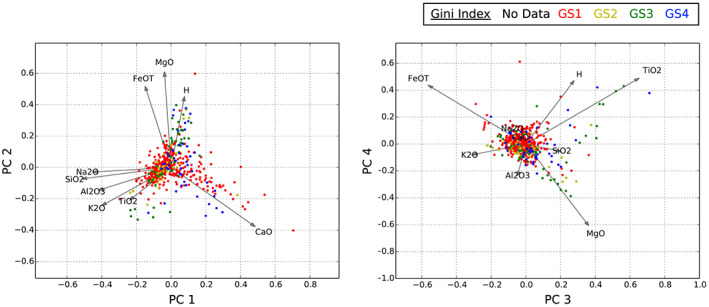
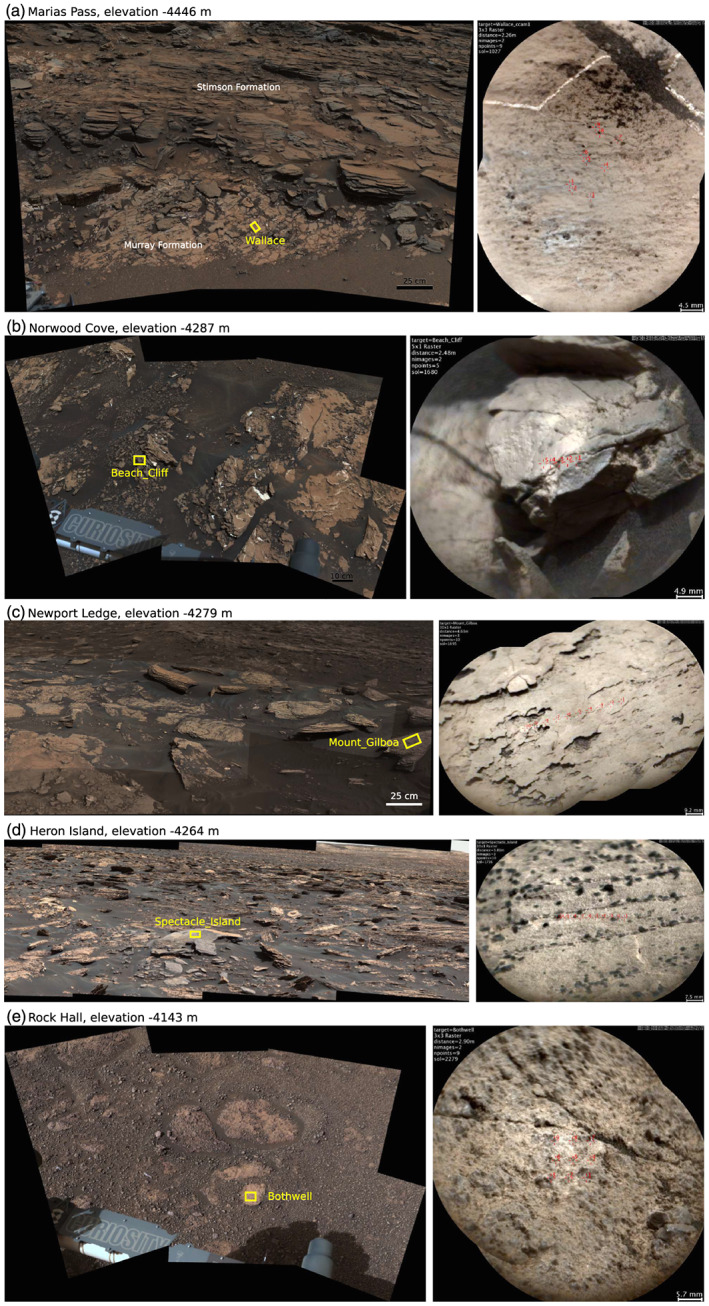
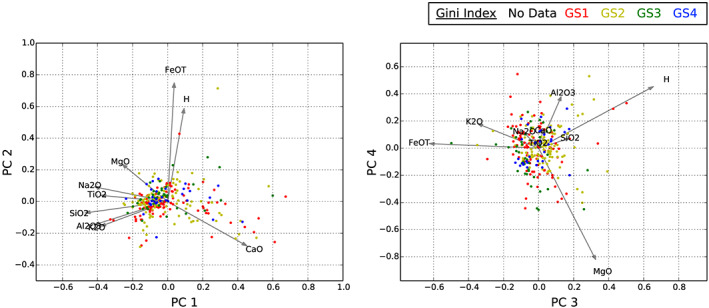
The Mars Science Laboratory (MSL) Curiosity rover is exploring the Murray formation, a sequence of heterolithic mudstones and sandstones recording fluvial deltaic and lake deposits that comprise over 350 m of sedimentary strata within Gale crater. We examine >4,500 Murray formation bedrock points, employing recent laboratory calibrations for ChemCam laser-induced breakdown spectroscopy H measurements at millimeter scale. Bedrock in the Murray formation has an interquartile range of 2.3-3.1 wt.% H2O, similar to measurements using the Dynamic Albedo of Neutrons and Sample Analysis at Mars instruments. However, specific stratigraphic intervals include high H targets (6-18 wt.% H2O) correlated with Si, Mg, Ca, Mn, or Fe, indicating units with opal, hydrated Mg sulfates, hydrated Ca sulfates, Mn-enriched units, and akageneite or other iron oxyhydroxides, respectively. One stratigraphic interval with higher hydrogen is the Sutton Island unit and Blunts Point unit contact, where higher hydrogen is associated with Fe-rich, Ca-rich, and Mg-rich points. A second interval with higher hydrogen occurs in the Vera Rubin ridge portion of the Murray formation, where higher hydrogen is associated with Fe-rich, Ca-rich, and Si-rich points. We also observe trends in the H signal with grain size, separate from chemical variation, whereby coarser-grained rocks have higher hydrogen. Variability in the hydrogen content of rocks points to a history of water-rock interaction at Gale crater that included changes in lake water chemistry during Murray formation deposition and multiple subsequent groundwater episodes.
Keywords: Mars Science Laboratory Curiosity rover; aqueous geochemistry; hydrogen.
©2020 The Authors.
Figures
References
-
- Anderson, R. B. , Morris, R. V. , Clegg, S. M. , Bell, J. F. , Wiens, R. C. , Humphries, S. D. , Mertzman, S. A. , Graff, T. G. , & McInroy, R. (2017). The influence of multivariate analysis methods and target grain size on the accuracy of remote quantitative chemical analysis of rocks using laser induced breakdown spectroscopy. Icarus, 215(2), 608–627. 10.1016/j.icarus.2011.07.034 - DOI
-
- Banham, S. G. , Gupta, S. , Rubin, D. M. , Watkins, J. A. , Sumner, D. Y. , Edgett, K. S. , Grotzinger, J. P. , Lewis, K. W. , Edgar, L. A. , Stack‐Morgan, K. M. , Barnes, R. , Bell, J. , Day, M. D. , Ewing, R. C. , Lapotre, M. G. A. , Stein, N. T. , Rivera‐Hernandez, F. , & Vasavada, A. R. (2018). Ancient Martian aeolian processes and palaeomorphology reconstructed from the Stimson formation on the lower slope of Aeolis Mons, Gale crater, Mars. Sedimentology, 65(4). 10.1111/sed.12469 - DOI
-
- Bish, D. L. , Carey, W. , Vaniman, D. T. , & Chipera, S. J. (2003). Stability of hydrous minerals on the Martian surface. Icarus, 164(1), 96–103. 10.1016/S0019-1035(03)00140-4 - DOI
-
- Blake, D. , Vaniman, D. , Achilles, C. , Anderson, R. , Bish, D. , Bristow, T. , Chen, C. , Chipera, S. , Crisp, J. , Des Marais, D. , Downs, R. T. , Farmer, J. , Feldman, S. , Fonda, M. , Gailhanou, M. , Ma, H. , Ming, D. W. , Morris, R. V. , Sarrazin, P. , Stolper, E. , Treiman, A. , & Yen, A. (2012). Characterization and calibration of the CheMin mineralogical instrument on Mars Science Laboratory. Space Science Reviews, 170(1–4), 341–399. 10.1007/s11214-012-9905-1 - DOI
-
- Bristow, T. F. , Rampe, E. B. , Achilles, C. N. , Blake, D. F. , Chipera, S. J. , Craig, P. , Crisp, J. A. , Des Marais, D. J. , Downs, R. T. , Gellert, R. , Grotzinger, J. P. , Gupta, S. , Hazen, R. M. , Horgan, B. , Hogancamp, J. V. , Mangold, N. , Mahaffy, P. R. , McAdam, A. C. , Ming, D. W. , Morookian, J. M. , Morris, R. V. , Morrison, S. M. , Treiman, A. H. , Vaniman, D. T. , Vasavada, A. R. , & Yen, A. S. (2018). Clay mineral diversity and abundance in sedimentary rocks of Gale crater, Mars. Science Advances, 4(6), eaar3330 10.1126/sciadv.aar3330 - DOI - PMC - PubMed
LinkOut - more resources
Full Text Sources
Miscellaneous