. 2020 Oct;10(10):436.
doi: 10.1007/s13205-020-02431-x. Epub 2020 Sep 16.

Biochemical characterization of a glycosyltransferase Gtf3 from Mycobacterium smegmatis: a case study of improved protein solubilization

Affiliations

Biochemical characterization of a glycosyltransferase Gtf3 from Mycobacterium smegmatis: a case study of improved protein solubilization

Mahfoud Bakli et al. 3 Biotech. 2020 Oct.

Abstract

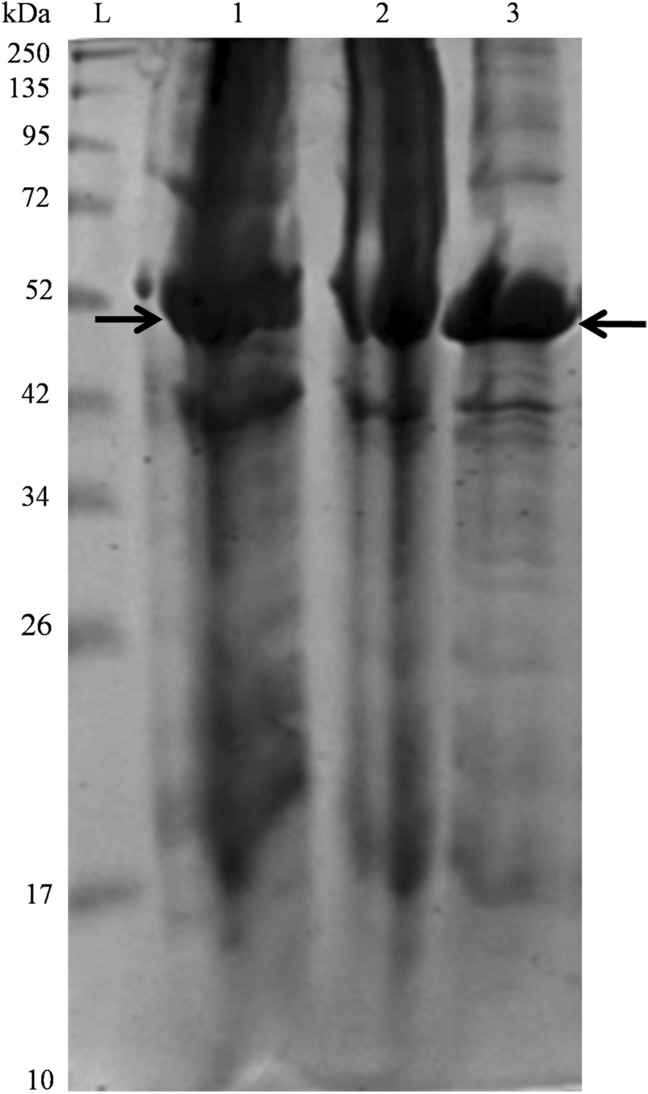
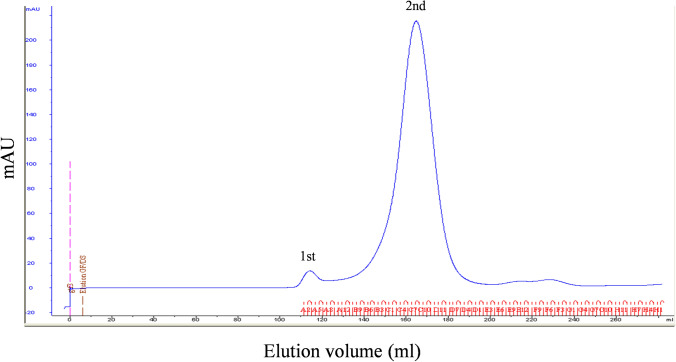
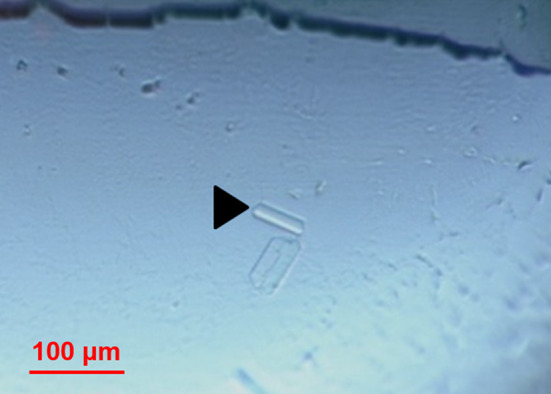
Glycosyltransferases (GTs) are widely present in several organisms. These enzymes specifically transfer sugar moieties to a range of substrates. The processes of bacterial glycosylation of the cell wall and their relations with host-pathogen interactions have been studied extensively, yet the majority of mycobacterial GTs involved in the cell wall synthesis remain poorly characterized. Glycopeptidolipids (GPLs) are major class of glycolipids present on the cell wall of various mycobacterial species. They play an important role in drug resistance and host-pathogen interaction virulence. Gtf3 enzyme performs a key step in the biosynthesis of triglycosylated GPLs. Here, we describe a general procedure to achieve expression, purification, and crystallization of recombinant protein Gtf3 from Mycobacterium smegmatis using an E. coli expression system. We reported also a combined bioinformatics and biochemical methods to predict aggregation propensity and improve protein solubilization of recombinant Gtf3. NVoy, a carbohydrate-based polymer reagent, was added to prevent protein aggregation by binding to hydrophobic protein surfaces of Gtf3. Using intrinsic tryptophan fluorescence quenching experiments, we also demonstrated that Gtf3-NVoy enzyme interacted with TDP and UDP nucleotide ligands. This case report proposes useful tools for the study of other glycosyltransferases which are rather difficult to characterize and crystallize.

Keywords: Expression and purification of recombinant protein; Glycosyltransferase; Mycobacterium smegmatis; Protein solubilization.


Conflict of interest statement

Competing interestThe authors have declared no conflict of interest.

Figures

Fig. 1
Fig. 1
Secondary structure prediction of Gtf3 protein. The protein structure prediction was performed using Phyre2 web server and visualized using Pymol 2.3 molecular graphics software. a Secondary structure prediction of Gtf3 protein showing α-helix (red), β-sheets (yellow), and loops (green). b Surface of the Gtf3 model predicted by the Phyre2 showing hydrophobic patches (orange regions)
Fig. 2
Fig. 2
SDS-PAGE gel of expressed and purified recombinant Gtf3 protein. Gtf3 recombinant protein samples from M. smegmatis expressed in E. coli expression system and purified by affinity chromatography were separated on 12% SDS-PAGE and post-stained with Imperial™ Protein Stain (Thermo Scientific). Lane L, molecular weight marker (BenchMark™ Protein Ladder). Lane 1, insoluble fraction (pellet). Lane 2, soluble fraction (supernatant). Lane 3, the recombinant Gtf3 purified by His-Trap HP 5-ml column affinity chromatography. Arrows show Gtf3 protein bands in insoluble fraction and pure fraction
Fig. 3
Fig. 3
Gel filtration chromatography elution profile of Gtf3 protein. Gel filtration of Gtf3 on a HiLoad 26/60 Superdex 75 pg column. The first peak (fractions A2–A8) represents the aggregated protein and the second peak (fractions B6–D6) hexameric Gtf3. Elution volume of Gtf3 protein was 170 ml
Fig. 4
Fig. 4
a SDS-PAGE gel of purified recombinant Gtf3 protein stained with Coomassie blue. Gtf3 purified by both affinity and gel filtration chromatographies, were separated on 12% SDS-PAGE and post-stained with Imperial™ Protein Stain (Thermo Scientific). Five microliter of each collected fraction were loaded per well. Lane L, molecular weight marker (Pierce Unstained Protein MW Ladder). Other wells, peak fractions (Lanes 1–9) collected from gel filtration chromatography. Lane 1 corresponds to pooled fractions from the first peak. Lane 2 corresponds to pooled fractions (A9-B5) between the first and the second peaks. Lanes 3–9 correspond to fractions from the second peak. MW: molecular weight. kDa: kiloDalton. b Calibration of gel filtration column. Protein standards of known molecular weight were used to calibrate the 26/60 Superdex 75 pg gel filtration column, i.e., blue dextran (2000 kDa; peak 1), albumin (67 kDa; peak 2), ovalbumin (43 kDa peak 3), chymotrypsinogen (25 kDa; peak 4) and ribonuclease A (13.7 kDa; peak 5). c Linear regression analysis of the gel filtration calibration. Kav = (VeVo)/(VTVo), Ve is the elution volume, and VT and Vo are the total liquid volume (320 ml) and the void volume of the column (113 ml), respectively
Fig. 5
Fig. 5
Circular dichroism (CD) spectrum of Gtf3 protein
Fig. 6
Fig. 6
MALS/UV/refractometry/SEC analysis of Gtf3 protein using a KW-804 column. The left y-axis represents the molar mass, and the right y-axis represents the absorbance at 280 nm according to the retention volume of the column (x-axis). The colored plots represent the measured molecular weights of pentameric Gtf3 (red line), monomeric Gtf3 + NVoy (blue line). Values of the measured masses at the volume corresponding to the base of each peak are reported according to the same color scheme
Fig. 7
Fig. 7
Crystals of Gtf3 protein. Crystals of Gtf3 with NVoy polymer in a drop of crystallization plates (Greiner Bio-one), obtained under the conditions: 2.5 M NaCl, 0.1 M Tris pH 7, and 0.2 M MgCl2
Fig. 8
Fig. 8
Nucleotide quenching of intrinsic Gtf3 fluorescence. a Fluorescence quenching of Gtf3-NVoy with increasing concentrations of TDP. b Fluorescence quenching of Gtf3-NVoy with increasing concentrations of UDP. The first black spectrum at the top represents the intensity of fluorescence of Gtf3 without ligand. The other colored spectra, from top to bottom, represent the intensities of fluorescence of increasing concentrations of ligands. The gray spectrum at the bottom represents the intensity of fluorecsence of the buffer (blank)

References

    1. Ali ZM, Bakli M, Fontaine A, Bakkali N, Hai VV, Audebert S, Boublik Y, Pagès F, Remoué F, Rogier C. Assessment of Anopheles salivary antigens as individual exposure biomarkers to species-specific malaria vector bites. Malaria J. 2012;11(1):439. doi: 10.1186/1475-2875-11-439. - DOI - PMC - PubMed
    1. Biasini M, Bienert S, Waterhouse A, Arnold K, Studer G, Schmidt T, Kiefer F, Cassarino TG, Bertoni M, Bordoli L. SWISS-MODEL: modelling protein tertiary and quaternary structure using evolutionary information. Nucleic Acids Res. 2014;42(W1):W252–W258. doi: 10.1093/nar/gku340. - DOI - PMC - PubMed
    1. Billman-Jacobe H (2004) Glycopeptidolipid synthesis in mycobacteria. Curr Sci 111–114
    1. Bitard-Feildel T, Lamiable A, Mornon JP, Callebaut I. Order in disorder as observed by the “hydrophobic cluster analysis” of protein sequences. Proteomics. 2018;18(21–22):1800054. doi: 10.1002/pmic.201800054. - DOI - PMC - PubMed
    1. Bramucci E, Paiardini A, Bossa F, Pascarella S. PyMod: sequence similarity searches, multiple sequence-structure alignments, and homology modeling within PyMOL. BMC Bioinf. 2012;13(4):S2. doi: 10.1186/1471-2105-13-S4-S2. - DOI - PMC - PubMed