. 2020 Jul 27;7(18):1900840.
doi: 10.1002/advs.201900840. eCollection 2020 Sep.

Sublethal Levels of Antibiotics Promote Bacterial Persistence in Epithelial Cells

Affiliations

Sublethal Levels of Antibiotics Promote Bacterial Persistence in Epithelial Cells

Xiaoye Liu et al. Adv Sci (Weinh). .

Abstract

Antibiotic therapy and host cells frequently fail to eliminate invasive bacterial pathogens due to the emergence of antibiotic resistance, resulting in the relapse and recurrence of infections. Bacteria evolve various strategies to persist and survive in epithelial cells, a front-line barrier of host tissues counteracting invasion; however, it remains unclear how bacteria hijack cellular responses to promote cytoplasmic survival under antibiotic therapy. Here, it is demonstrated that extracellular bacteria show invasive behavior and survive in epithelial cells in both in vivo and in vitro models, to increase antibiotic tolerance. In turn, sublethal levels of antibiotics increase bacterial invasion through promoting the production of bacterial virulence factors. Furthermore, antibiotic treatments interrupt lysosomal acidification in autophagy due to the internalized bacteria, using Bacillus cereus and ciprofloxacin as a model. In addition, it is found that sublethal levels of ciprofloxacin cause mitochondrial dysfunction and reactive oxygen species (ROS) accumulation to impair lysosomal vascular tape ATPase (V-ATPase) to further promote bacterial persistence. Collectively, these results highlight the potential of host cells mediated antibiotic tolerance, which markedly compromises antibiotic efficacy and worsens the outcomes of infection.

Keywords: antibiotic; antibiotic tolerance; autophagy; bacteria; epithelial cells.


Conflict of interest statement

The authors declare no conflict of interest.

Figures

Figure 1
Figure 1
Increased tolerance of bacteria in epithelial cells against antibiotics. A) Bacterial internalization in epithelial cells. IEC‐6 cells were infected with diverse bacteria for 2 h, including B. cereus NVH0075/95, E. coli ATCC25922, E. faecalis ATCC29212, S. aureus ATCC29213, S. suis CQ2B50, K. pneumoniae 1202, P. aeruginosa PAO1, and V. parahaemolyticus ATCC17802. F‐actin were stained by rhodamine phalloidin (red) and nuclei were counterstained with DAPI (blue). B. cereus expressing GFP (green) and the other bacteria were labeled with pHrodo (green). Scale bar = 10 µm. B) Internalized bacteria were tolerant to antibiotics. Experimental workflow of intracellular MBC and extracellular MBC assays (left). Fold changes were calculated as the ratios of the values of intracellular MBC to values of extracellular MBC (right). Ciprofloxacin was used for all bacteria tested, except S. suis with ampicillin and K. pneumoniae with polymyxin B. C) The intracellular and extracellular MBCs. Extracellular MBCs were the minimum antibiotic doses that prevented the survival of B. cereus NVH0075/95 (with > 99.9% bacteria dead), which was detected based on the extracellular MICs that prevented bacterial growth in DMEM. Intracellular MBCs were the minimum doses that prevented the survival of internalized B. cereus NVH0075/95 in various mammalian cells (> denoted the continuous growth of bacteria under the maximum dose of antibiotics tested). Data were presented as means from three different experiments.
Figure 2
Figure 2
Sublethal levels of antibiotics promote toxin production facilitating bacterial invasion. A,B) Antibiotics promoted the production of bacterial toxins. IEC‐6 cells were infected with B. cereus NVH0075/95 or S. aureus ATCC29213 at the MOI of 40 in the presence of antibiotics (0.5 µg mL−1 ciprofloxacin, 0.25 µg mL−1 erythromycin, 4 µg mL−1 tetracycline, 0.625 µg mL−1 rifampin, and 2 µg mL−1 vancomycin) for 8 h. The levels of Nhe from B. cereus or AT (α‐toxin) from S. aureus were measured using enzyme immunoassays. C) Exogenous addition of Nhe and AT promoted the invasion of B. cereus NVH0075/95 and S. aureus ATCC29213, respectively. Antibodies mAb 1E11 neutralizing Nhe, MEDI4893* neutralizing AT and rabbit anti‐IgG antibody were used. D,E) Cytotoxicity of bacterial toxins. Accelerated release of choline (D) and LDH (E) from IEC‐6 cells treated with Nhe (23 ng mL−1) or AT (ng mL−1) and their corresponding neutralizing antibodies (anti‐NheB mAb 1E11, 2 µg mL−1, and anti‐α‐toxin mAb, MEDI4893*, 5 µg mL−1) for 2 h. F) Fas and ASK1 pathways induced were involved against B. cereus invasion. Numbers of internalized bacteria in the wide‐type and mutant (Δfas or ΔASK1) Vero cells infected with B. cereus NVH0075/95 (MOI = 40) in 48 h. NQDI1 is a specific inhibitor of ASK1 and results are representative of three independent assays. G) Additional PLC increased bacterial invasion. PLC is derived from B. cereus and D609 is a specific inhibitor of PLC. Data are represented as mean ± SEM, *p < 0.05, **p < 0.01, ***p < 0.001, n = 6.
Figure 3
Figure 3
Sublethal levels of antibiotics promote bacterial internalization in vivo. A) Growth dynamics of internalized B. cereus in IEC‐6 cells. Confocal images of IEC‐6 cells infected with GFP‐labeled was counterstained B. cereus (green, MOI = 40) for 2 to 24 h. The 3D images were obtained by CLSM, F‐actin was visualized using rhodamine phalloidin (red) and nuclei with DAPI (blue). Scale bars: 5 µm. B) Antibiotics promoted bacterial internalization in mice. Mice were infected with 1 × 10⁹ CFUs of B. cereus under the treatments of 0.5‐fold extracellular MICs of each antibiotic for 24 h. B. cereus were shown in green (arrowheads). Sections of ileum were stained by hematoxylin–eosin (H&E) stain (upper) and confocal images (bottom). Scar bars = 20 µm. C) Antibiotics promoted bacterial internalization in the small intestine of mice. The numbers of B. cereus in ileums were counted in the presence of each antibiotic at the levels of 0.5 extracellular MICs. ***p < 0.0001, n = 5 mice per group.
Figure 4
Figure 4
Antibiotics interrupt autophagy to assist bacterial survival. A) Ciprofloxacin and tetracycline suppressed autophagy. IEC‐6 cells were transfected with modified adenoviruses (Ad‐mcherry‐GFP‐LC3B and Ad‐GFP‐p62) and infected with B. cereus NVH0075/95 (MOI = 40) under antibiotic treatments (0.5 µg mL−1 ciprofloxacin and 4 µg mL−1 tetracycline) for 8 h. Merge of LC3B presented either non‐autophagy (yellow LC3B dispersion), autophagy (red LC3B puncta) or autophagy arrest (yellow LC3B puncta). Scar bars = 3 µm. B) Percentage of LC3B puncta and p62 puncta was quantified from (A). The percentage of LC3B was calculated from the ratio of yellow LC3B puncta to red LC3B puncta. The fold changes of p62 puncta were compared to the untreated group. Both LC3B and p62 puncta were randomly selected from 30 cells. C) Expression of p62 and LC3 in IEC‐6 cells infected with B. cereus NVH0075/95 (MOI = 40) under antibiotics. Both the expression of LC3‐II and p62 were normalized to the levels of β‐actin based on Western blot analysis. Data are showed as means ± SEM (n = 3, *p < 0.05, **p < 0.001, ***p < 0.0001). D) Antibiotic treatments decreased the colocalization of bacteria with acidified compartments. IEC‐6 cells were infected with GFP labeled B. cereus (MOI = 40) for 8 h, in the presence of each antibiotics of 0.5‐fold of extracellular MICs (0.5 µg mL−1ciprofloxacin, 0.25 µg mL−1 erythromycin, 4 µg mL−1 tetracycline, 0.625 µg mL−1 rifampin, and 2 µg mL−1 vancomycin). Cells were stained by Hoechst (nucli, blue) and LysoTracker (acidified compartments, red). The arrowheads mark the colocalization of bacteria with acidified compartments. E) Antibiotics decreased acidification of compartments. Quantified bacterial colocalization with acidified compartments from D was showed (upper). Dynamic curves of acidified compartments probing with LysoTracker (bottom). Data are represented as mean ± SEM (n = 6, ***p < 0.0001).
Figure 5
Figure 5
Sublethal levels antibiotics inhibited lysosomal V‐ATPase to facilitate bacteria survival. A) Inhibition of acidified lysosomes enhancing the intracellular survival of B. cereus. Bafilomycin A1 (100 nm) was used to inhibited V‐ATPase in IEC‐6 cells for 1 h. Rapamycin (100 nm) was employed to inhibit autophagy. The numbers of internalized bacteria were counted by the CFU assay. Results are shown as means ± SEM (n = 6, **p < 0.01, ***p < 0.001). Scale bar: 20 µm. B) Expression of ATP6V1D in lysosomes using Western blot. IEC‐6 cells were infected with B. cereus NVH0075/95 (MOI = 40) under ciprofloxacin treatment (0.5 µg mL−1). All proteins were normalized to the levels of β‐actin (compared to sole bacterial infectious group). Results are shown as means ± SEM (*p < 0.05; **p < 0.001). C) Increase of ATP levels under antibiotic exposure. IEC‐6 cells were infected with B. cereus under antibiotic treatments (0.5 µg mL−1ciprofloxacin, 0.25 µg mL−1 erythromycin, 4 µg mL−1 tetracycline, 0.625 µg mL−1 rifampin, and 2 µg mL−1 vancomycin). The release of ATP in the supernatants were measured by normalizing the ATP levels to the amount of proteins. Data are shown as mean ± SEM for at least three replicates (**p < 0.01). D) Expression of ATP6V0D in the lysosome of IEC‐6 cells. Cells were infected with B. cereus NVH0075/95 (MOI = 40) with the treatment of 0.5 µg mL−1 ciprofloxacin. Cells were pre‐incubated with bafilomycin A1 (100 × 10−9 m) for 1 h to inhibit V‐ATPase. Rapamycin (100 × 10−9 m) targeting mTOR was used as an inducer of autophagy. All proteins were normalized to the levels of β‐actin. Data are showed as means ± SEM (*p < 0.05, **p < 0.001, n = 3).
Figure 6
Figure 6
Antibiotics induced mitochondrial dysfunction causing inhibition of lysosomal V‐ATPase. A) Decreased activity of ACP. IEC‐6 cells were infected with B. cereus (MOI = 40) in the presence of sublethal level of 0.5 µg mL−1 ciprofloxacin for 8 h. Data are represented as mean ± SEM. (**p < 0.01, ***p < 0.001, n = 3). B) Damaged structure of mitochondria. The mitochondria in IEC‐6 cells treated with ciprofloxacin were tracked by mitotracker. C) Accumulation of intracellular ROS in IEC‐6 cells based on Flow cytometry analysis. Rosup (125 µg mL−1) was a positive control for the generation of ROS. Results are showed as mean ± SEM (***p < 0.001, n = 3). D) Changes of membrane potential (Δψm) in mitochondria at 24 h infection. Confocal images of JC‐1 in IEC‐6 cells. JC‐1 is in red fluorescence when Δψm is high, whereas in green when Δψm is low. Scale bar: 25 µm. E) The radio of JC‐1 green to red fluorescence from (D). The radio of green fluorescence to red indicates that JC‐1 aggregates into monomers, representing the loss of Δψm. NAC (5 mm) was used to eliminate intracellular ROS. F) Antibiotic treatment inhibited ATPV0D1. IEC‐6 cells infected with B. cereus were treated with sub‐lethal ciprofloxacin at concentrations of 0.5 µg mL−1. NAC is as a ROS scavenger. Expression of ATPV0D1 (red) was detected by immunofluorescence. Data are showed as mean ± SEM. (***p < 0.001, ns: p > 0.05, n = 3). Scale bar: 10 µm.
Figure 7
Figure 7
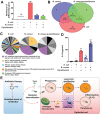
Transcriptome analysis of IEC‐6 infected with bacteria. A) Numbers of different genes in IEC‐6 cells infected with E. coli ATCC25922 or B. cereus NVH0075/95 in the presence and absence of 0.5 µg mL−1 ciprofloxacin at MOI of 40 for 8 h. Cellular RNA were sequenced by RNA‐Seq. The significant genes were calculated by comparing to the untreated cells, with DEseq2. Only genes with log2 fold Change≥2, FDR < 0.01 for further analysis. B) Venn diagram of (A). C) The families and domains of potential proteins. The numbers of related proteins were labeled and proteins were annotated using the Pfam database. D) Expression of IL‐8 in IEC‐6 cells. The cells were infected with either B. cereus or E. coli in the presence of 0.5 µg mL−1 ciprofloxacin. Data are presented as means ± SEM (*p < 0.05, ***p < 0.001, n = 3). E) Scheme of sublethal levels of antibiotics promote bacterial survival in host cells.

References

    1. Blaser M. J., Science 2016, 352, 544. - PMC - PubMed
    1. Kupferschmidt K., Science 2016, 352, 758. - PubMed
    1. Brown D., Nat. Rev. Drug Discovery 2015, 14, 821. - PubMed
    1. Song M., Liu Y., Huang X. H., Chen S., Ding S., Wang Y., Shen J., Zhu K., Nat. Microbiol. 2020, 5, 1040. - PubMed
    1. Liu Y., Jia Y., Yang K., Li R., Xiao X., Zhu K., Wang Z., Adv. Sci. 2020, 7, 1902227. - PMC - PubMed

LinkOut - more resources