. 2020 Aug;9(4):426-439.
doi: 10.1159/000506352. Epub 2020 Mar 17.

Association between Genetic and Immunological Background of Hepatocellular Carcinoma and Expression of Programmed Cell Death-1

Affiliations

Association between Genetic and Immunological Background of Hepatocellular Carcinoma and Expression of Programmed Cell Death-1

Naoshi Nishida et al. Liver Cancer. 2020 Aug.

Abstract

Background and aim: Immune checkpoint inhibitors are promising agents for the treatment of hepatocellular carcinomas (HCC) refractory to conventional therapies. To enhance the efficacy of this treatment, immunological and molecular characteristics of HCC with programmed cell death ligand 1 (PD-L1) should be explored.

Methods: Clinical backgrounds, PD-L1 expression, and the amount of CD8+ tumor-infiltrating mononuclear cells (TIMCs) were analyzed in 154 HCCs. The expression of 3 stem cell markers and co-inhibitory receptors on tumor cells and TIMCs, respectively, were examined by immunohistochemical analysis. Somatic mutations in the 409 cancer-associated genes and TERT promoter were determined; HCCs were classified based on the presence of gene alterations affecting the 8 oncogenic pathways. The results were validated using the dataset from the Cancer Genome Atlas.

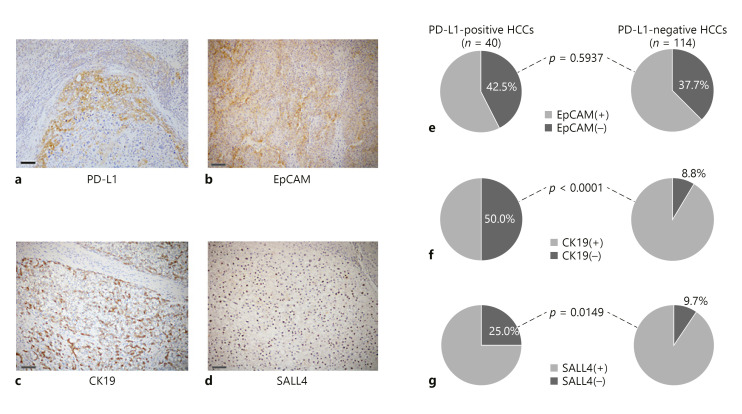
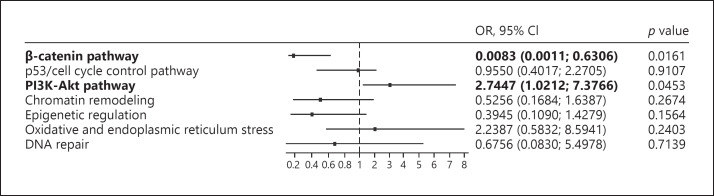
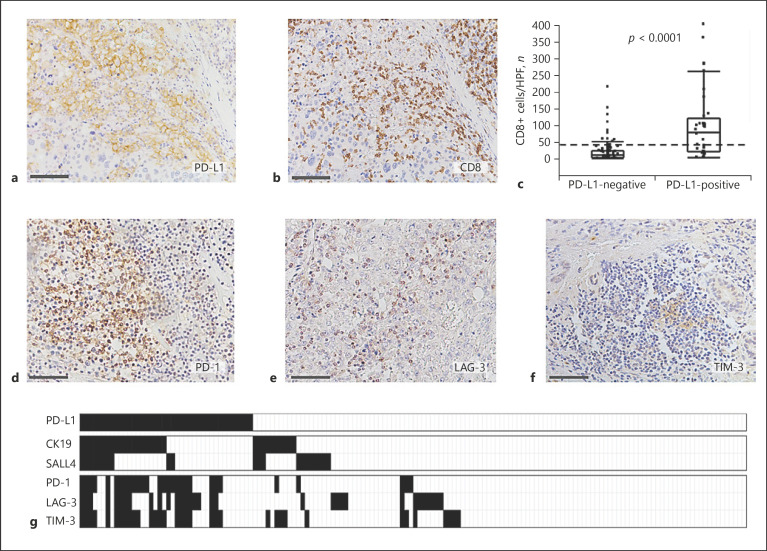
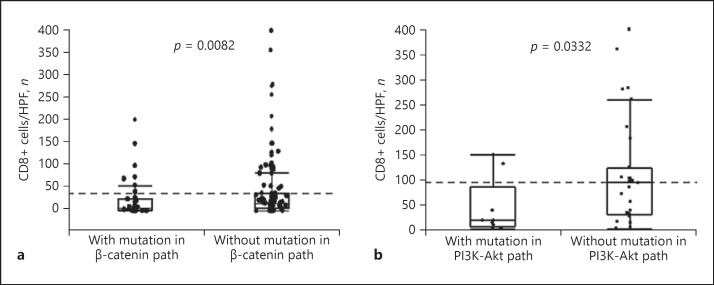
Results: The expression of PD-L1 in the HCCs was positively correlated with progressive tumor features, the presence of cytokeratin 19 (CK19), Sal-like protein 4 (SALL4), and the mutations of genes involving the phosphatidyl inositol 3-kinase (PI3K)-Akt pathway. Although CD8+ cells were densely infiltrated in PD-L1-positive tumors, these TIMCs frequently expressed multiple co-inhibitory receptors. However, a subset of PD-L1-positive tumors characterized by activating mutations of the PI3K-Akt pathway showed a low degree of TIMCs. Conversely, PD-L1-negative HCCs were associated with mutations in the β-catenin pathway and a small number of TIMCs, although the expression of co-inhibitory receptors was rare.

Conclusions: PD-L1-positive HCCs frequently showed an inflamed phenotype with stem cell features; a subset of PD-L1-positive HCCs with mutations in the PI3K-Akt pathway showed a non-inflamed phenotype. In HCCs with dense infiltration of TIMCs, CD8+ cells expressed multiple co-inhibitory receptors, suggesting T cell exhaustion. On the other hand, PD-L1-negative HCCs showed mutations leading to β-catenin activation and exhibited a non-inflamed background. These characteristics should be taken into consideration for developing novel combination therapies using immune checkpoint inhibitors.

Keywords: Cancer stem cell; Cell signal; Hepatocellular carcinoma; Immune checkpoint inhibitors; Mutation.


Conflict of interest statement

N.N. received research grants from Gilead Sciences. M.K. received research grants from Taiho Pharmaceuticals, Chugai Pharmaceuticals, Otsuka, Takeda, Sumitomo Dainippon-Sumitomo, Daiichi Sankyo, AbbVie, Astellas Pharma, and Bristol-Myers Squibb; grants and personal fees from MSD, Eisai, and Bayer; and is an adviser for MSD, Eisai, Bayer, Bristol-Myers Squibb, Eli Lilly, and ONO Pharmaceutical. All other authors have nothing to declare.

Figures

Fig. 1
Fig. 1
Association between expression of PD-L1 and stem/biliary markers in HCC. Expression of PD-L1 (a), and stem/biliary markers; EpCAM (b), CK19 (c), and SALL4 (d) by immunohistochemistry. Scale bar, 100 μm. e Seventeen of the 40 PD-L1-positive HCCs (42.5%) showed EpCAM expression; 43 of the 114 PD-L1-negative HCCs (37.4%) were positive for EpCAM (p =0.5937, Pearson's χ2 test). f In the 40 PD-L1-positive HCCs, 20 (50.0%) were positive for CK19; only 10 of 114 PD-L1-negative HCCs (8.8%) showed CK19 expression (p < 0.0001, Pearson's χ2 test). g Similarly, a significantly higher percentage of tumors showed expression of SALL4 in the PD-L1-positive HCCs compared to the PD-L1-negative HCCs, where 25% (10/40) of the PD-L1-positive tumors and 9.7% (11/114) of the PD-L1-negative tumors showed expression of SALL4, respectively (p = 0.0149, Pearson's χ2 test).
Fig. 2
Fig. 2
The odds ratio (OR) of genetic alteration of each signaling pathway for the relative risk of expressing PD-L1 in the HCC cohort from the publicly available TCGA database. The dataset of whole exome sequence and mRNA expression (RNA sequence) of CD274 (PD-L1) in 373 HCC tissues was obtained. HCCs were classified based on the mutation involved in each oncogenic pathway, which was available in the cBioPortal for Cancer Genomics web site (https://www.cbioportal.org). We calculated the OR of genetic alterations of each oncogenic pathway for the relative risk of PD-L1 expression ≥35 using logistic regression analysis. Alterations in the PI3K-Akt pathway showed the highest OR for the high expression of PD-L1 (p = 0.0453; OR 2.7447; 95% confidence interval [CI] 1.0212–7.3766), whereas those in the β-catenin pathway showed the lowest risk (p = 0.0161; OR 0.0083; 95% CI 0.0011–0.6306). Mutations involved in the TERT were excluded from the analysis because only 2 HCCs showed mutations based on the exome sequencing. Genes for classification of the mutations into each pathway which were included in the Ion AmpliSeqTM Comprehensive Cancer Panel were selected from the TCGA database by referring to the gene set shown in online supplementary Figure S2. Annotation of the genes for the oncogenic pathways is listed below. β-Catenin pathway: APC, AXIN1, and CTNNB1.p53/cell cycle control pathway: ATM, ATR, CCND1, CCND2, CCNE1, CDK12, CDKN2A, CREBBP, FBXW7, MDM2, RB1, RPS6KA2, and TP53.PI3K-Akt pathway: PI3KCA, PI3KC2B, PI3KCB, PTEN, MAP3K7, RPS6CA2, TSC1, and TSC2. Chromatin remodeling: ARID1A, ARID1B, ARID2, CREBBP, EZH2, and SMARCA2. Epigenetic regulation: DNMT3A, IDH1, IDH2, KMT2A, KMT2B, KMT2C, KMT2D, SETD2, TET1, and TET2. Oxidative and endoplasmic reticulum stress: ATF1, CYP2C19, KEAP1, NFE2L2, and ROS1.DNA repair: ATM, ERCC2, ERCC5, FANCA, MLH1, MSH2, MSH6, XZCC2.
Fig. 3
Fig. 3
Expression of co-inhibitory receptors in the CD8+-infiltrated cells in a PD-L1-positive tumor. a Membranous expression of PD-L1 in HCC tissues. b Dense infiltration of CD8+ cells in the same section of HCC tissues shown in (a). Scale bar, 100 μm. c Comparison of degree of infiltration of CD8+ cells in PD-L1-negative and PD-L1-positive HCCs. Numbers of CD8+ cells/HPF are shown in the vertical axis. The box-and-whisker plots denote 75 and 95% distribution, and the lines in the boxes show the median values of each group. The dashed line shows the mean value of this cohort. The median degree of infiltration of CD8+ cells was 63.7 cells/HPF (25–75 percentiles; 20.2–103.4) in PD-L1-positive and 9.4 cells/HPF (25–75 percentiles; 2.4–22.9) in PD-L1-negative HCC tissues, respectively (p < 0.0001, Wilcoxon sum-rank test). Expression of PD-1 (d), LAG-3 (e), and TIM-3 (f) on immunohistochemistry. Scale bar, 100 μm. g The heat map shows the association among expressions of PD-L1, stem/biliary cell markers in HCC cells, and those of co-inhibitory receptors in the tumor-infiltrated mononuclear cells (TIMCs). The black rectangle shows the cases with positive immunostaining. The expression of the stem cell markers, CK19 and SALL4, was more frequent in PD-L1-positive HCCs. Although infiltration of CD8+ cells was more prominent in PD-L1-positive HCCs (as shown in c); multiple co-inhibitory receptors were also expressed in TIMCs of PD-L1-positive HCCs.
Fig. 4
Fig. 4
Infiltration of CD8+ cells in tumors and genetic alterations in oncogenic pathways. a The degree of CD8+ TIMCs and the presence of activating mutations in the β-catenin pathway (path). The median degree of infiltration of CD8+ cells was 6.2 cells/HPF (25–75 percentiles; 1.3–26.4) in tumors with mutation and 17.6 cells/HPF (25–75 percentiles; 5.8–38.0) in tumors without mutation in the β-catenin pathway, respectively (p = 0.0082, Wilcoxon sum-rank test). b The degree of CD8+ TIMCs and the presence of activating mutations in the PI3K-Akt pathway (path) in PD-L1-positive HCCs. The median number of CD8+ cells (25th–75th percentile) was 20.3 (12.5–36.4) in the PD-L1-positive HCCs with mutations in the PI3K-Akt pathway and 94.3 (30.5–119.7) in those without mutations, respectively (p = 0.0332, Wilcoxon sum-rank test).

References

    1. Llovet JM, Montal R, Sia D, Finn RS. Molecular therapies and precision medicine for hepatocellular carcinoma. Nat Rev Clin Oncol. 2018 Oct;15((10)):599–616. - PubMed
    1. Villanueva A. Hepatocellular Carcinoma. N Engl J Med. 2019 Apr;380((15)):1450–62. - PubMed
    1. Terris B, Cavard C, Perret C. EpCAM, a new marker for cancer stem cells in hepatocellular carcinoma. J Hepatol. 2010 Feb;52((2)):280–1. - PubMed
    1. Yong KJ, Gao C, Lim JS, Yan B, Yang H, Dimitrov T, et al. Oncofetal gene SALL4 in aggressive hepatocellular carcinoma. N Engl J Med. 2013 Jun;368((24)):2266–76. - PMC - PubMed
    1. Miltiadous O, Sia D, Hoshida Y, Fiel MI, Harrington AN, Thung SN, et al. Progenitor cell markers predict outcome of patients with hepatocellular carcinoma beyond Milan criteria undergoing liver transplantation. J Hepatol. 2015 Dec;63((6)):1368–77. - PubMed