. 2021 Apr;76(4):1173-1187.
doi: 10.1111/all.14606. Epub 2020 Oct 14.

Microbial and transcriptional differences elucidate atopic dermatitis heterogeneity across skin sites

Affiliations

Microbial and transcriptional differences elucidate atopic dermatitis heterogeneity across skin sites

Noora Ottman et al. Allergy. 2021 Apr.

Abstract

It is well established that different sites in healthy human skin are colonized by distinct microbial communities due to different physiological conditions. However, few studies have explored microbial heterogeneity between skin sites in diseased skin, such as atopic dermatitis (AD) lesions. To address this issue, we carried out deep analysis of the microbiome and transcriptome in the skin of a large cohort of AD patients and healthy volunteers, comparing two physiologically different sites: upper back and posterior thigh. Microbiome samples and biopsies were obtained from both lesional and nonlesional skin to identify changes related to the disease process. Transcriptome analysis revealed distinct disease-related gene expression profiles depending on anatomical location, with keratinization dominating the transcriptomic signatures in posterior thigh, and lipid metabolism in the upper back. Moreover, we show that relative abundance of Staphylococcus aureus is associated with disease severity in the posterior thigh, but not in the upper back. Our results suggest that AD may select for similar microbes in different anatomical locations-an "AD-like microbiome," but distinct microbial dynamics can still be observed when comparing posterior thigh to upper back. This study highlights the importance of considering the variability across skin sites when studying the development of skin inflammation.

Keywords: atopic dermatitis; inflammation; microbiome.


Conflict of interest statement

Dr Ottman reports grants from BIOMAP IMI2 821511, during the conduct of the study; Dr Barrientos‐Somarribas has nothing to disclose; Dr Fyhrquist has nothing to disclose; Dr Alexander has nothing to disclose; Dr Wisgrill has nothing to disclose; Dr Olah has nothing to disclose; Dr Tsoka has nothing to disclose; Dr Greco has nothing to disclose; Dr Levi‐Schaffer has nothing to disclose; Dr Soumelis has nothing to disclose; Dr Schröder has nothing to disclose; Dr Kere has nothing to disclose; Dr Nestle reports other from Sanofi, outside the submitted work; Dr Barker has nothing to disclose; Dr Ranki reports grants from EU FP7/2007‐2013, during the conduct of the study; Dr Lauerma reports grants from Orion Corporation, outside the submitted work; Dr Homey reports grants from EU‐MAARS, grants from EU‐BIOMAP, grants from DFG‐FOR2690‐HO 2092/7‐1, during the conduct of the study; grants and personal fees from Galderma, personal fees from AbbVie, personal fees from Janssen, personal fees from Sanofi/Regeneron, personal fees from Leo Pharmaceuticals, outside the submitted work; Dr Andersson has nothing to disclose; and Dr Alenius reports grants from BIOMAP IMI2 821511, during the conduct of the study.

Figures
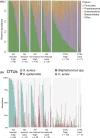
Figure 1
Figure 1
Microbial composition of the samples. A, Phyla‐level barplot, highlighting the 4 most prevalent phyla: Firmicutes, Bacteroidetes, Actinobacteria, and Proteobacteria. B, OTU‐level barplot of relative abundances, highlighting S aureus and Staphylococcus spp. which were differentially abundant between groups by ANCOM analysis. C acnes and S epidermidis are included for reference
Figure 2
Figure 2
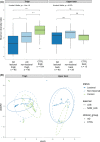
Alpha and beta diversity of skin samples. A, Shannon diversity index of lesional, nonlesional and healthy control samples divided by skin site. Significant differences between groups were found in thigh (Kruskal‐Wallis, P < .001) but not in upper back (P> .05). B, UMAP‐based ordination of the samples using Bray‐Curtis dissimilarity. Thigh and upper back samples were ordinated together; the visualization was split into two identical axes to highlight the site = specific dynamics. Other visualizations of the same ordination can be seen in Figure S5
Figure 3
Figure 3
Gene ontology‐based analysis of functional enrichment in (A) thigh nonlesional (n = 41) vs control sites (n = 99), and B, back nonlesional (n = 36) vs control sites (n = 13). Downstream effects analysis in IPA was used to visualize, via color‐coded heatmaps, putative biological and disease trends in (C) thigh nonlesional vs control sites, and (D) back nonlesional vs control sites. The color intensity of the squares in the heatmaps reflects the strength of the absolute z‐score for predictions (orange = positive, blue = negative). The size of the squares reflects the B‐H–adjusted p‐values
Figure 4
Figure 4
Ingenuity canonic pathway analysis (IPA) of differentially expressed genes between (A) lesional (n = 43) and nonlesional (n = 41) samples in thigh and B, lesional (n = 37) and nonlesional (n = 36) samples in back. Top molecular and cellular functions (IPA) between (C) thigh lesional and nonlesional samples, and (D) back lesional and nonlesional samples
Figure 5
Figure 5
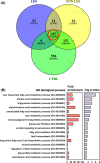
Analysis of differentially expressed genes in thigh vs back contrast. A, Venn diagram summarizing the differentially expressed genes between thigh and upper back on the different sample types: lesional AD, nonlesional AD and healthy controls. B, Gene Ontology enrichment analysis of the 117 genes differentially expressed in all three conditions
Figure 6
Figure 6
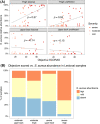
S. aureus—objective SCORAD association. A, Measure of AD severity (objective SCORAD as a measure of global AD severity) correlates (Spearman) with S aureus relative abundance in lesional (n = 45; rho = 0.57) and nonlesional (n = 45; rho = 0.53) skin from the thigh but the association is not observed in the back (n = 40). (B) Dividing samples high (>80%), mid (1% to 80%), and absent (<1%) S aureus abundance reveals that individuals with severe AD are more likely to have S aureus‐dominated thigh lesions with respect to moderate AD patients, while no difference in S aureus colonization trends for lesions is observed for upper back between severe and moderate patients
Figure 7
Figure 7
A, Heatmap of DEGs in S aureus "high" (n = 19) vs "absent" (n = 12) contrast in lesional thigh samples. B, GO analysis of functional enrichment of DEGs in S aureus "high" vs "absent" contrast in biological processes. C, Enrichment of canonical pathways in IPA analysis of DEGs in S aureus "high" vs "absent" contrast. D, Correlation of circadian regulation‐associated genes with disease severity SCORAD (n = 43)
Figure 8
Figure 8
Co‐expression networks identify response modules of posterior thigh lesional skin associated with relative abundances of S aureus and S epidermidis. Weighted gene co‐expression analysis (WGCNA) was used to determine modules associated with the relation of relative abundances of S aureus and S epidermidis. Furthermore, the leukocyte deconvolution algorithm Cibersort (CS) was applied on transcriptomics data to estimate the relative cell fractions within the affected skin to link modules toward cell fractions. Modules with a correlation coefficient > 0.5 and a P‐value < 0.001 of the phenotypic trait “Relation SA vs. SE” were further analyzed. Two modules were associated with the relation of the relative abundance of S aureus and S epidermidis: 1 positively (referred as S aureus module (SAMod)) and 1 negatively (referred as S epidermidis module (SEMod)) correlating module a). SEMod was also positively associated with estimated mast cell fraction (A). ClusterProfiler was used for GO biological processes (B) and KEGG pathway (C) enrichment

References

    1. SanMiguel A, Grice EA. Interactions between host factors and the skin microbiome. Cell Mol Life Sci. 2015;72:1499‐1515. - PMC - PubMed
    1. Blekhman R, Goodrich JK, Huang K, et al. Host genetic variation impacts microbiome composition across human body sites. Genome Biol. 2015;16:191. - PMC - PubMed
    1. Lehtimäki J, Karkman A, Laatikainen T, et al. Patterns in the skin microbiota differ in children and teenagers between rural and urban environments. Sci Rep. 2017;7:45651. - PMC - PubMed
    1. Byrd AL, Belkaid Y, Segre JA. The human skin microbiome. Nat Rev Microbiol. 2018;16:143‐155. - PubMed
    1. Oh J, Byrd AL, Park M, Program NCS, Kong HH, Segre JA. Temporal Stability of the Human Skin Microbiome. Cell 2016;165:854‐866. - PMC - PubMed

Publication types