

Nucleo-plastidic PAP8/pTAC6 couples chloroplast formation with photomorphogenesis
- PMID: 33001465
- PMCID: PMC7667882
- DOI: 10.15252/embj.2020104941
Nucleo-plastidic PAP8/pTAC6 couples chloroplast formation with photomorphogenesis
Abstract
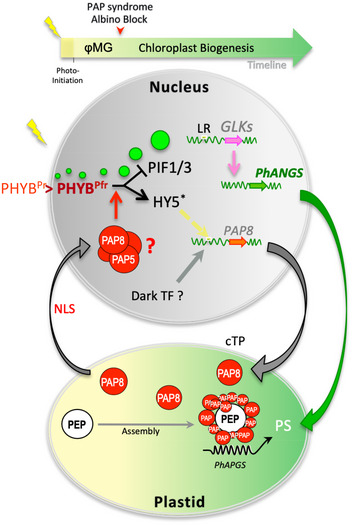
The initial greening of angiosperms involves light activation of photoreceptors that trigger photomorphogenesis, followed by the development of chloroplasts. In these semi-autonomous organelles, construction of the photosynthetic apparatus depends on the coordination of nuclear and plastid gene expression. Here, we show that the expression of PAP8, an essential subunit of the plastid-encoded RNA polymerase (PEP) in Arabidopsis thaliana, is under the control of a regulatory element recognized by the photomorphogenic factor HY5. PAP8 protein is localized and active in both plastids and the nucleus, and particularly required for the formation of late photobodies. In the pap8 albino mutant, phytochrome-mediated signalling is altered, degradation of the chloroplast development repressors PIF1/PIF3 is disrupted, HY5 is not stabilized, and the expression of the photomorphogenesis regulator GLK1 is impaired. PAP8 translocates into plastids via its targeting pre-sequence, interacts with the PEP and eventually reaches the nucleus, where it can interact with another PEP subunit pTAC12/HMR/PAP5. Since PAP8 is required for the phytochrome B-mediated signalling cascade and the reshaping of the PEP activity, it may coordinate nuclear gene expression with PEP-driven chloroplastic gene expression during chloroplast biogenesis.
Keywords: Arabidopsis PEP/PAPs; biogenesis; chloroplast; photobodies; photomorphogenesis.
© 2020 The Authors.
Conflict of interest statement
The authors declare that they have no conflict of interest.
Figures
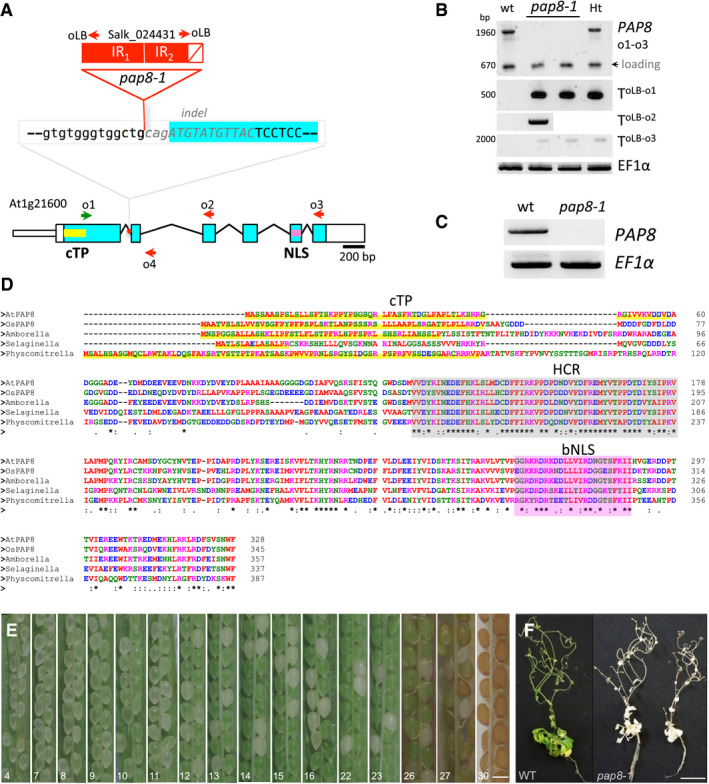
- A
Structure of the PAP8 locus, blue boxes: exons, lines: introns. Red box: inserted T‐DNA as inverted repeats (IR1/IR2) in the first intron. White box with a diagonal red line: deletion at the left border of IR2 and part of second exon (italicized grey sequence). Green and red arrows represent forward and reverse primers, respectively, as o1: oPAP8_rtp_F; o2: oPAP8_E3_R; o3: oPAP8_rtp_R; o4:op8i2_R; and oLB: oLBb1.3.
- B
PCR performed on genomic DNA with indicated primers as shown: o1: oPAP8_rtpF, o2: oPAP8_E3R, o3: oPAP8_rtpR, oLB: oLBb1.3, EF1α: ELONGATION FACTOR 1α, WT: wild type, pap8‐1: homozygous albino plant, Ht: heterozygous green plant; T: T‐DNA, arrowhead: 670‐bp contaminant amplification product used as loading control.
- C
RT–PCR on wild type and pap8‐1 homozygous plants grown in the dark for 3 days followed with 72‐h growth under white light to allow greening of the wild type; EF1α used as control.
- D
Sequence alignment of predicted full‐length orthologous PAP8 protein found in representatives of major phylogenetic clades Arabidopsis thaliana, At1g21600; Oryza sativa Indica, EEC67529.1; Amborella trichopoda, XP_006827378.1; Selaginella moellendorffii, XP_002976643.2; Physcomitrella patens, XP_024396032.1. cTP, chloroplast transit peptide as predicted with ChloroP1.1 (
www.cbs.dtu.dk ) underlined in yellow; HCR shaded in grey, highly conserved region. (*), (:) or (.), conserved, strongly similar or weakly similar amino acid properties (standards fromwww.uniprot.org ). Amino acids colours as in Clustal Omega (red (AVFPMILW): small + hydrophobic [includes aromomatic − Y]); blue (DE): acidic; magenta (RHK): basic; green (STYHCNGQ): hydroxly + sulfhydryl + amine + G.) bNLS, bipartite NLS as predicted with NLS mapper (http://nls-mapper.iab.keio.ac.jp). - E
Half‐open siliques of a heterozygous plant showing the embryo greening; scale bar equals 250 μm. The given number is the position rank of the silique from top to bottom of the inflorescence presenting the segregation of homozygous and heterozygous seeds based on their ability to transiently develop chloroplasts.
- F
Mutant Rescue: WT and two representative pap8‐1 plants were grown in vitro using sucrose and low white light intensity (of 10 μmol m−2 s−1); scale bar equals 20 mm.
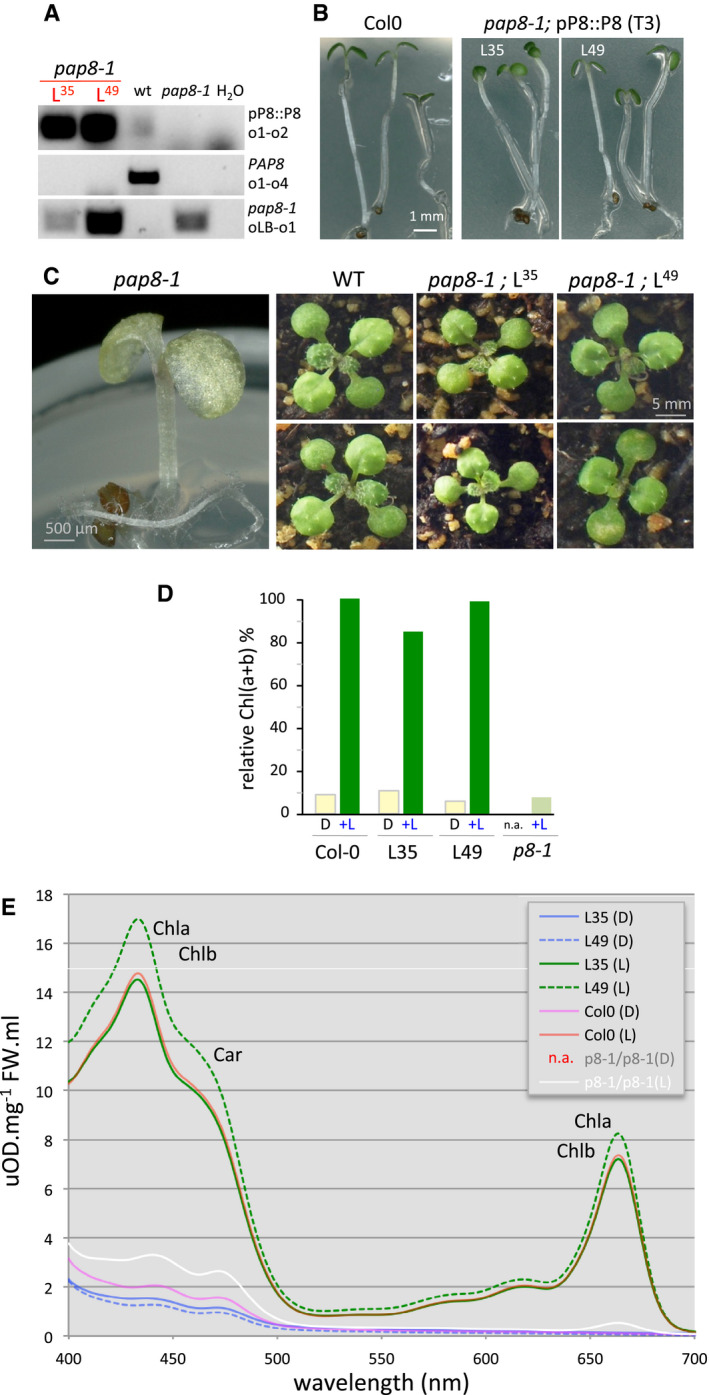
- A
PCR on genomic DNA; L35, L49: Two independent “pBB389” transgenic lines; primers are the same as in Fig 1B and o4: op8i2_R.
- B
Greening assay on wild type and rescued pap8‐1 homozygous plants from third generation transgenic lines (T3) grown in vitro 3 days in the dark followed with a 30‐h light treatment. L35 and L49 are two independent rescued lines.
- C
Phenotypes of pap8‐1 homozygous plant grown in vitro, and two representative plants of wild type or pap8‐1/pP8::PAP8 (line L35 or line L49) grown on soil.
- D
Content of total chlorophylls (Chl(a+b)) normalized to fresh weight and relative to wild type in the given genotypes grown in the dark (D) or grown in the dark followed with 30 h of white light treatment (+L); n.a. not applicable.
- E
Spectrophotometric analysis of pigments: absorption spectra of acetone‐soluble extracts from seedling grown in vitro 3 days in the dark (D) or 3 days in the dark plus 30 h of white light (L) Col‐0, wild type; p8‐1/p8-1, homozygous mutant pap8‐1; L35 and L49, two lines of pap8‐1/pPAP8::PAP8; n.a., not applicable. Absorbance was normalized to fresh weight (FW); Chla, chlorophyll a; Chlb, chlorophyll b; Car, carotenoids.
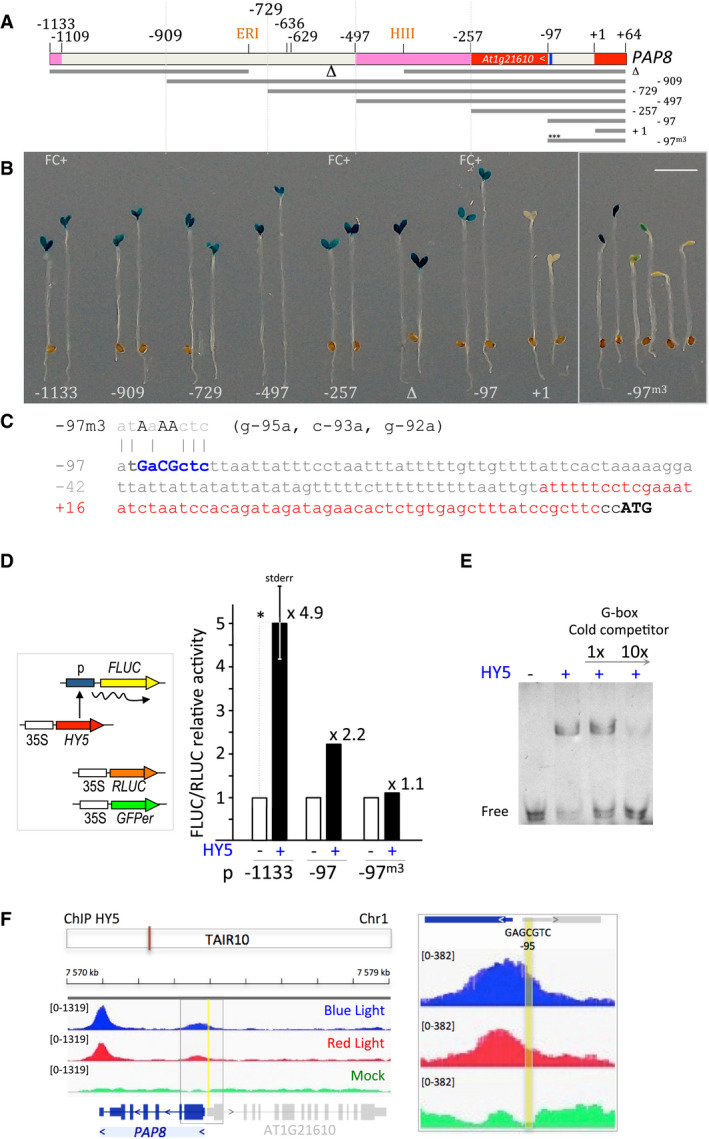
- A
PAP8 promoter deletion strategy. ERI, EcoRI site; HIII, HindIII site; indicated positions are given relative to the transcription start noted as +1; red boxes represent untranslated regions; pink boxes, ORF of an upstream gene; nearly palindromic element is given in blue. −97m3: mutated promoter as described in C with three mutations (m3) indicated with “***”.
- B
Two or six (−97m3) representative primary transformants expressing GUS under the given PAP8 promoter version; FC+, the corresponding promoters were tested positive in functional complementation of the mutant pap8‐1. Scale bar equals 3 mm.
- C
Proximal PAP8 promoter region; m3, 3‐bp substitutions within the −97‐bp promoter; 5′‐UTR in red; ATG, start codon of PAP8.
- D
Dual‐luciferase reporter assay; Renilla luciferase (Rluc) used as internal control and GFPer used as control for the transfected area; the promoters driving Firefly luciferase (Fluc) were transfected in onion epidermis cells without or with constitutively expressed HY5. The Fluc/Rluc activity was set to 1 for the minus‐HY5 control; mean ± standard error corresponding to 3 replicates; photon counts are given in source data. *ε‐test = 3.43 > 1.96 corresponding to P‐value < 0.001.
- E
Electromobility shift assay of a probe corresponding to the near palindromic PAP8 element (GAcGCTC) with recombinant HY5 protein; a probe containing a canonical G‐box element (CACGTG) recognized by HY5 was used as cold competitor.
- F
Integrative genomics viewer (IGV) images of the chromatin immunoprecipitation (ChIP) sequencing data30 at the PAP8 locus; TAIR10, annotation according to the Arabidopsis thaliana information resource orange box indicates the PAP8 locus. ChIP on hy5‐ks50; 35S:HY5‐YFP exposed to blue light or red light using GFP antibody and compared with mock corresponding to ChIP control experiment done without antibody. Each treatment is presented as track overlay of triplicates: the read count is given within the “group autoscale” range in brackets. Close up on the 5′‐UTR region centred on the −95‐promoter element in yellow.
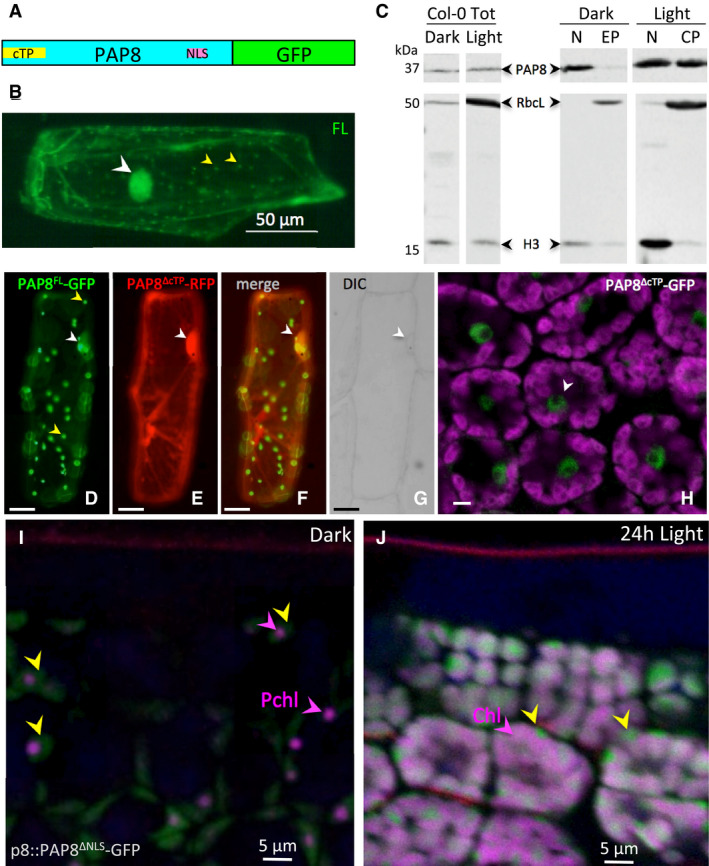
- A
Schematic illustration of domain structure of Arabidopsis PAP8 fused to GFP. cTP, chloroplast transit peptide; NLS, nuclear localization signal.
- B
Transiently expressed PAP8FL‐GFP (full‐length coding sequence of PAP8 fused to GFP) in onion epidermal cells displays a dual localization in the nucleus (white arrowhead) and in plastids (yellow arrowheads).
- C
Immuno‐blots for the detection of PAP8 in total protein extracts (Col‐0 Tot) the nuclear fraction (N) and the plastidic fractions (EP, etioplast; CP, chloroplast) of etiolated (dark) or photomorphogenic (light) Arabidopsis seedlings by immuno‐Western blotting using a PAP8 antiserum (PAP8). As control, a mixture of antisera raised against histone 3 (H3) and the large subunit of ribulose 1, 5‐bisphosphate carboxylase/oxygenase (RbcL) was used to evaluate reciprocal contaminations. The lanes are extracted from the same blot.
- D–G
Co‐expression analysis of PAP8FL‐GFP (D) with PAP8ΔcTP‐RFP (E) in onion epidermal cells; (F) green and red channels merged; yellow arrowheads show plastids; white arrowheads show nuclei as observed with DIC, differential interference contrast in (G); FL, PAP8 full‐length ORF; ΔcTP, deletion of the cTP; scale bars equal 20 μm.
- H
Confocal imaging on Arabidopsis cotyledons expressing PAP8ΔcTP‐GFP, details of a few palisade cells (see Appendix Fig S7B for a view in a cross section between the two cotyledons); magenta, auto‐fluorescence of the chloroplast; the white arrowhead shows a nucleus; scale bar equals 5 μm.
- I, J
Confocal imaging on Arabidopsis cotyledons stably expressing pP8::PAP8ΔNLS‐GFP; ΔNLS, deletion of the NLS (I) during skotomorphogenesis and (J) after 24‐h light; yellow arrowheads show the GFP signal; the picture is a merge of different channels: GFP in green, Pchl,: protochlorophyllide or Chl: chlorophyll in magenta marked with arrowheads, and propidium iodide, showing the waxy cuticle in red, the empty space correspond to the layer of highly vacuolated epidermal cells.
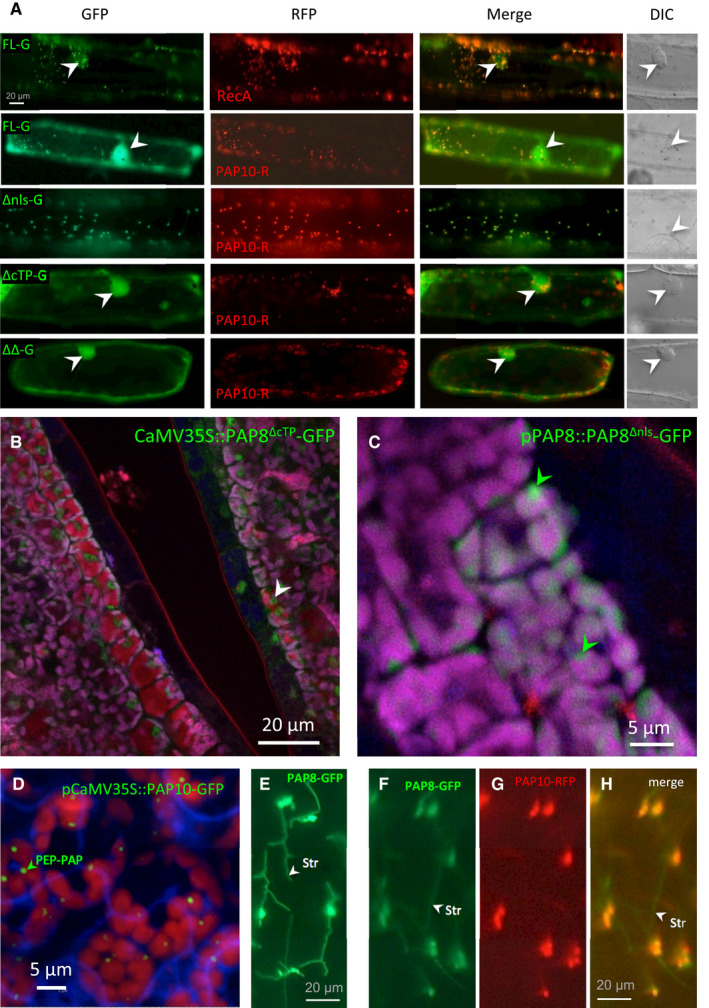
- A
Transient assay in onion epidermal cells, pictures are given at the same scale. FL, full‐length ORF; −G, translational fusion with GFP; ΔNLS, deletion of the NLS; ΔcTP, deletion of the cTP, ΔΔ, deletion of both the NLS and the cTP. Onion cell co‐transfected with the corresponding variant fused to GFP and a plastid control fused to RFP (PAP10, PAP10‐RFP or RecA, RecA‐RFP) Merge, merged channels; DIC, differential interference contrast microscopy pictures to reveal the position of the nucleus within the cell when fluorescent nuclei were observed (marked with white arrowheads).
- B, C
Confocal imaging of stably expressed CaMV35S::PAP8∆cTP‐GFP (B) or pPAP8::PAP8∆nls‐GFP (C) in cotyledons of Arabidopsis thaliana; white arrowheads indicate nuclei; green arrowheads indicate sub‐plastidial localization. Observations similar to (C) were recorded for pPAP8::PAP8FL‐GFP.
- D
Confocal imaging of stably expressed CaMV35S::PAP10‐GFP in cotyledons of Arabidopsis thaliana showing the PEP‐PAP complex; the green arrowhead indicates the putative location of PEP‐PAP complexes within one chloroplast.
- E–H
PAP8‐GFP in stromules of onion epidermal cells expressed alone (E) or in co‐localization with PAP10‐GFP (F–H); stromules (str, white arrowheads) are only marked by PAP8‐GFP.
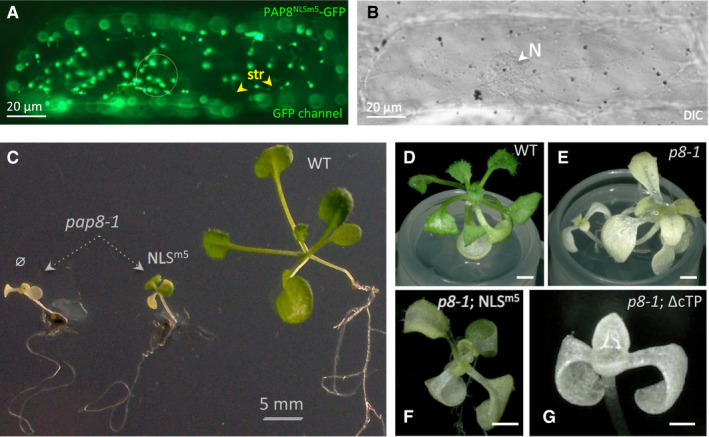
- A, B
(A) Transient expression of PAP8NLSm5‐GFP mutated in the NLS as described in Fig EV4A. The circle marks the position of the nucleus (N) as observed with DIC in (B); yellow arrowheads show stromules (str). Scale bars equal 20 μm.
- C–G
Pictures of representative genotypes obtained in the functional complementation test of pap8‐1 using pP8::PAP8‐NLSm5 (C, F) or pP8::PAP8ΔcTP (G) both constructions without GFP tags; ø indicates pap8‐1 without any PAP8 transgene. (D–G) Pictures using Keyence technology of plants with genotypes as labelled; transgenes expressed using the 1.1‐kb PAP8 promoter. Scale bars equal 1 mm.
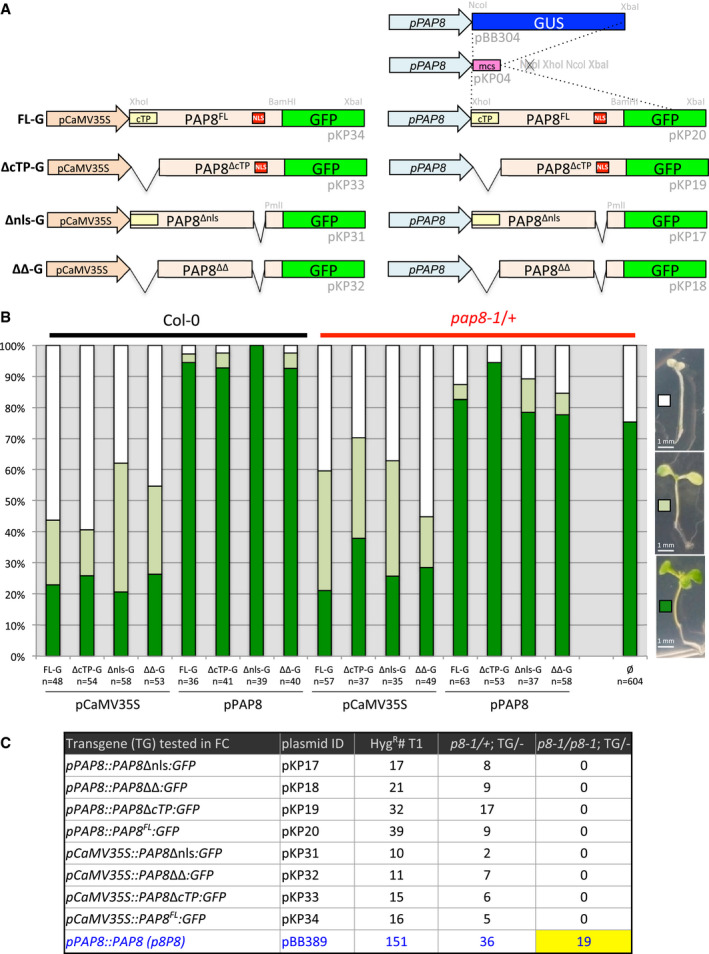
- A
Schematic illustration of the GFP‐fused PAP8 variants used for sub‐cellular localization and functional complementation tests FL‐G, PAP8 full‐length ORF translationally fused to GFP; Δnls‐G, deletion of the NLS (nuclear localization signal), ORF fused to GFP; ΔcTP‐G, deletion of the cTP (chloroplastic transit peptide), ORF fused to GFP; ΔΔ‐G combined deletion of NLS and cTP in the ORF fused to GFP. The variants are expressed under the control of the CaMV35S promoter or under the native PAP8‐1.1-kb promoter. Plasmid identification and relevant restriction sites for cloning are given in light grey (see Appendix Table S1); mcs, multiple cloning site.
- B
Transgenic lines obtained with the constructions described above. Three phenotypic classes have been recorded corresponding to albino (white squares), pale green (light green squares) and green plants (green squares). Col‐0, wild type; pap8‐1/+, heterozygous mixture; n, total number of recorded plants; ø, no transgene.
- C
Functional complementation output. Hygromycin‐resistant plants were transferred on soil and grown under long‐day conditions (16‐h light/8-h dark; ˜ 70 μmol m−2 s−1) at 21°C and 60% humidity. Genomic DNA was isolated from true leaves and used for genotyping. The presence of the pap8‐1 allele was confirmed using the primer ortpF/oLBb1.3. PAP8 wild‐type allele tested with ortpF/op8i2_R. The insertion of the transgene of interest was tested with oPAP8_rtp_F/oE3_R. The number of the tested plants (HygR#T1), the number of double heterozygous plants (p8‐1/+; TG/−) and the number of sesqui‐mutant plants (p8‐1/p8-1; TG/−) are depicted for each construction; p8P8 presented as positive control. None of the 39 T1 plants with pP8::PAP8‐GFP were photosynthetic and homozygous pap8‐1. Therefore, two doubly heterozygous (pap8‐1/+; TG/−) expressing GFP were tested for their segregation pattern (Line 1: 34% albino, n = 169, and Line 2: 24% albino, n = 199) and compared to that of pap8‐1/+ (28% albinos, n = 99). In the absence of statistical difference between the samples (ε = 0.102≪1.96 for α = 0.05; ε‐test, Fisher Yates), PAP8‐GFP was declared not functional as opposed to PAP8.
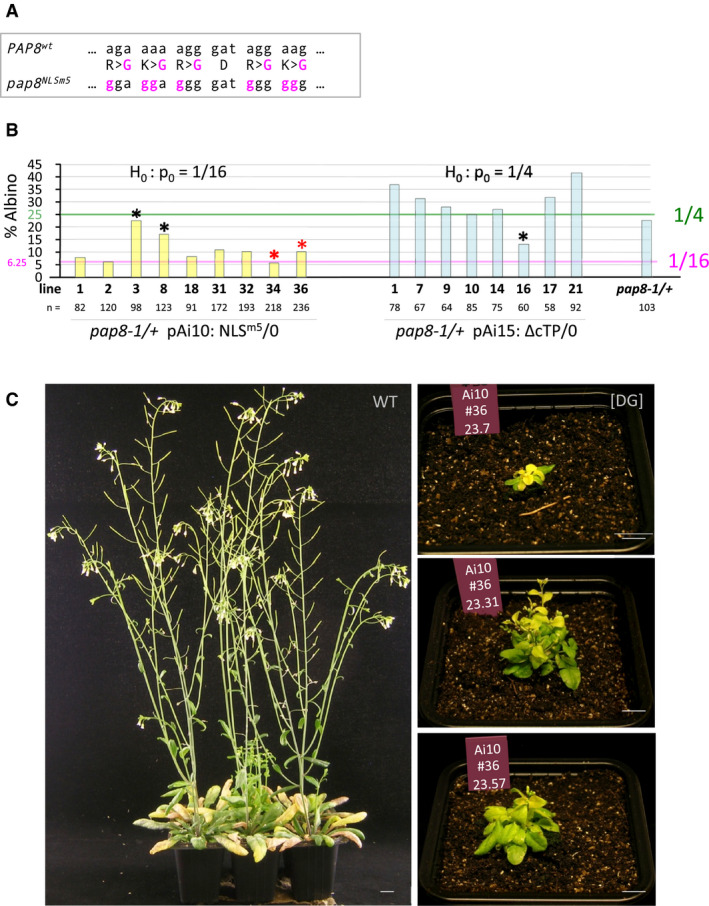
- A
Genetic alterations of the pap8 NLSm5 allele. Altered codons and corresponding changes in amino acids (central line) are in magenta; the sign “>” indicates aa replacement at the same position.
- B
Bar graph representing the albino segregation ratios in doubly heterozygous transgenic lines (pap8-1/+; TG/−) obtained with pPAP8::PAP8NLSm5 (NLSm5: pAi10) and pPAP8::PAP8∆cTP (∆cTP: pAi15). pap8‐1/+ used as control; n, total number of recorded plants. Segregation pattern were tested using ε‐test with null hypothesis set to p0 = 1/16 (greening complementation) for NLSm5 and p0 = 1/4 (no complementation) for ∆cTP (see data source); black *, outliers correspond to the samples that did not pass the statistical test; red * indicate chosen genotypes for follow‐up studies.
- C
Phenotype of pap8‐1 transformed with pPAP8::PAP8NLSm5. WT, 5‐week-old Col‐0 control; [DG], delayed greening phenotype observed for the partial rescue of pap8‐1 mutant expressing PAP8NLSm5 under its endogenous promoter; pictures depict three 15‐week-old plants in which the alteration of the greening corresponds to the emergence of white leaves that slowly acquire the photosynthetic apparatus; plants #7, #31 and #57 are siblings of the same genotype (Ai10#34). Scale bars equal 10 mm.
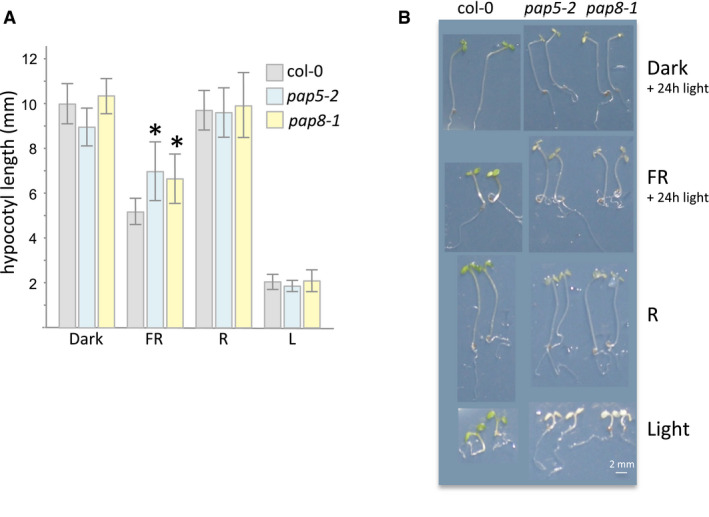
- A
Hypocotyl length measurements, given as mean ± SD, of genotypes grown under different light sources. Individual measurements and sample sizes are given in source data. Dark, true dark treatment; FR, far‐red light (low fluence approx. 10 μmol m−2 s−1; peak at 730 nm ± 10 nm); R, red light (8 μmol m−2 s−1 peak at 660 nm ± 10 nm); L, white light 30 μmol m−2 s−1. Whereas pap5‐2 and pap8‐1 are statistically undistinguishable using δ‐test for the comparison of the mean (Fisher Yates δ = 0.791 ≪ Uα = 0.05 = 1.96, not significant at α set to 0.05), both pap5‐2 and pap8‐1 show significant hypocotyl differences compared with wild type (δ = 5.374; δ = 5.061 respectively so that both *P‐values < 10−6).
- B
Images of representative seedlings.
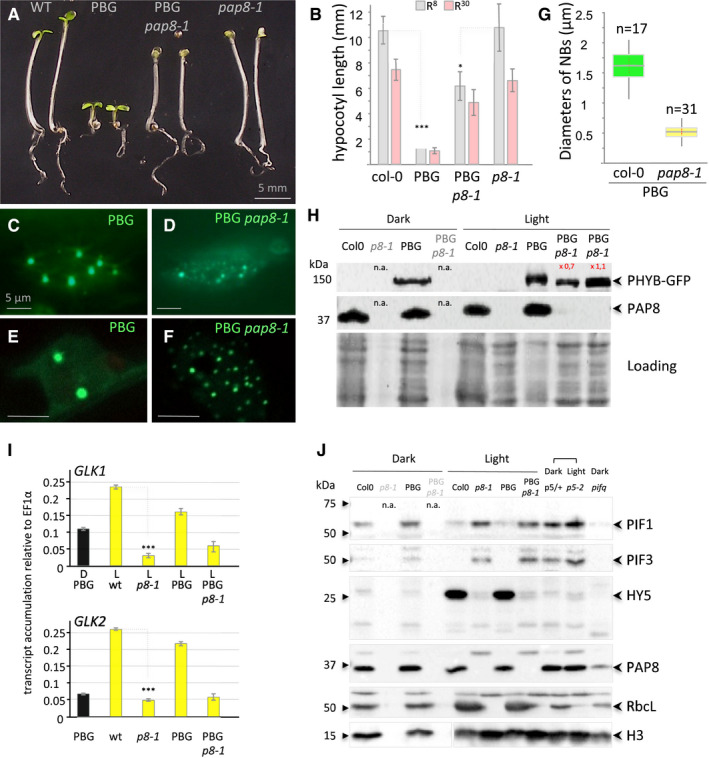
- A
Phenotypes of given genotypes subjected to 5 days of illumination at 8 μmol m−2 s−1 660‐nm red light. PBG, pCaMV35S::PHYB‐GFP transformed in pap8‐1/+ (among 25 lines selected for GFP expression see data source; 2 doubly heterozygous pap8‐1/+; PBG/− lines #6 and #7 segregated the photobodies alteration with the albinism).
- B
Hypocotyl length, given as the mean ± SD, of plants grown as in (A) (R8, grey bars) or at 30 μmol m−2 s−1 660‐nm red light (R30, pink bars) showing partial insensitivity of pap8‐1 to the PBG overexpression. Measurements are given in source data; in the order of the graph n equals (50, 133, 58, 43, 36, 112, 25, 60) δ‐test (comparison of the mean) R8: δPBG/PBGp8‐1 = 20.38 corresponding to P‐value < 10−31 δwt/p8-1 = 0.5 < 1.96 not significant at α set to 0.05).
- C–G
Nuclear accumulation of PBG observed under GFP excitation in the given genotypes. (C, D) Epi‐fluorescence microscopy. (E, F) Confocal microscopy showing the size of the nuclear bodies. Scale bars equal 5 μm. (G) Box plot (Min, 1st quartile, median as the central band, 3rd quartile, max) on the diameter of the nuclear bodies (NBs); n equals the number of records.
- H
Immuno‐blots using a GFP antibody or a PAP8 antibody showing, respectively, the levels of PHYB‐GFP and PAP8 in the given genotypes grown in the dark for 3 days or in light; n.a., not applicable as the pap8‐1 mutant can only be visually distinguished from wild type after light exposure; 2 lines (L#06 and L#07) for PBG/pap8‐1 were tested. Coomassie blue staining presented as loading; signals were quantified using ImageJ.
- I
RT–qPCR analysis on wild type, pap8‐1, PBG and PBG pap8‐1. Seedlings were grown in the dark (D) or under white light (L, 30 μmol m−2 s−1); levels of transcripts are given relative to EF1α; error bars correspond to standard errors on technical triplicates, and the dark sample is the wild‐type PBG line. δ‐test (comparison of the mean) ***P < 10−72.
- J
Immuno‐blots showing the levels of PIF1, PIF3 and HY5 in given genotypes grown in the Dark or light condition as noted: p5/+, mix of an heterozygous pap5‐2 siblings progeny undistinguishable from wild type; p5‐2, pap5‐2 and pifq, quadruple pif1‐1 pif3‐3 pif4‐2 pif5‐3 mutant; histone H3 (H3), RbcL and PAP8 were used as controls; n.a., not applicable.
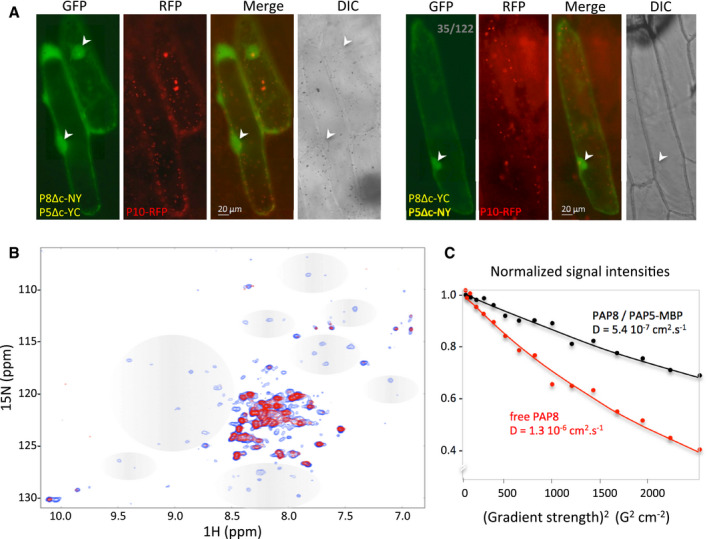
- A
Bimolecular fluorescence complementation tests using in combination PAP8ΔcTP‐NY (P8Δc‐NY) with PAP5ΔcTP‐YC (P5Δc‐YC) or PAP8ΔcTP‐YC (P8Δc‐YC) with PAP5ΔcTP‐NY (P5Δc‐NY); PAP10‐RFP (P10‐RFP) was used as internal positive control for transfection; the ratio in grey depicts the number of green‐fluorescent cells over red‐fluorescent cells. Arrowheads indicate nuclei. See Appendix Fig S6 for control experiments; transgenes expressed under CaMV35S promoter.
- B
Overlay of 1H‐15N correlation 2D NMR spectra of free 15N‐labelled PAP8 alone (blue) or in complex with PAP5 (red). Grey areas depict changes in signals in the PAP8 spectrum.
- C
15N‐Filtered diffusion ordered spectroscopy‐NMR measurements to PAP8. Exponential decay curves of PAP8 in the absence or in the presence of MBP‐PAP5 are shown in red and black, respectively. The units on the y‐axis are normalized values of the integrals of the signal measured in the amide proton region.
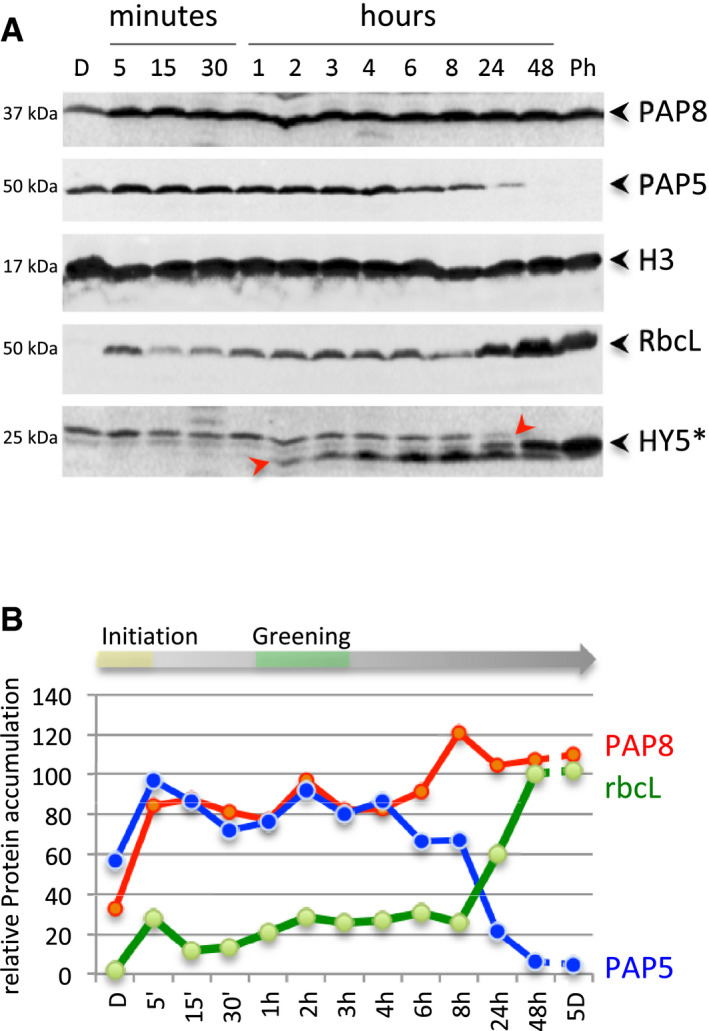
- A
Immuno‐blots showing the levels of PAP8, PAP5, histone H3 (H3), Rubisco (RbcL) and HY5; D, dark; Ph, photomorphogenic growth conditions from germination on. *, HY5 is detected as a modified form (+6 kDa); the arrows indicate the two different post‐translational modified forms of HY5 for which accumulation occurs upon light exposure.
- B
Relative protein contents normalized to histone H3 during the transition from skotomorphogenesis to photomorphogenesis, we propose a phase of photo‐initiation corresponding to the 5 min of light allowing PAP8 and PAP5 to rise to nearly 100% of their maximum. The first macroscopic signs of greening are indicated around 3 h, while the photosynthetic apparatus bursts at 8 h to be fully accumulated at 48 h.
References
-
- Al‐Sady B, Ni W, Kircher S, Schafer E, Quail PH (2006) Photoactivated phytochrome induces rapid PIF3 phosphorylation prior to proteasome‐mediated degradation. Mol Cell 23: 439–446 - PubMed
-
- Arsova B, Hoja U, Wimmelbacher M, Greiner E, Ustun S, Melzer M, Petersen K, Lein W, Bornke F (2010) Plastidial thioredoxin z interacts with two fructokinase‐like proteins in a thiol‐dependent manner: evidence for an essential role in chloroplast development in Arabidopsis and Nicotiana benthamiana. Plant Cell 22: 1498–1515 - PMC - PubMed
Publication types
MeSH terms
Substances
Grants and funding
LinkOut - more resources
Full Text Sources
Other Literature Sources
Molecular Biology Databases
Miscellaneous
