Review
. 2020 Oct;40(6):1574-1599.
doi: 10.1148/rg.2020200149.

Multisystem Imaging Manifestations of COVID-19, Part 1: Viral Pathogenesis and Pulmonary and Vascular System Complications

Affiliations
Review

Multisystem Imaging Manifestations of COVID-19, Part 1: Viral Pathogenesis and Pulmonary and Vascular System Complications

Margarita V Revzin et al. Radiographics. 2020 Oct.

Abstract

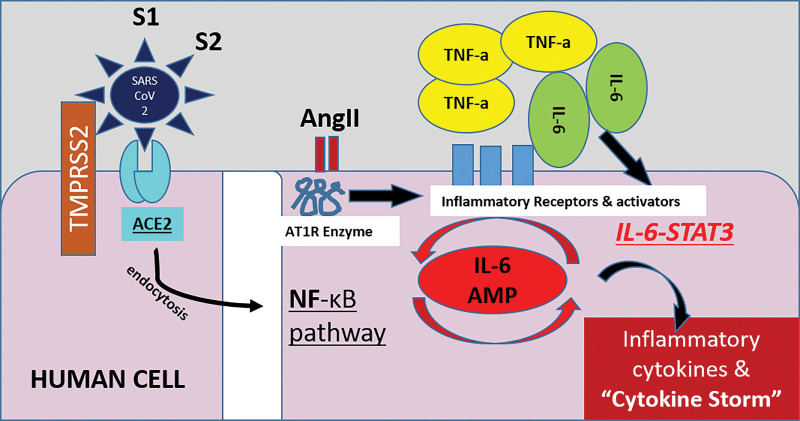
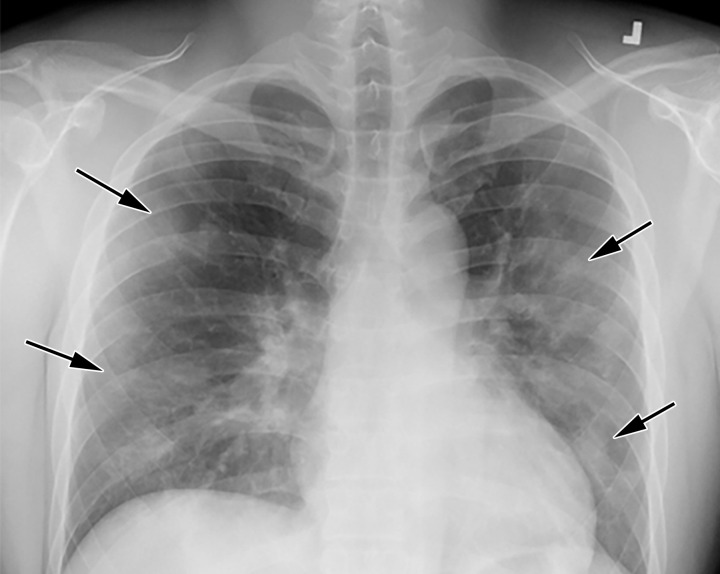
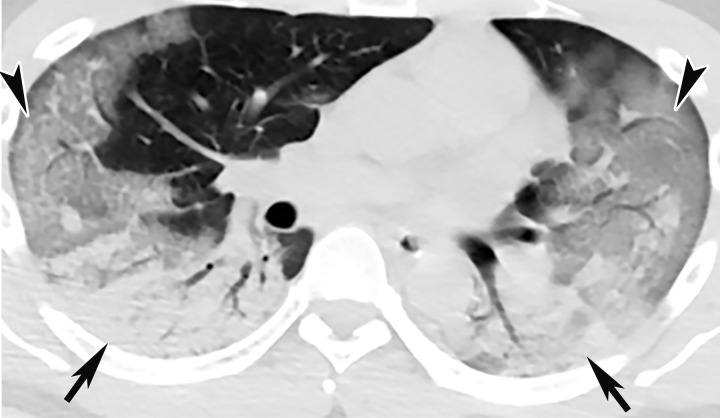
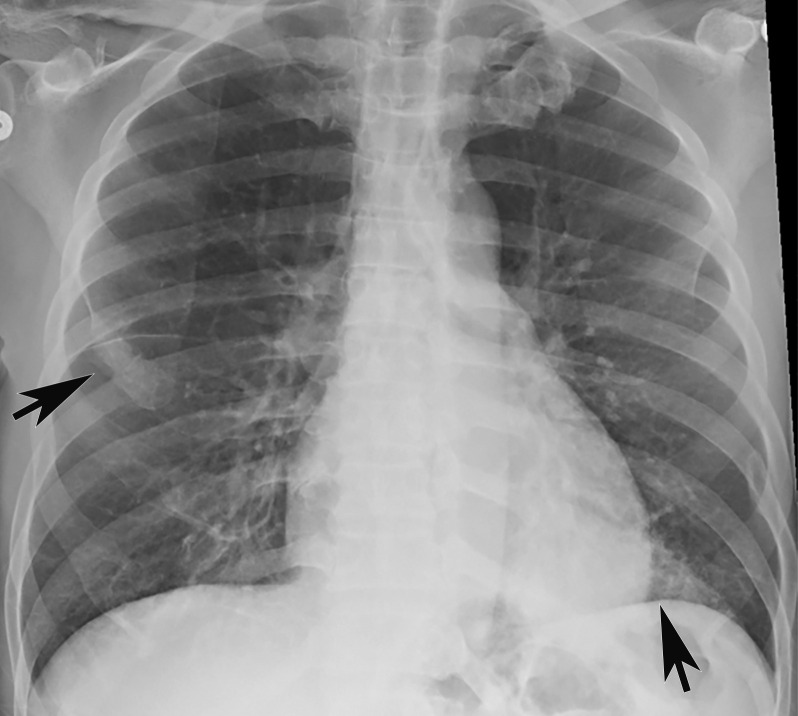
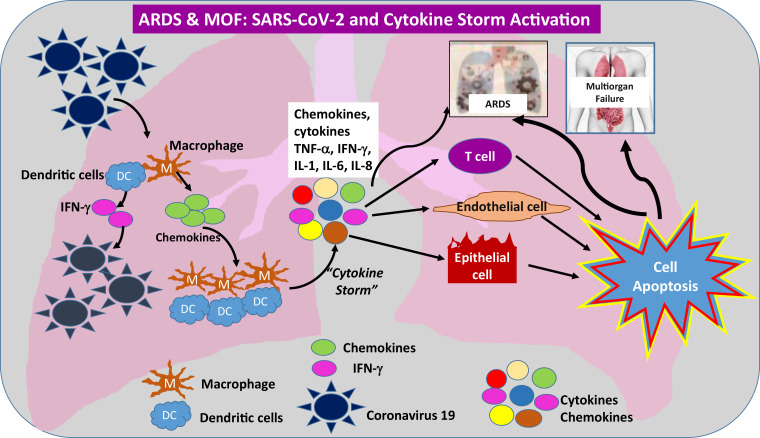
Infection with severe acute respiratory syndrome coronavirus 2 (SARS-CoV-2) results in coronavirus disease 2019 (COVID-19), which was declared an official pandemic by the World Health Organization on March 11, 2020. The infection has been reported in most countries around the world. As of August 2020, there have been over 21 million cases of COVID-19 reported worldwide, with over 800 000 COVID-19-associated deaths. It has become apparent that although COVID-19 predominantly affects the respiratory system, many other organ systems can also be involved. Imaging plays an essential role in the diagnosis of all manifestations of the disease, as well as its related complications, and proper utilization and interpretation of imaging examinations is crucial. With the growing global COVID-19 outbreak, a comprehensive understanding of the diagnostic imaging hallmarks, imaging features, multisystemic involvement, and evolution of imaging findings is essential for effective patient management and treatment. To date, only a few articles have been published that comprehensively describe the multisystemic imaging manifestations of COVID-19. The authors provide an inclusive system-by-system image-based review of this life-threatening and rapidly spreading infection. In part 1 of this article, the authors discuss general aspects of the disease, with an emphasis on virology, the pathophysiology of the virus, and clinical presentation of the disease. The key imaging features of the varied pathologic manifestations of this infection that involve the pulmonary and peripheral and central vascular systems are also described. Part 2 will focus on key imaging features of COVID-19 that involve the cardiac, neurologic, abdominal, dermatologic and ocular, and musculoskeletal systems, as well as pediatric and pregnancy-related manifestations of the virus. Vascular complications pertinent to each system will be also be discussed in part 2. Online supplemental material is available for this article. ©RSNA, 2020.


Figures

Illustration shows the proposed mechanism of SARS-CoV-2 cell entry and activation of the immune system. SARS-CoV-2 enters human cells by attaching to a cell surface receptor (ACE2) and by utilizing a human enzyme called transmembrane serine protease 2 (TMPRSS2). Once bound to the receptor, SARS-CoV-2 undergoes endocytosis and enters into the cell, along with the ACE2 receptor. This process reduces the number of ACE2 receptors on cells, leading to an increase of angiotensin II (AngII) levels in the blood. Angiotensin II triggers an inflammatory pathway involving NF-κB and interleukin 6–signal transducer and activator of transcription 3 protein (IL-6-STAT3), particularly in nonimmune cells including endothelial and epithelial cells. This pathway forms a positive feedback cycle, named IL-6 amplifier (IL-6 AMP), resulting in its excessive activation and therefore the cytokine storm and ARDS. Part of this pathway involving NF-κB, IL-6-STAT3, or both is enhanced with age, which could be the reason why older patients are more at risk for death following COVID-19 diagnosis compared with other age groups. S1 = viral spike protein subunit 1, S2 = viral spike protein subunit 2,TNF-a = tumor necrosis factor-α.
Figure 1.
Illustration shows the proposed mechanism of SARS-CoV-2 cell entry and activation of the immune system. SARS-CoV-2 enters human cells by attaching to a cell surface receptor (ACE2) and by utilizing a human enzyme called transmembrane serine protease 2 (TMPRSS2). Once bound to the receptor, SARS-CoV-2 undergoes endocytosis and enters into the cell, along with the ACE2 receptor. This process reduces the number of ACE2 receptors on cells, leading to an increase of angiotensin II (AngII) levels in the blood. Angiotensin II triggers an inflammatory pathway involving NF-κB and interleukin 6–signal transducer and activator of transcription 3 protein (IL-6-STAT3), particularly in nonimmune cells including endothelial and epithelial cells. This pathway forms a positive feedback cycle, named IL-6 amplifier (IL-6 AMP), resulting in its excessive activation and therefore the cytokine storm and ARDS. Part of this pathway involving NF-κB, IL-6-STAT3, or both is enhanced with age, which could be the reason why older patients are more at risk for death following COVID-19 diagnosis compared with other age groups. S1 = viral spike protein subunit 1, S2 = viral spike protein subunit 2,TNF-a = tumor necrosis factor-α.
COVID-19 progression over 4 days in a 28-year-old man. (a) Posteroranterior chest radiograph shows bilateral multiple peripheral and lower lobe GGOs (arrows). (b) Axial non–contrast material–enhanced CT image obtained 4 days later shows progression of the typical appearance of COVID pneumonia, manifesting with bilateral GGOs (arrowheads), peripheral on the right and diffuse on the left. In addition, there is rapid worsening of the lung pneumonia, with development of bilateral lower lobe airspace consolidations (arrows).
Figure 2a.
COVID-19 progression over 4 days in a 28-year-old man. (a) Posteroranterior chest radiograph shows bilateral multiple peripheral and lower lobe GGOs (arrows). (b) Axial non–contrast material–enhanced CT image obtained 4 days later shows progression of the typical appearance of COVID pneumonia, manifesting with bilateral GGOs (arrowheads), peripheral on the right and diffuse on the left. In addition, there is rapid worsening of the lung pneumonia, with development of bilateral lower lobe airspace consolidations (arrows).
Figure 2b.
COVID-19 progression over 4 days in a 28-year-old man. (a) Posteroranterior chest radiograph shows bilateral multiple peripheral and lower lobe GGOs (arrows). (b) Axial non–contrast material–enhanced CT image obtained 4 days later shows progression of the typical appearance of COVID pneumonia, manifesting with bilateral GGOs (arrowheads), peripheral on the right and diffuse on the left. In addition, there is rapid worsening of the lung pneumonia, with development of bilateral lower lobe airspace consolidations (arrows).
Longitudinal assessment of COVID-19 pneumonia progression in a 56-year-old man who presented to the emergency department with dyspnea and dry cough. (a) AP chest radiograph obtained at hospital admission at the time of symptom onset shows bilateral pulmonary opacities (arrows) at the periphery of the right mid lung and at the left lung base. (b) AP chest radiograph obtained on day 8 of hospitalization shows progression of multifocal opacities bilaterally, which now involve more than two lobes, and interval development of bibasilar consolidations. These findings correspond to a higher severity score and carry a worse prognosis. In addition, there is mild pulmonary edema, suggestive of fluid overload. Note that the patient had undergone intubation. (c) AP chest radiograph obtained on day 14 of hospitalization shows progression of the multifocal bilateral peripheral opacities.
Figure 3a.
Longitudinal assessment of COVID-19 pneumonia progression in a 56-year-old man who presented to the emergency department with dyspnea and dry cough. (a) AP chest radiograph obtained at hospital admission at the time of symptom onset shows bilateral pulmonary opacities (arrows) at the periphery of the right mid lung and at the left lung base. (b) AP chest radiograph obtained on day 8 of hospitalization shows progression of multifocal opacities bilaterally, which now involve more than two lobes, and interval development of bibasilar consolidations. These findings correspond to a higher severity score and carry a worse prognosis. In addition, there is mild pulmonary edema, suggestive of fluid overload. Note that the patient had undergone intubation. (c) AP chest radiograph obtained on day 14 of hospitalization shows progression of the multifocal bilateral peripheral opacities.
Figure 3b.
Longitudinal assessment of COVID-19 pneumonia progression in a 56-year-old man who presented to the emergency department with dyspnea and dry cough. (a) AP chest radiograph obtained at hospital admission at the time of symptom onset shows bilateral pulmonary opacities (arrows) at the periphery of the right mid lung and at the left lung base. (b) AP chest radiograph obtained on day 8 of hospitalization shows progression of multifocal opacities bilaterally, which now involve more than two lobes, and interval development of bibasilar consolidations. These findings correspond to a higher severity score and carry a worse prognosis. In addition, there is mild pulmonary edema, suggestive of fluid overload. Note that the patient had undergone intubation. (c) AP chest radiograph obtained on day 14 of hospitalization shows progression of the multifocal bilateral peripheral opacities.
Figure 3c.
Longitudinal assessment of COVID-19 pneumonia progression in a 56-year-old man who presented to the emergency department with dyspnea and dry cough. (a) AP chest radiograph obtained at hospital admission at the time of symptom onset shows bilateral pulmonary opacities (arrows) at the periphery of the right mid lung and at the left lung base. (b) AP chest radiograph obtained on day 8 of hospitalization shows progression of multifocal opacities bilaterally, which now involve more than two lobes, and interval development of bibasilar consolidations. These findings correspond to a higher severity score and carry a worse prognosis. In addition, there is mild pulmonary edema, suggestive of fluid overload. Note that the patient had undergone intubation. (c) AP chest radiograph obtained on day 14 of hospitalization shows progression of the multifocal bilateral peripheral opacities.
Interstitial edema and pleural thickening in a 40-year-old man with COVID-19 who presented to the emergency department with hypoxia and dyspnea. (a) Gray-scale lung US image obtained in the longitudinal plane over the left lower lobe shows multiple (more than three) vertical echogenic bands (white arrows) extending from the pleural surface to the deeper portions of the lung, consistent with B-line artifacts, indicating subpleural interstitial edema. Note that the lung pleura is thickened and irregular (black arrow). (b) Corresponding AP chest radiograph shows multifocal bilateral patchy peripheral opacities (black arrows), with an area of consolidation (white arrow) in the left lower lobe with air bronchograms, which is indicative of organizing pneumonia.
Figure 4a.
Interstitial edema and pleural thickening in a 40-year-old man with COVID-19 who presented to the emergency department with hypoxia and dyspnea. (a) Gray-scale lung US image obtained in the longitudinal plane over the left lower lobe shows multiple (more than three) vertical echogenic bands (white arrows) extending from the pleural surface to the deeper portions of the lung, consistent with B-line artifacts, indicating subpleural interstitial edema. Note that the lung pleura is thickened and irregular (black arrow). (b) Corresponding AP chest radiograph shows multifocal bilateral patchy peripheral opacities (black arrows), with an area of consolidation (white arrow) in the left lower lobe with air bronchograms, which is indicative of organizing pneumonia.
Figure 4b.
Interstitial edema and pleural thickening in a 40-year-old man with COVID-19 who presented to the emergency department with hypoxia and dyspnea. (a) Gray-scale lung US image obtained in the longitudinal plane over the left lower lobe shows multiple (more than three) vertical echogenic bands (white arrows) extending from the pleural surface to the deeper portions of the lung, consistent with B-line artifacts, indicating subpleural interstitial edema. Note that the lung pleura is thickened and irregular (black arrow). (b) Corresponding AP chest radiograph shows multifocal bilateral patchy peripheral opacities (black arrows), with an area of consolidation (white arrow) in the left lower lobe with air bronchograms, which is indicative of organizing pneumonia.
Temporal pulmonary changes of COVID-19 pneumonia at CT in a 36-year-old woman. (a–c) Axial contrast-enhanced CT images obtained at hospital admission show patchy bilateral GGOs and interlobular septal thickening (black arrows), with lower lobe predominance and subpleural involvement. Note also some immediate subpleural sparing of the GGOs (white arrows in b and c). (d–f) Follow-up corresponding axial contrast-enhanced CT images show evolving consolidative changes with volume loss, architectural distortion (ovals), and bronchiectasis (arrows in e and f).
Figure 5a.
Temporal pulmonary changes of COVID-19 pneumonia at CT in a 36-year-old woman. (a–c) Axial contrast-enhanced CT images obtained at hospital admission show patchy bilateral GGOs and interlobular septal thickening (black arrows), with lower lobe predominance and subpleural involvement. Note also some immediate subpleural sparing of the GGOs (white arrows in b and c). (d–f) Follow-up corresponding axial contrast-enhanced CT images show evolving consolidative changes with volume loss, architectural distortion (ovals), and bronchiectasis (arrows in e and f).
Figure 5b.
Temporal pulmonary changes of COVID-19 pneumonia at CT in a 36-year-old woman. (a–c) Axial contrast-enhanced CT images obtained at hospital admission show patchy bilateral GGOs and interlobular septal thickening (black arrows), with lower lobe predominance and subpleural involvement. Note also some immediate subpleural sparing of the GGOs (white arrows in b and c). (d–f) Follow-up corresponding axial contrast-enhanced CT images show evolving consolidative changes with volume loss, architectural distortion (ovals), and bronchiectasis (arrows in e and f).
Figure 5c.
Temporal pulmonary changes of COVID-19 pneumonia at CT in a 36-year-old woman. (a–c) Axial contrast-enhanced CT images obtained at hospital admission show patchy bilateral GGOs and interlobular septal thickening (black arrows), with lower lobe predominance and subpleural involvement. Note also some immediate subpleural sparing of the GGOs (white arrows in b and c). (d–f) Follow-up corresponding axial contrast-enhanced CT images show evolving consolidative changes with volume loss, architectural distortion (ovals), and bronchiectasis (arrows in e and f).
Figure 5d.
Temporal pulmonary changes of COVID-19 pneumonia at CT in a 36-year-old woman. (a–c) Axial contrast-enhanced CT images obtained at hospital admission show patchy bilateral GGOs and interlobular septal thickening (black arrows), with lower lobe predominance and subpleural involvement. Note also some immediate subpleural sparing of the GGOs (white arrows in b and c). (d–f) Follow-up corresponding axial contrast-enhanced CT images show evolving consolidative changes with volume loss, architectural distortion (ovals), and bronchiectasis (arrows in e and f).
Figure 5e.
Temporal pulmonary changes of COVID-19 pneumonia at CT in a 36-year-old woman. (a–c) Axial contrast-enhanced CT images obtained at hospital admission show patchy bilateral GGOs and interlobular septal thickening (black arrows), with lower lobe predominance and subpleural involvement. Note also some immediate subpleural sparing of the GGOs (white arrows in b and c). (d–f) Follow-up corresponding axial contrast-enhanced CT images show evolving consolidative changes with volume loss, architectural distortion (ovals), and bronchiectasis (arrows in e and f).
Figure 5f.
Temporal pulmonary changes of COVID-19 pneumonia at CT in a 36-year-old woman. (a–c) Axial contrast-enhanced CT images obtained at hospital admission show patchy bilateral GGOs and interlobular septal thickening (black arrows), with lower lobe predominance and subpleural involvement. Note also some immediate subpleural sparing of the GGOs (white arrows in b and c). (d–f) Follow-up corresponding axial contrast-enhanced CT images show evolving consolidative changes with volume loss, architectural distortion (ovals), and bronchiectasis (arrows in e and f).
GGOs and subpleural sparing in a 68-year-old man with COVID-19 and difficulty breathing. Axial contrast-enhanced CT image shows bilateral diffuse peripheral GGOs with subpleural sparing (arrows).
Figure 6.
GGOs and subpleural sparing in a 68-year-old man with COVID-19 and difficulty breathing. Axial contrast-enhanced CT image shows bilateral diffuse peripheral GGOs with subpleural sparing (arrows).
Halo sign in a 19-year-old man who presented with persistent fever and cough for 9 days and with positive test results for COVID-19. Axial nonenhanced CT chest image shows multifocal bilateral areas of mixed GGOs, with central nodular masslike opacities surrounded by ground-glass attenuation (arrows), a characteristic finding of a halo sign. Note that the opacities are located at the lung periphery.
Figure 7.
Halo sign in a 19-year-old man who presented with persistent fever and cough for 9 days and with positive test results for COVID-19. Axial nonenhanced CT chest image shows multifocal bilateral areas of mixed GGOs, with central nodular masslike opacities surrounded by ground-glass attenuation (arrows), a characteristic finding of a halo sign. Note that the opacities are located at the lung periphery.
Reverse halo sign in a 76-year-old man with COVID-19 and a history of pancreatic cancer. (a, b) Axial (a) and coronal (b) contrast-enhanced CT images show a nodular opacity (black arrow) in the right lower lobe, with central GGOs and peripheral solid consolidation, consistent with a reverse halo sign. Note the subtle bilateral peripheral GGOs (white arrows). (c) Axial contrast-enhanced CT image obtained 3 weeks after diagnosis shows subsequent resolution of the reverse halo sign, with vague residual opacity (circle).
Figure 8a.
Reverse halo sign in a 76-year-old man with COVID-19 and a history of pancreatic cancer. (a, b) Axial (a) and coronal (b) contrast-enhanced CT images show a nodular opacity (black arrow) in the right lower lobe, with central GGOs and peripheral solid consolidation, consistent with a reverse halo sign. Note the subtle bilateral peripheral GGOs (white arrows). (c) Axial contrast-enhanced CT image obtained 3 weeks after diagnosis shows subsequent resolution of the reverse halo sign, with vague residual opacity (circle).
Figure 8b.
Reverse halo sign in a 76-year-old man with COVID-19 and a history of pancreatic cancer. (a, b) Axial (a) and coronal (b) contrast-enhanced CT images show a nodular opacity (black arrow) in the right lower lobe, with central GGOs and peripheral solid consolidation, consistent with a reverse halo sign. Note the subtle bilateral peripheral GGOs (white arrows). (c) Axial contrast-enhanced CT image obtained 3 weeks after diagnosis shows subsequent resolution of the reverse halo sign, with vague residual opacity (circle).
Figure 8c.
Reverse halo sign in a 76-year-old man with COVID-19 and a history of pancreatic cancer. (a, b) Axial (a) and coronal (b) contrast-enhanced CT images show a nodular opacity (black arrow) in the right lower lobe, with central GGOs and peripheral solid consolidation, consistent with a reverse halo sign. Note the subtle bilateral peripheral GGOs (white arrows). (c) Axial contrast-enhanced CT image obtained 3 weeks after diagnosis shows subsequent resolution of the reverse halo sign, with vague residual opacity (circle).
Focal unilateral opacity in a 52-year-old woman who presented with persistent cough and positive COVID-19 RT-PCR and immunoglobulin G antibody test results. Axial nonenhanced chest CT image shows a focal unilateral 3-cm rounded peripheral GGO (arrow).
Figure 9.
Focal unilateral opacity in a 52-year-old woman who presented with persistent cough and positive COVID-19 RT-PCR and immunoglobulin G antibody test results. Axial nonenhanced chest CT image shows a focal unilateral 3-cm rounded peripheral GGO (arrow).
COVID-19 pneumonia complicated by mucus plugging and lung collapse in a 78-year-old man who presented with shortness of breath and suspicion of PE. Axial (a) and coronal (b, c) chest CT angiographic images show patchy GGOs (arrowheads in b) on the right and left lung opacification with volume loss in the left upper lobe due to atelectasis. Adjacent atelectasis and pneumonia in the left upper and lower lobes are evidenced by enhancement of the atelectatic lung (black arrow in c) and absence of enhancement within the pneumonic consolidation (white arrow in c). Atelectasis was caused by the presence of thick mucus that resulted in bronchial obstruction and subsequent collapse.
Figure 10a.
COVID-19 pneumonia complicated by mucus plugging and lung collapse in a 78-year-old man who presented with shortness of breath and suspicion of PE. Axial (a) and coronal (b, c) chest CT angiographic images show patchy GGOs (arrowheads in b) on the right and left lung opacification with volume loss in the left upper lobe due to atelectasis. Adjacent atelectasis and pneumonia in the left upper and lower lobes are evidenced by enhancement of the atelectatic lung (black arrow in c) and absence of enhancement within the pneumonic consolidation (white arrow in c). Atelectasis was caused by the presence of thick mucus that resulted in bronchial obstruction and subsequent collapse.
Figure 10b.
COVID-19 pneumonia complicated by mucus plugging and lung collapse in a 78-year-old man who presented with shortness of breath and suspicion of PE. Axial (a) and coronal (b, c) chest CT angiographic images show patchy GGOs (arrowheads in b) on the right and left lung opacification with volume loss in the left upper lobe due to atelectasis. Adjacent atelectasis and pneumonia in the left upper and lower lobes are evidenced by enhancement of the atelectatic lung (black arrow in c) and absence of enhancement within the pneumonic consolidation (white arrow in c). Atelectasis was caused by the presence of thick mucus that resulted in bronchial obstruction and subsequent collapse.
Figure 10c.
COVID-19 pneumonia complicated by mucus plugging and lung collapse in a 78-year-old man who presented with shortness of breath and suspicion of PE. Axial (a) and coronal (b, c) chest CT angiographic images show patchy GGOs (arrowheads in b) on the right and left lung opacification with volume loss in the left upper lobe due to atelectasis. Adjacent atelectasis and pneumonia in the left upper and lower lobes are evidenced by enhancement of the atelectatic lung (black arrow in c) and absence of enhancement within the pneumonic consolidation (white arrow in c). Atelectasis was caused by the presence of thick mucus that resulted in bronchial obstruction and subsequent collapse.
Bronchial dilatation in an 83-year-old man with COVID-19 with persistent hypoxia and a sudden increase in d-dimer levels, findings concerning for PE. Coronal CT angiographic image shows extensive bilateral bronchial dilatation with bronchial wall thickening (black arrows) and bilateral diffuse posterior lung GGOs, as well as interlobular septal thickening (white arrows), greater on the left than on the right, consistent with the later stages of COVID-19 pneumonia.
Figure 11.
Bronchial dilatation in an 83-year-old man with COVID-19 with persistent hypoxia and a sudden increase in d-dimer levels, findings concerning for PE. Coronal CT angiographic image shows extensive bilateral bronchial dilatation with bronchial wall thickening (black arrows) and bilateral diffuse posterior lung GGOs, as well as interlobular septal thickening (white arrows), greater on the left than on the right, consistent with the later stages of COVID-19 pneumonia.
Schematic illustration of the effects of SARS-CoV-2 virus and virus-activated cytokine storm and their role in the development of ARDS and multiorgan failure (MOF). Note that a similar mechanism can be applied to any solid or hollow organ in the body that expresses ACE2 receptors on its surface. IFN-γ = interferon γ, IL-1 = interleukin-1, IL- 6 = interleukin-6, IL-8 = interleukin-8, TNF-α = tumor necrosis factor-α.
Figure 12.
Schematic illustration of the effects of SARS-CoV-2 virus and virus-activated cytokine storm and their role in the development of ARDS and multiorgan failure (MOF). Note that a similar mechanism can be applied to any solid or hollow organ in the body that expresses ACE2 receptors on its surface. IFN-γ = interferon γ, IL-1 = interleukin-1, IL- 6 = interleukin-6, IL-8 = interleukin-8, TNF-α = tumor necrosis factor-α.
COVID-19 pneumonia with superimposed ARDS in a 61-year-old man who presented to the emergency department with hypoxia and subsequently underwent intubation. (a) AP chest radiograph shows bilateral diffuse lower-lobe predominant opacities (arrows), compatible with COVID pneumonia. (b) Coronal nonenhanced chest CT image shows “crazy-paving” pattern, with diffuse bilateral GGOs, interlobular septal thickening, and intralobular lines, a typical appearance of COVID-19 pneumonia.
Figure 13a.
COVID-19 pneumonia with superimposed ARDS in a 61-year-old man who presented to the emergency department with hypoxia and subsequently underwent intubation. (a) AP chest radiograph shows bilateral diffuse lower-lobe predominant opacities (arrows), compatible with COVID pneumonia. (b) Coronal nonenhanced chest CT image shows “crazy-paving” pattern, with diffuse bilateral GGOs, interlobular septal thickening, and intralobular lines, a typical appearance of COVID-19 pneumonia.
Figure 13b.
COVID-19 pneumonia with superimposed ARDS in a 61-year-old man who presented to the emergency department with hypoxia and subsequently underwent intubation. (a) AP chest radiograph shows bilateral diffuse lower-lobe predominant opacities (arrows), compatible with COVID pneumonia. (b) Coronal nonenhanced chest CT image shows “crazy-paving” pattern, with diffuse bilateral GGOs, interlobular septal thickening, and intralobular lines, a typical appearance of COVID-19 pneumonia.
Time course of lung changes in a 59-year-old man with COVID-19 pneumonia evaluated at chest radiography and CT over a 2-month period, which was complicated by development of a pneumothorax. (a–c) AP chest radiographs obtained at hospital admission (a), 4 days later (b), and 1 month later (c) show a peripheral patchy opacity in the left mid lung (oval in a) at the initial assessment, with substantial progression of lung disease on day 4 (b), with development of multiple bilateral peripheral areas of consolidation. The radiograph obtained 1 month later (c) shows interval improvement of the bilateral areas of consolidation and an increase in reticular opacities (dashed arrows in c), with the development of bronchial dilatation (solid arrow in c). Note that at this time the patient had undergone tracheostomy. (d, e) Axial (d) and coronal (e) contrast-enhanced chest CT images, obtained at the same time as c for worsening shortness of breath, show diffuse GGOs associated with superimposed interlobular reticulations, resulting in a crazy-paving pattern (dashed black arrows) and bronchial dilatation (black solid arrows in e). The findings were complicated by the presence of a moderate-sized anterior pneumothorax (white arrows), which was not well appreciated on the plain radiograph (c).
Figure 14a.
Time course of lung changes in a 59-year-old man with COVID-19 pneumonia evaluated at chest radiography and CT over a 2-month period, which was complicated by development of a pneumothorax. (a–c) AP chest radiographs obtained at hospital admission (a), 4 days later (b), and 1 month later (c) show a peripheral patchy opacity in the left mid lung (oval in a) at the initial assessment, with substantial progression of lung disease on day 4 (b), with development of multiple bilateral peripheral areas of consolidation. The radiograph obtained 1 month later (c) shows interval improvement of the bilateral areas of consolidation and an increase in reticular opacities (dashed arrows in c), with the development of bronchial dilatation (solid arrow in c). Note that at this time the patient had undergone tracheostomy. (d, e) Axial (d) and coronal (e) contrast-enhanced chest CT images, obtained at the same time as c for worsening shortness of breath, show diffuse GGOs associated with superimposed interlobular reticulations, resulting in a crazy-paving pattern (dashed black arrows) and bronchial dilatation (black solid arrows in e). The findings were complicated by the presence of a moderate-sized anterior pneumothorax (white arrows), which was not well appreciated on the plain radiograph (c).
Figure 14b.
Time course of lung changes in a 59-year-old man with COVID-19 pneumonia evaluated at chest radiography and CT over a 2-month period, which was complicated by development of a pneumothorax. (a–c) AP chest radiographs obtained at hospital admission (a), 4 days later (b), and 1 month later (c) show a peripheral patchy opacity in the left mid lung (oval in a) at the initial assessment, with substantial progression of lung disease on day 4 (b), with development of multiple bilateral peripheral areas of consolidation. The radiograph obtained 1 month later (c) shows interval improvement of the bilateral areas of consolidation and an increase in reticular opacities (dashed arrows in c), with the development of bronchial dilatation (solid arrow in c). Note that at this time the patient had undergone tracheostomy. (d, e) Axial (d) and coronal (e) contrast-enhanced chest CT images, obtained at the same time as c for worsening shortness of breath, show diffuse GGOs associated with superimposed interlobular reticulations, resulting in a crazy-paving pattern (dashed black arrows) and bronchial dilatation (black solid arrows in e). The findings were complicated by the presence of a moderate-sized anterior pneumothorax (white arrows), which was not well appreciated on the plain radiograph (c).
Figure 14c.
Time course of lung changes in a 59-year-old man with COVID-19 pneumonia evaluated at chest radiography and CT over a 2-month period, which was complicated by development of a pneumothorax. (a–c) AP chest radiographs obtained at hospital admission (a), 4 days later (b), and 1 month later (c) show a peripheral patchy opacity in the left mid lung (oval in a) at the initial assessment, with substantial progression of lung disease on day 4 (b), with development of multiple bilateral peripheral areas of consolidation. The radiograph obtained 1 month later (c) shows interval improvement of the bilateral areas of consolidation and an increase in reticular opacities (dashed arrows in c), with the development of bronchial dilatation (solid arrow in c). Note that at this time the patient had undergone tracheostomy. (d, e) Axial (d) and coronal (e) contrast-enhanced chest CT images, obtained at the same time as c for worsening shortness of breath, show diffuse GGOs associated with superimposed interlobular reticulations, resulting in a crazy-paving pattern (dashed black arrows) and bronchial dilatation (black solid arrows in e). The findings were complicated by the presence of a moderate-sized anterior pneumothorax (white arrows), which was not well appreciated on the plain radiograph (c).
Figure 14d.
Time course of lung changes in a 59-year-old man with COVID-19 pneumonia evaluated at chest radiography and CT over a 2-month period, which was complicated by development of a pneumothorax. (a–c) AP chest radiographs obtained at hospital admission (a), 4 days later (b), and 1 month later (c) show a peripheral patchy opacity in the left mid lung (oval in a) at the initial assessment, with substantial progression of lung disease on day 4 (b), with development of multiple bilateral peripheral areas of consolidation. The radiograph obtained 1 month later (c) shows interval improvement of the bilateral areas of consolidation and an increase in reticular opacities (dashed arrows in c), with the development of bronchial dilatation (solid arrow in c). Note that at this time the patient had undergone tracheostomy. (d, e) Axial (d) and coronal (e) contrast-enhanced chest CT images, obtained at the same time as c for worsening shortness of breath, show diffuse GGOs associated with superimposed interlobular reticulations, resulting in a crazy-paving pattern (dashed black arrows) and bronchial dilatation (black solid arrows in e). The findings were complicated by the presence of a moderate-sized anterior pneumothorax (white arrows), which was not well appreciated on the plain radiograph (c).
Figure 14e.
Time course of lung changes in a 59-year-old man with COVID-19 pneumonia evaluated at chest radiography and CT over a 2-month period, which was complicated by development of a pneumothorax. (a–c) AP chest radiographs obtained at hospital admission (a), 4 days later (b), and 1 month later (c) show a peripheral patchy opacity in the left mid lung (oval in a) at the initial assessment, with substantial progression of lung disease on day 4 (b), with development of multiple bilateral peripheral areas of consolidation. The radiograph obtained 1 month later (c) shows interval improvement of the bilateral areas of consolidation and an increase in reticular opacities (dashed arrows in c), with the development of bronchial dilatation (solid arrow in c). Note that at this time the patient had undergone tracheostomy. (d, e) Axial (d) and coronal (e) contrast-enhanced chest CT images, obtained at the same time as c for worsening shortness of breath, show diffuse GGOs associated with superimposed interlobular reticulations, resulting in a crazy-paving pattern (dashed black arrows) and bronchial dilatation (black solid arrows in e). The findings were complicated by the presence of a moderate-sized anterior pneumothorax (white arrows), which was not well appreciated on the plain radiograph (c).
COVID-19 complicated by pneumothorax and pneumomediastinum in a 59-year-old man who underwent intubation with increased oxygen requirements. Posteroranterior chest radiograph obtained in the prone position shows moderate-size right pneumothorax and small left apical pneumothorax (black arrows). Pneumomediastinum is evident by the presence of air around the aortic arch and beneath the heart (red arrows). The endotracheal tube and feeding tube are in place. A large amount of subcutaneous emphysema is depicted bilaterally (white arrows). The patchy bilateral hazy opacities are compatible with COVID-19 pneumonia.
Figure 15.
COVID-19 complicated by pneumothorax and pneumomediastinum in a 59-year-old man who underwent intubation with increased oxygen requirements. Posteroranterior chest radiograph obtained in the prone position shows moderate-size right pneumothorax and small left apical pneumothorax (black arrows). Pneumomediastinum is evident by the presence of air around the aortic arch and beneath the heart (red arrows). The endotracheal tube and feeding tube are in place. A large amount of subcutaneous emphysema is depicted bilaterally (white arrows). The patchy bilateral hazy opacities are compatible with COVID-19 pneumonia.
COVID-19 complicated by pneumomediastinum in a 61-year-old man. Axial (a) and coronal (b) chest CT angiographic images show a typical appearance of COVID-19 pneumonia, including diffuse GGOs and interlobular septal thickening (black arrows). Air is depicted anterior to the pulmonary artery (white arrow in a) and adjacent to the main pulmonary artery and left atrial appendage (white arrow in b), indicative of pneumomediastinum.
Figure 16a.
COVID-19 complicated by pneumomediastinum in a 61-year-old man. Axial (a) and coronal (b) chest CT angiographic images show a typical appearance of COVID-19 pneumonia, including diffuse GGOs and interlobular septal thickening (black arrows). Air is depicted anterior to the pulmonary artery (white arrow in a) and adjacent to the main pulmonary artery and left atrial appendage (white arrow in b), indicative of pneumomediastinum.
Figure 16b.
COVID-19 complicated by pneumomediastinum in a 61-year-old man. Axial (a) and coronal (b) chest CT angiographic images show a typical appearance of COVID-19 pneumonia, including diffuse GGOs and interlobular septal thickening (black arrows). Air is depicted anterior to the pulmonary artery (white arrow in a) and adjacent to the main pulmonary artery and left atrial appendage (white arrow in b), indicative of pneumomediastinum.
Saddle embolus in a 52-year-old man who presented to the emergency department with hypoxia and tachycardia and received positive test results for COVID-19. (a–c) Axial chest CT angiographic images show a saddle embolus (arrows in a), extending into the lobar and segmental pulmonary artery branches bilaterally, and associated dilatation of the right ventricle, suggestive of right heart strain (arrow in b). Patchy peripheral GGOs on the right and a nodular area of consolidation (arrows in c) on the left are typical findings of COVID-19 pneumonia. (d) Gray-scale (left) and corresponding color Doppler (right) US images of the left femoral vein (FV) obtained in the transverse plane show a partially occlusive thrombus (arrows). The vein was not compressible at manual compression (not shown).
Figure 17a.
Saddle embolus in a 52-year-old man who presented to the emergency department with hypoxia and tachycardia and received positive test results for COVID-19. (a–c) Axial chest CT angiographic images show a saddle embolus (arrows in a), extending into the lobar and segmental pulmonary artery branches bilaterally, and associated dilatation of the right ventricle, suggestive of right heart strain (arrow in b). Patchy peripheral GGOs on the right and a nodular area of consolidation (arrows in c) on the left are typical findings of COVID-19 pneumonia. (d) Gray-scale (left) and corresponding color Doppler (right) US images of the left femoral vein (FV) obtained in the transverse plane show a partially occlusive thrombus (arrows). The vein was not compressible at manual compression (not shown).
Figure 17b.
Saddle embolus in a 52-year-old man who presented to the emergency department with hypoxia and tachycardia and received positive test results for COVID-19. (a–c) Axial chest CT angiographic images show a saddle embolus (arrows in a), extending into the lobar and segmental pulmonary artery branches bilaterally, and associated dilatation of the right ventricle, suggestive of right heart strain (arrow in b). Patchy peripheral GGOs on the right and a nodular area of consolidation (arrows in c) on the left are typical findings of COVID-19 pneumonia. (d) Gray-scale (left) and corresponding color Doppler (right) US images of the left femoral vein (FV) obtained in the transverse plane show a partially occlusive thrombus (arrows). The vein was not compressible at manual compression (not shown).
Figure 17c.
Saddle embolus in a 52-year-old man who presented to the emergency department with hypoxia and tachycardia and received positive test results for COVID-19. (a–c) Axial chest CT angiographic images show a saddle embolus (arrows in a), extending into the lobar and segmental pulmonary artery branches bilaterally, and associated dilatation of the right ventricle, suggestive of right heart strain (arrow in b). Patchy peripheral GGOs on the right and a nodular area of consolidation (arrows in c) on the left are typical findings of COVID-19 pneumonia. (d) Gray-scale (left) and corresponding color Doppler (right) US images of the left femoral vein (FV) obtained in the transverse plane show a partially occlusive thrombus (arrows). The vein was not compressible at manual compression (not shown).
Figure 17d.
Saddle embolus in a 52-year-old man who presented to the emergency department with hypoxia and tachycardia and received positive test results for COVID-19. (a–c) Axial chest CT angiographic images show a saddle embolus (arrows in a), extending into the lobar and segmental pulmonary artery branches bilaterally, and associated dilatation of the right ventricle, suggestive of right heart strain (arrow in b). Patchy peripheral GGOs on the right and a nodular area of consolidation (arrows in c) on the left are typical findings of COVID-19 pneumonia. (d) Gray-scale (left) and corresponding color Doppler (right) US images of the left femoral vein (FV) obtained in the transverse plane show a partially occlusive thrombus (arrows). The vein was not compressible at manual compression (not shown).
Diagram shows the multifactorial mechanisms of coagulopathy related to COVID-19. CRP = C-reactive protein, IFN-γ = interferon γ, IL-1 = interleukin-1, IL- 6 = interleukin-6, IL-8 = interleukin-8, PAI-1 = pasminogen activator inhibitor-1, PT = prothrombin time, PTT = partial thromboplastin time, TNF-α = tumor necrosis factor-α.
Figure 18.
Diagram shows the multifactorial mechanisms of coagulopathy related to COVID-19. CRP = C-reactive protein, IFN-γ = interferon γ, IL-1 = interleukin-1, IL- 6 = interleukin-6, IL-8 = interleukin-8, PAI-1 = pasminogen activator inhibitor-1, PT = prothrombin time, PTT = partial thromboplastin time, TNF-α = tumor necrosis factor-α.
Occlusive DVT of the femoral vein in an 88-year-old man who had been hospitalized with COVID-19. Gray-scale (left) and color Doppler (right) US images obtained in the transverse plane show dilated femoral veins (white arrows), with internal heterogeneous echogenic material and absence of flow on the color Doppler US image, findings compatible with occlusion. The veins were noncompressible (not shown). Note that the femoral artery is filled with color, indicative of patency (black arrows).
Figure 19.
Occlusive DVT of the femoral vein in an 88-year-old man who had been hospitalized with COVID-19. Gray-scale (left) and color Doppler (right) US images obtained in the transverse plane show dilated femoral veins (white arrows), with internal heterogeneous echogenic material and absence of flow on the color Doppler US image, findings compatible with occlusion. The veins were noncompressible (not shown). Note that the femoral artery is filled with color, indicative of patency (black arrows).
DVT associated with a peripherally inserted central catheter (PICC) line in a 54-year-old man with COVID-19. Sagittal color Doppler US image shows an echogenic thrombus (black arrows) in the right subclavian vein, associated with the PICC line (white arrow).
Figure 20.
DVT associated with a peripherally inserted central catheter (PICC) line in a 54-year-old man with COVID-19. Sagittal color Doppler US image shows an echogenic thrombus (black arrows) in the right subclavian vein, associated with the PICC line (white arrow).
Partially occlusive thrombus in the left popliteal vein (L POP V) in a critically ill 64-year-old man with COVID-19 who acutely developed left leg swelling. Laboratory test results confirmed elevated d-dimer levels. Gray-scale (left) and power Doppler (right) US images show a dilated left popliteal vein with echogenic thrombus (arrows) within, best visualized on the gray-scale US image. Power Doppler image US (right) shows absence of flow within the distended vein except for a small amount of flow within the lumen of the vessel, indicative of a partially occlusive thrombus.
Figure 21.
Partially occlusive thrombus in the left popliteal vein (L POP V) in a critically ill 64-year-old man with COVID-19 who acutely developed left leg swelling. Laboratory test results confirmed elevated d-dimer levels. Gray-scale (left) and power Doppler (right) US images show a dilated left popliteal vein with echogenic thrombus (arrows) within, best visualized on the gray-scale US image. Power Doppler image US (right) shows absence of flow within the distended vein except for a small amount of flow within the lumen of the vessel, indicative of a partially occlusive thrombus.
Superficial vein thrombosis in a 72-year-old woman hospitalized with COVID-19. Transverse gray-scale (left) and color Doppler (middle) US images without compression and gray-scale US image with compression (right) show an occlusive thrombus in the dilated basilic vein (black arrows). Note the absence of flow within the vein on the color Doppler US image (middle) and noncompressibility of the vein (left). The brachial veins (white arrows) are compressible (right) and demonstrate patency on the color Doppler US image (middle).
Figures 22.
Superficial vein thrombosis in a 72-year-old woman hospitalized with COVID-19. Transverse gray-scale (left) and color Doppler (middle) US images without compression and gray-scale US image with compression (right) show an occlusive thrombus in the dilated basilic vein (black arrows). Note the absence of flow within the vein on the color Doppler US image (middle) and noncompressibility of the vein (left). The brachial veins (white arrows) are compressible (right) and demonstrate patency on the color Doppler US image (middle).
Extensive bilateral upper extremity DVT in a critically ill 77-year-old man with COVID-19 who developed bilateral upper extremity swelling, with markedly elevated d-dimer levels (31 447 ng/mL). (a, b) Sagittal color (a) and power (b) Doppler US images show absent flow in the distended vein, with echogenic material in the left subclavian vein (arrow in a) and the right axillary vein (arrows in b), compatible with bilateral occlusive thrombi. Additional occlusive and nonocclusive thrombi were also seen (not shown). (c) Gray-scale US images without (left) and with (right) compression show a thrombus (arrows) in the right cephalic vein, which demonstrates no vascular compression (arrows).
Figure 23a.
Extensive bilateral upper extremity DVT in a critically ill 77-year-old man with COVID-19 who developed bilateral upper extremity swelling, with markedly elevated d-dimer levels (31 447 ng/mL). (a, b) Sagittal color (a) and power (b) Doppler US images show absent flow in the distended vein, with echogenic material in the left subclavian vein (arrow in a) and the right axillary vein (arrows in b), compatible with bilateral occlusive thrombi. Additional occlusive and nonocclusive thrombi were also seen (not shown). (c) Gray-scale US images without (left) and with (right) compression show a thrombus (arrows) in the right cephalic vein, which demonstrates no vascular compression (arrows).
Figure 23b.
Extensive bilateral upper extremity DVT in a critically ill 77-year-old man with COVID-19 who developed bilateral upper extremity swelling, with markedly elevated d-dimer levels (31 447 ng/mL). (a, b) Sagittal color (a) and power (b) Doppler US images show absent flow in the distended vein, with echogenic material in the left subclavian vein (arrow in a) and the right axillary vein (arrows in b), compatible with bilateral occlusive thrombi. Additional occlusive and nonocclusive thrombi were also seen (not shown). (c) Gray-scale US images without (left) and with (right) compression show a thrombus (arrows) in the right cephalic vein, which demonstrates no vascular compression (arrows).
Figure 23c.
Extensive bilateral upper extremity DVT in a critically ill 77-year-old man with COVID-19 who developed bilateral upper extremity swelling, with markedly elevated d-dimer levels (31 447 ng/mL). (a, b) Sagittal color (a) and power (b) Doppler US images show absent flow in the distended vein, with echogenic material in the left subclavian vein (arrow in a) and the right axillary vein (arrows in b), compatible with bilateral occlusive thrombi. Additional occlusive and nonocclusive thrombi were also seen (not shown). (c) Gray-scale US images without (left) and with (right) compression show a thrombus (arrows) in the right cephalic vein, which demonstrates no vascular compression (arrows).
Inferior vena cava (IVC) and peripheral deep vein thrombosis in a 78-year-old man with COVID-19 with leg swelling and abdominal pain. Sagittal (a) and axial (b) contrast-enhanced CT images show filling defects in the bilateral common femoral veins (solid arrows). Near complete occlusion of the IVC (solid arrows in a) to the level of an IVC filter (dashed arrow in a) was present. Note the renal transplant (arrowhead in a). Both central and peripheral venous thrombosis were not depicted at prior imaging examinations (not shown).
Figure 24a.
Inferior vena cava (IVC) and peripheral deep vein thrombosis in a 78-year-old man with COVID-19 with leg swelling and abdominal pain. Sagittal (a) and axial (b) contrast-enhanced CT images show filling defects in the bilateral common femoral veins (solid arrows). Near complete occlusion of the IVC (solid arrows in a) to the level of an IVC filter (dashed arrow in a) was present. Note the renal transplant (arrowhead in a). Both central and peripheral venous thrombosis were not depicted at prior imaging examinations (not shown).
Figure 24b.
Inferior vena cava (IVC) and peripheral deep vein thrombosis in a 78-year-old man with COVID-19 with leg swelling and abdominal pain. Sagittal (a) and axial (b) contrast-enhanced CT images show filling defects in the bilateral common femoral veins (solid arrows). Near complete occlusion of the IVC (solid arrows in a) to the level of an IVC filter (dashed arrow in a) was present. Note the renal transplant (arrowhead in a). Both central and peripheral venous thrombosis were not depicted at prior imaging examinations (not shown).
Popliteal and posterior tibial artery thrombosis in a 58-year-old woman with COVID-19 in the ICU. (a, b) Sagittal color (a) and spectral (b) Doppler US images show an echogenic heterogeneous thrombus (white arrows) distending the right popliteal artery. The characteristic knocking or “stump-thump” waveform with absence of diastolic flow (black arrows in b) and low amplitude (yellow circle in b) imply the presence of occlusion just distal to the area of interrogation. (c) Sagittal power Doppler US image shows no flow in the occluded right posterior tibial artery (black arrows). (d) Corresponding sagittal CT angiographic reconstruction shows abrupt cutoff of the popliteal artery by a thrombus (solid arrow). Note the opacified popliteal artery (Rt POP A) proximal to the thrombus (dashed arrow). The patient also had a liver infarct and bowel ischemia (not shown).
Figure 25a.
Popliteal and posterior tibial artery thrombosis in a 58-year-old woman with COVID-19 in the ICU. (a, b) Sagittal color (a) and spectral (b) Doppler US images show an echogenic heterogeneous thrombus (white arrows) distending the right popliteal artery. The characteristic knocking or “stump-thump” waveform with absence of diastolic flow (black arrows in b) and low amplitude (yellow circle in b) imply the presence of occlusion just distal to the area of interrogation. (c) Sagittal power Doppler US image shows no flow in the occluded right posterior tibial artery (black arrows). (d) Corresponding sagittal CT angiographic reconstruction shows abrupt cutoff of the popliteal artery by a thrombus (solid arrow). Note the opacified popliteal artery (Rt POP A) proximal to the thrombus (dashed arrow). The patient also had a liver infarct and bowel ischemia (not shown).
Figure 25b.
Popliteal and posterior tibial artery thrombosis in a 58-year-old woman with COVID-19 in the ICU. (a, b) Sagittal color (a) and spectral (b) Doppler US images show an echogenic heterogeneous thrombus (white arrows) distending the right popliteal artery. The characteristic knocking or “stump-thump” waveform with absence of diastolic flow (black arrows in b) and low amplitude (yellow circle in b) imply the presence of occlusion just distal to the area of interrogation. (c) Sagittal power Doppler US image shows no flow in the occluded right posterior tibial artery (black arrows). (d) Corresponding sagittal CT angiographic reconstruction shows abrupt cutoff of the popliteal artery by a thrombus (solid arrow). Note the opacified popliteal artery (Rt POP A) proximal to the thrombus (dashed arrow). The patient also had a liver infarct and bowel ischemia (not shown).
Figure 25c.
Popliteal and posterior tibial artery thrombosis in a 58-year-old woman with COVID-19 in the ICU. (a, b) Sagittal color (a) and spectral (b) Doppler US images show an echogenic heterogeneous thrombus (white arrows) distending the right popliteal artery. The characteristic knocking or “stump-thump” waveform with absence of diastolic flow (black arrows in b) and low amplitude (yellow circle in b) imply the presence of occlusion just distal to the area of interrogation. (c) Sagittal power Doppler US image shows no flow in the occluded right posterior tibial artery (black arrows). (d) Corresponding sagittal CT angiographic reconstruction shows abrupt cutoff of the popliteal artery by a thrombus (solid arrow). Note the opacified popliteal artery (Rt POP A) proximal to the thrombus (dashed arrow). The patient also had a liver infarct and bowel ischemia (not shown).
Figure 25d.
Popliteal and posterior tibial artery thrombosis in a 58-year-old woman with COVID-19 in the ICU. (a, b) Sagittal color (a) and spectral (b) Doppler US images show an echogenic heterogeneous thrombus (white arrows) distending the right popliteal artery. The characteristic knocking or “stump-thump” waveform with absence of diastolic flow (black arrows in b) and low amplitude (yellow circle in b) imply the presence of occlusion just distal to the area of interrogation. (c) Sagittal power Doppler US image shows no flow in the occluded right posterior tibial artery (black arrows). (d) Corresponding sagittal CT angiographic reconstruction shows abrupt cutoff of the popliteal artery by a thrombus (solid arrow). Note the opacified popliteal artery (Rt POP A) proximal to the thrombus (dashed arrow). The patient also had a liver infarct and bowel ischemia (not shown).
Popliteal artery occlusion in a severely ill 65-year-old man with COVID-19 with bilateral diminished dorsalis pedis pulses. Coronal three-dimensional volume-rendered run-off CT angiographic image shows abrupt cutoff (arrows) of the bilateral popliteal arteries (PA), compatible with bilateral occlusion. Note that distally run-off calf arteries have been reconstituted through collateral arteries. R LE = right lower extremity, L LE = left lower extremity.
Figure 26.
Popliteal artery occlusion in a severely ill 65-year-old man with COVID-19 with bilateral diminished dorsalis pedis pulses. Coronal three-dimensional volume-rendered run-off CT angiographic image shows abrupt cutoff (arrows) of the bilateral popliteal arteries (PA), compatible with bilateral occlusion. Note that distally run-off calf arteries have been reconstituted through collateral arteries. R LE = right lower extremity, L LE = left lower extremity.
Brachial artery thrombosis and renal infarct in a 51-year-old man who presented to the emergency department with acute left upper extremity pain and numbness. The patient had a 2-week history of cough and fever and was confirmed to be COVID-19 positive. (a) Coronal left upper extremity CT angiographic image shows an abrupt segmental occlusion (arrow) of the distal left brachial artery, indicative of peripheral arterial thromboembolization. The left subclavian and axillary arteries were otherwise unremarkable, with good opacification of the arteries. (b) Coronal three-dimensional maximum intensity projection shows abrupt cutoff (arrow) of the left brachial artery. (c, d) Axial chest CT angiographic images show the typical appearance of lung changes in COVID-19 pneumonia (arrows in c). Note the incidentally found sharp well-defined area of nonenhancement in the partially imaged upper pole of the right kidney, a finding indicative of a renal infarct (arrows in d).
Figure 27a.
Brachial artery thrombosis and renal infarct in a 51-year-old man who presented to the emergency department with acute left upper extremity pain and numbness. The patient had a 2-week history of cough and fever and was confirmed to be COVID-19 positive. (a) Coronal left upper extremity CT angiographic image shows an abrupt segmental occlusion (arrow) of the distal left brachial artery, indicative of peripheral arterial thromboembolization. The left subclavian and axillary arteries were otherwise unremarkable, with good opacification of the arteries. (b) Coronal three-dimensional maximum intensity projection shows abrupt cutoff (arrow) of the left brachial artery. (c, d) Axial chest CT angiographic images show the typical appearance of lung changes in COVID-19 pneumonia (arrows in c). Note the incidentally found sharp well-defined area of nonenhancement in the partially imaged upper pole of the right kidney, a finding indicative of a renal infarct (arrows in d).
Figure 27b.
Brachial artery thrombosis and renal infarct in a 51-year-old man who presented to the emergency department with acute left upper extremity pain and numbness. The patient had a 2-week history of cough and fever and was confirmed to be COVID-19 positive. (a) Coronal left upper extremity CT angiographic image shows an abrupt segmental occlusion (arrow) of the distal left brachial artery, indicative of peripheral arterial thromboembolization. The left subclavian and axillary arteries were otherwise unremarkable, with good opacification of the arteries. (b) Coronal three-dimensional maximum intensity projection shows abrupt cutoff (arrow) of the left brachial artery. (c, d) Axial chest CT angiographic images show the typical appearance of lung changes in COVID-19 pneumonia (arrows in c). Note the incidentally found sharp well-defined area of nonenhancement in the partially imaged upper pole of the right kidney, a finding indicative of a renal infarct (arrows in d).
Figure 27c.
Brachial artery thrombosis and renal infarct in a 51-year-old man who presented to the emergency department with acute left upper extremity pain and numbness. The patient had a 2-week history of cough and fever and was confirmed to be COVID-19 positive. (a) Coronal left upper extremity CT angiographic image shows an abrupt segmental occlusion (arrow) of the distal left brachial artery, indicative of peripheral arterial thromboembolization. The left subclavian and axillary arteries were otherwise unremarkable, with good opacification of the arteries. (b) Coronal three-dimensional maximum intensity projection shows abrupt cutoff (arrow) of the left brachial artery. (c, d) Axial chest CT angiographic images show the typical appearance of lung changes in COVID-19 pneumonia (arrows in c). Note the incidentally found sharp well-defined area of nonenhancement in the partially imaged upper pole of the right kidney, a finding indicative of a renal infarct (arrows in d).
Figure 27d.
Brachial artery thrombosis and renal infarct in a 51-year-old man who presented to the emergency department with acute left upper extremity pain and numbness. The patient had a 2-week history of cough and fever and was confirmed to be COVID-19 positive. (a) Coronal left upper extremity CT angiographic image shows an abrupt segmental occlusion (arrow) of the distal left brachial artery, indicative of peripheral arterial thromboembolization. The left subclavian and axillary arteries were otherwise unremarkable, with good opacification of the arteries. (b) Coronal three-dimensional maximum intensity projection shows abrupt cutoff (arrow) of the left brachial artery. (c, d) Axial chest CT angiographic images show the typical appearance of lung changes in COVID-19 pneumonia (arrows in c). Note the incidentally found sharp well-defined area of nonenhancement in the partially imaged upper pole of the right kidney, a finding indicative of a renal infarct (arrows in d).
Common carotid artery (CCA) occlusion in a 56-year-old woman with neurologic deficits who had been hospitalized with COVID-19. (a, b) Coronal three-dimensional maximum intensity projection reformatted image (a) and axial CT angiographic image (b) of the head and neck show an abrupt cutoff at the origin of the CCA (black arrow in a). Note the absence of opacification of the right CCA, as well as internal and external carotid arteries (arrows in b). The left carotid vasculature is well opacified with intravenous contrast material (white arrow in a). (c) Axial nonenhanced head CT image shows wedge-shaped areas of hypoattenuation (arrows) in a watershed distribution, consistent with acute infarcts related to carotid occlusion.
Figure 28a.
Common carotid artery (CCA) occlusion in a 56-year-old woman with neurologic deficits who had been hospitalized with COVID-19. (a, b) Coronal three-dimensional maximum intensity projection reformatted image (a) and axial CT angiographic image (b) of the head and neck show an abrupt cutoff at the origin of the CCA (black arrow in a). Note the absence of opacification of the right CCA, as well as internal and external carotid arteries (arrows in b). The left carotid vasculature is well opacified with intravenous contrast material (white arrow in a). (c) Axial nonenhanced head CT image shows wedge-shaped areas of hypoattenuation (arrows) in a watershed distribution, consistent with acute infarcts related to carotid occlusion.
Figure 28b.
Common carotid artery (CCA) occlusion in a 56-year-old woman with neurologic deficits who had been hospitalized with COVID-19. (a, b) Coronal three-dimensional maximum intensity projection reformatted image (a) and axial CT angiographic image (b) of the head and neck show an abrupt cutoff at the origin of the CCA (black arrow in a). Note the absence of opacification of the right CCA, as well as internal and external carotid arteries (arrows in b). The left carotid vasculature is well opacified with intravenous contrast material (white arrow in a). (c) Axial nonenhanced head CT image shows wedge-shaped areas of hypoattenuation (arrows) in a watershed distribution, consistent with acute infarcts related to carotid occlusion.
Figure 28c.
Common carotid artery (CCA) occlusion in a 56-year-old woman with neurologic deficits who had been hospitalized with COVID-19. (a, b) Coronal three-dimensional maximum intensity projection reformatted image (a) and axial CT angiographic image (b) of the head and neck show an abrupt cutoff at the origin of the CCA (black arrow in a). Note the absence of opacification of the right CCA, as well as internal and external carotid arteries (arrows in b). The left carotid vasculature is well opacified with intravenous contrast material (white arrow in a). (c) Axial nonenhanced head CT image shows wedge-shaped areas of hypoattenuation (arrows) in a watershed distribution, consistent with acute infarcts related to carotid occlusion.
Central and peripheral arterial thrombosis in a severely ill 46-year-old man with COVID-19 in the ICU. (a, b) Axial (a) and sagittal (b) chest CT angiographic images show bibasilar areas of consolidation (black arrows in a), indicative of COVID-19 pneumonia, and a central aortic thrombosis with a thrombus attached to the wall of the aortic arch (white arrow in a and b). (c–f) Sagittal (c), coronal (d), and axial (e, f) CT angiographic images show a large thrombus extending from the abdominal aorta into the superior mesenteric artery origin (arrow in c), which resulted in bowel ischemia, evidenced by thickening of the watershed splenic flexure of the large bowel (arrow in d). Note the multifocal bilateral wedge-shaped renal cortical infarcts (arrows in e). Note also a nonocclusive thrombus in the left profunda femoris artery (white arrow in f), indicative of a concurrent presence of a peripheral thrombosis. There is normal opacification of the patent right profunda femoris artery (black arrow in f). This case demonstrates multifocal multisystem manifestations of COVID-19 complicated by coagulopathy that resulted in injury to various organs and systems. It is an example of the need for increased awareness among radiologists to thoroughly evaluate all covered anatomy for COVID-related complications.
Figure 29a.
Central and peripheral arterial thrombosis in a severely ill 46-year-old man with COVID-19 in the ICU. (a, b) Axial (a) and sagittal (b) chest CT angiographic images show bibasilar areas of consolidation (black arrows in a), indicative of COVID-19 pneumonia, and a central aortic thrombosis with a thrombus attached to the wall of the aortic arch (white arrow in a and b). (c–f) Sagittal (c), coronal (d), and axial (e, f) CT angiographic images show a large thrombus extending from the abdominal aorta into the superior mesenteric artery origin (arrow in c), which resulted in bowel ischemia, evidenced by thickening of the watershed splenic flexure of the large bowel (arrow in d). Note the multifocal bilateral wedge-shaped renal cortical infarcts (arrows in e). Note also a nonocclusive thrombus in the left profunda femoris artery (white arrow in f), indicative of a concurrent presence of a peripheral thrombosis. There is normal opacification of the patent right profunda femoris artery (black arrow in f). This case demonstrates multifocal multisystem manifestations of COVID-19 complicated by coagulopathy that resulted in injury to various organs and systems. It is an example of the need for increased awareness among radiologists to thoroughly evaluate all covered anatomy for COVID-related complications.
Figure 29b.
Central and peripheral arterial thrombosis in a severely ill 46-year-old man with COVID-19 in the ICU. (a, b) Axial (a) and sagittal (b) chest CT angiographic images show bibasilar areas of consolidation (black arrows in a), indicative of COVID-19 pneumonia, and a central aortic thrombosis with a thrombus attached to the wall of the aortic arch (white arrow in a and b). (c–f) Sagittal (c), coronal (d), and axial (e, f) CT angiographic images show a large thrombus extending from the abdominal aorta into the superior mesenteric artery origin (arrow in c), which resulted in bowel ischemia, evidenced by thickening of the watershed splenic flexure of the large bowel (arrow in d). Note the multifocal bilateral wedge-shaped renal cortical infarcts (arrows in e). Note also a nonocclusive thrombus in the left profunda femoris artery (white arrow in f), indicative of a concurrent presence of a peripheral thrombosis. There is normal opacification of the patent right profunda femoris artery (black arrow in f). This case demonstrates multifocal multisystem manifestations of COVID-19 complicated by coagulopathy that resulted in injury to various organs and systems. It is an example of the need for increased awareness among radiologists to thoroughly evaluate all covered anatomy for COVID-related complications.
Figure 29c.
Central and peripheral arterial thrombosis in a severely ill 46-year-old man with COVID-19 in the ICU. (a, b) Axial (a) and sagittal (b) chest CT angiographic images show bibasilar areas of consolidation (black arrows in a), indicative of COVID-19 pneumonia, and a central aortic thrombosis with a thrombus attached to the wall of the aortic arch (white arrow in a and b). (c–f) Sagittal (c), coronal (d), and axial (e, f) CT angiographic images show a large thrombus extending from the abdominal aorta into the superior mesenteric artery origin (arrow in c), which resulted in bowel ischemia, evidenced by thickening of the watershed splenic flexure of the large bowel (arrow in d). Note the multifocal bilateral wedge-shaped renal cortical infarcts (arrows in e). Note also a nonocclusive thrombus in the left profunda femoris artery (white arrow in f), indicative of a concurrent presence of a peripheral thrombosis. There is normal opacification of the patent right profunda femoris artery (black arrow in f). This case demonstrates multifocal multisystem manifestations of COVID-19 complicated by coagulopathy that resulted in injury to various organs and systems. It is an example of the need for increased awareness among radiologists to thoroughly evaluate all covered anatomy for COVID-related complications.
Figure 29d.
Central and peripheral arterial thrombosis in a severely ill 46-year-old man with COVID-19 in the ICU. (a, b) Axial (a) and sagittal (b) chest CT angiographic images show bibasilar areas of consolidation (black arrows in a), indicative of COVID-19 pneumonia, and a central aortic thrombosis with a thrombus attached to the wall of the aortic arch (white arrow in a and b). (c–f) Sagittal (c), coronal (d), and axial (e, f) CT angiographic images show a large thrombus extending from the abdominal aorta into the superior mesenteric artery origin (arrow in c), which resulted in bowel ischemia, evidenced by thickening of the watershed splenic flexure of the large bowel (arrow in d). Note the multifocal bilateral wedge-shaped renal cortical infarcts (arrows in e). Note also a nonocclusive thrombus in the left profunda femoris artery (white arrow in f), indicative of a concurrent presence of a peripheral thrombosis. There is normal opacification of the patent right profunda femoris artery (black arrow in f). This case demonstrates multifocal multisystem manifestations of COVID-19 complicated by coagulopathy that resulted in injury to various organs and systems. It is an example of the need for increased awareness among radiologists to thoroughly evaluate all covered anatomy for COVID-related complications.
Figure 29e.
Central and peripheral arterial thrombosis in a severely ill 46-year-old man with COVID-19 in the ICU. (a, b) Axial (a) and sagittal (b) chest CT angiographic images show bibasilar areas of consolidation (black arrows in a), indicative of COVID-19 pneumonia, and a central aortic thrombosis with a thrombus attached to the wall of the aortic arch (white arrow in a and b). (c–f) Sagittal (c), coronal (d), and axial (e, f) CT angiographic images show a large thrombus extending from the abdominal aorta into the superior mesenteric artery origin (arrow in c), which resulted in bowel ischemia, evidenced by thickening of the watershed splenic flexure of the large bowel (arrow in d). Note the multifocal bilateral wedge-shaped renal cortical infarcts (arrows in e). Note also a nonocclusive thrombus in the left profunda femoris artery (white arrow in f), indicative of a concurrent presence of a peripheral thrombosis. There is normal opacification of the patent right profunda femoris artery (black arrow in f). This case demonstrates multifocal multisystem manifestations of COVID-19 complicated by coagulopathy that resulted in injury to various organs and systems. It is an example of the need for increased awareness among radiologists to thoroughly evaluate all covered anatomy for COVID-related complications.
Figure 29f.
Central and peripheral arterial thrombosis in a severely ill 46-year-old man with COVID-19 in the ICU. (a, b) Axial (a) and sagittal (b) chest CT angiographic images show bibasilar areas of consolidation (black arrows in a), indicative of COVID-19 pneumonia, and a central aortic thrombosis with a thrombus attached to the wall of the aortic arch (white arrow in a and b). (c–f) Sagittal (c), coronal (d), and axial (e, f) CT angiographic images show a large thrombus extending from the abdominal aorta into the superior mesenteric artery origin (arrow in c), which resulted in bowel ischemia, evidenced by thickening of the watershed splenic flexure of the large bowel (arrow in d). Note the multifocal bilateral wedge-shaped renal cortical infarcts (arrows in e). Note also a nonocclusive thrombus in the left profunda femoris artery (white arrow in f), indicative of a concurrent presence of a peripheral thrombosis. There is normal opacification of the patent right profunda femoris artery (black arrow in f). This case demonstrates multifocal multisystem manifestations of COVID-19 complicated by coagulopathy that resulted in injury to various organs and systems. It is an example of the need for increased awareness among radiologists to thoroughly evaluate all covered anatomy for COVID-related complications.

References

    1. COVID-19 Coronavirus Pandemic. https://www.worldometers.info/coronavirus/. Accessed August 1, 2020.
    1. Cantwell R, Clutton-Brock T, Cooper G, et al. Saving Mothers’ Lives: Reviewing maternal deaths to make motherhood safer: 2006-2008—The Eighth Report of the Confidential Enquiries into Maternal Deaths in the United Kingdom. BJOG 2011;118(suppl 1):1–203 [Published correction appears in BJOG 2015;122(5):e1.]. - PubMed
    1. Wang T, Du Z, Zhu F, et al. Comorbidities and multi-organ injuries in the treatment of COVID-19. Lancet 2020;395(10228):e52. - PMC - PubMed
    1. Mahajan A, Hirsch JA. Novel Coronavirus: What Neuroradiologists as Citizens of the World Need to Know. AJNR Am J Neuroradiol 2020;41(4):552–554. - PMC - PubMed
    1. Hamming I, Timens W, Bulthuis ML, Lely AT, Navis G, van Goor H. Tissue distribution of ACE2 protein, the functional receptor for SARS coronavirus: A first step in understanding SARS pathogenesis. J Pathol 2004;203(2):631–637. - PMC - PubMed

MeSH terms