

Social Media as an Early Proxy for Social Distancing Indicated by the COVID-19 Reproduction Number: Observational Study
- PMID: 33001831
- PMCID: PMC7609194
- DOI: 10.2196/21340
Social Media as an Early Proxy for Social Distancing Indicated by the COVID-19 Reproduction Number: Observational Study
Abstract
Background: The magnitude and time course of the COVID-19 epidemic in the United States depends on early interventions to reduce the basic reproductive number to below 1. It is imperative, then, to develop methods to actively assess where quarantine measures such as social distancing may be deficient and suppress those potential resurgence nodes as early as possible.
Objective: We ask if social media is an early indicator of public social distancing measures in the United States by investigating its correlation with the time-varying reproduction number (Rt) as compared to social mobility estimates reported from Google and Apple Maps.
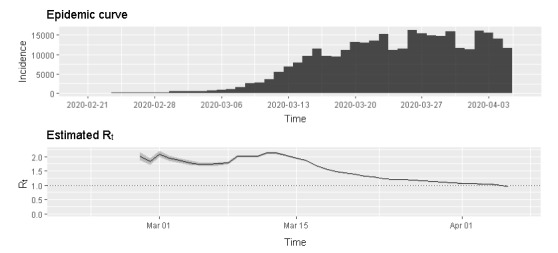
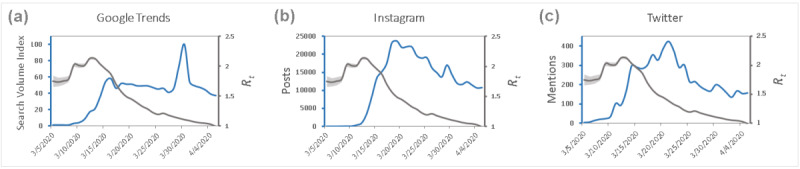
Methods: In this observational study, the estimated Rt was obtained for the period between March 5 and April 5, 2020, using the EpiEstim package. Social media activity was assessed using queries of "social distancing" or "#socialdistancing" on Google Trends, Instagram, and Twitter, with social mobility assessed using Apple and Google Maps data. Cross-correlations were performed between Rt and social media activity or mobility for the United States. We used Pearson correlations and the coefficient of determination (ρ) with significance set to P<.05.
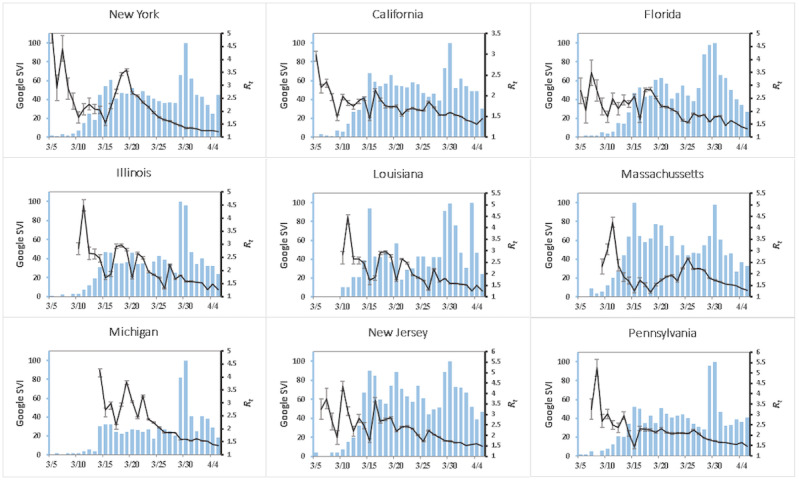
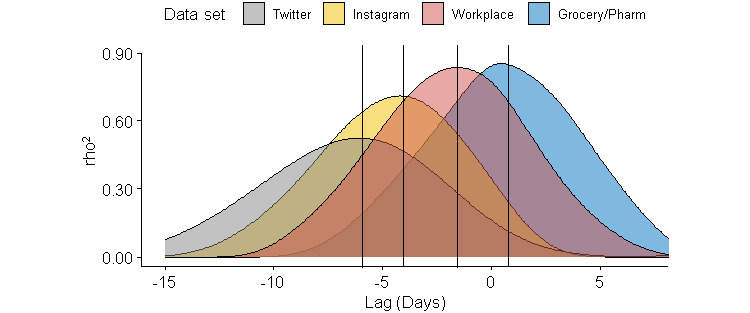
Results: Negative correlations were found between Google search interest for "social distancing" and Rt in the United States (P<.001), and between search interest and state-specific Rt for 9 states with the highest COVID-19 cases (P<.001); most states experienced a delay varying between 3-8 days before reaching significance. A negative correlation was seen at a 4-day delay from the start of the Instagram hashtag "#socialdistancing" and at 6 days for Twitter (P<.001). Significant correlations between Rt and social media manifest earlier in time compared to social mobility measures from Google and Apple Maps, with peaks at -6 and -4 days. Meanwhile, changes in social mobility correlated best with Rt at -2 days and +1 day for workplace and grocery/pharmacy, respectively.
Conclusions: Our study demonstrates the potential use of Google Trends, Instagram, and Twitter as epidemiological tools in the assessment of social distancing measures in the United States during the early course of the COVID-19 pandemic. Their correlation and earlier rise and peak in correlative strength with Rt when compared to social mobility may provide proactive insight into whether social distancing efforts are sufficiently enacted. Whether this proves valuable in the creation of more accurate assessments of the early epidemic course is uncertain due to limitations. These limitations include the use of a biased sample that is internet literate with internet access, which may covary with socioeconomic status, education, geography, and age, and the use of subtotal social media mentions of social distancing. Future studies should focus on investigating how social media reactions change during the course of the epidemic, as well as the conversion of social media behavior to actual physical behavior.
Keywords: Apple Maps; COVID-19; Google Maps; Google Trends; Instagram; Twitter; epidemic; estimated reproduction number; pandemic; public health surveillance; reproduction number; social distancing; social media; social media surveillance.
©Joseph Younis, Harvy Freitag, Jeremy S Ruthberg, Jonathan P Romanes, Craig Nielsen, Neil Mehta. Originally published in JMIR Public Health and Surveillance (http://publichealth.jmir.org), 20.10.2020.
Conflict of interest statement
Conflicts of Interest: None declared.
Figures
Similar articles
-
Big Data, Natural Language Processing, and Deep Learning to Detect and Characterize Illicit COVID-19 Product Sales: Infoveillance Study on Twitter and Instagram.JMIR Public Health Surveill. 2020 Aug 25;6(3):e20794. doi: 10.2196/20794. JMIR Public Health Surveill. 2020. PMID: 32750006 Free PMC article.
-
Association Between Public Knowledge About COVID-19, Trust in Information Sources, and Adherence to Social Distancing: Cross-Sectional Survey.JMIR Public Health Surveill. 2020 Sep 15;6(3):e22060. doi: 10.2196/22060. JMIR Public Health Surveill. 2020. PMID: 32930670 Free PMC article.
-
Association between mobility patterns and COVID-19 transmission in the USA: a mathematical modelling study.Lancet Infect Dis. 2020 Nov;20(11):1247-1254. doi: 10.1016/S1473-3099(20)30553-3. Epub 2020 Jul 1. Lancet Infect Dis. 2020. PMID: 32621869 Free PMC article.
-
Novel approaches to estimate compliance with lockdown measures in the COVID-19 pandemic.J Glob Health. 2020 Jun;10(1):010348. doi: 10.7189/jogh.10.010348. J Glob Health. 2020. PMID: 32426117 Free PMC article. Review. No abstract available.
-
Impact of Social Media and Virtual Learning on Cardiology During the COVID-19 Pandemic Era and Beyond.Methodist Debakey Cardiovasc J. 2020 Jul-Sep;16(3):e1-e7. doi: 10.14797/mdcj-16-3-e1. Methodist Debakey Cardiovasc J. 2020. PMID: 33133368 Free PMC article. Review.
Cited by
-
Changes to Public Health Surveillance Methods Due to the COVID-19 Pandemic: Scoping Review.JMIR Public Health Surveill. 2024 Jan 19;10:e49185. doi: 10.2196/49185. JMIR Public Health Surveill. 2024. PMID: 38241067 Free PMC article.
-
Use of digital technologies for public health surveillance during the COVID-19 pandemic: A scoping review.Digit Health. 2023 May 17;9:20552076231173220. doi: 10.1177/20552076231173220. eCollection 2023 Jan-Dec. Digit Health. 2023. PMID: 37214658 Free PMC article.
-
Public Attitudes During the Second Lockdown: Sentiment and Topic Analyses Using Tweets From Ontario, Canada.Int J Public Health. 2022 Feb 21;67:1604658. doi: 10.3389/ijph.2022.1604658. eCollection 2022. Int J Public Health. 2022. PMID: 35264920 Free PMC article.
-
Twitter-based analysis reveals differential COVID-19 concerns across areas with socioeconomic disparities.Comput Biol Med. 2021 May;132:104336. doi: 10.1016/j.compbiomed.2021.104336. Epub 2021 Mar 13. Comput Biol Med. 2021. PMID: 33761419 Free PMC article.
-
The Apple Mobility Trends Data in Human Mobility Patterns during Restrictions and Prediction of COVID-19: A Systematic Review and Meta-Analysis.Healthcare (Basel). 2022 Nov 30;10(12):2425. doi: 10.3390/healthcare10122425. Healthcare (Basel). 2022. PMID: 36553949 Free PMC article. Review.
References
-
- Pan A, Liu L, Wang C, Guo H, Hao X, Wang Q, Huang J, He N, Yu H, Lin X, Wei S, Wu T. Association of public health interventions with the epidemiology of the COVID-19 outbreak in Wuhan, China. JAMA. 2020 May 19;323(19):1915–1923. doi: 10.1001/jama.2020.6130. http://europepmc.org/abstract/MED/32275295 - DOI - PMC - PubMed
-
- Liu Y, Gayle AA, Wilder-Smith A, Rocklöv J. The reproductive number of COVID-19 is higher compared to SARS coronavirus. J Travel Med. 2020 Mar 13;27(2) doi: 10.1093/jtm/taaa021. http://europepmc.org/abstract/MED/32052846 - DOI - PMC - PubMed
-
- Delen D, Eryarsoy E, Davazdahemami B. No place like home: cross-national data analysis of the efficacy of social distancing during the COVID-19 pandemic. JMIR Public Health Surveill. 2020 May 28;6(2):e19862. doi: 10.2196/19862. https://publichealth.jmir.org/2020/2/e19862/ - DOI - PMC - PubMed
-
- Athreya KB, Mather R, Mustre-del-Río J, Sanchez JM. COVID-19 and households’ financial distress: part 2: the spread of COVID-19 and (financial) pre-existing conditions. Federal Reserve Bank of Richmond. 2020. Mar 30, [2020-04-05]. https://www.richmondfed.org/publications/research/
Publication types
MeSH terms
LinkOut - more resources
Full Text Sources
Miscellaneous
