. 2021 Jan 4;131(1):e140281.
doi: 10.1172/JCI140281.

Protein tyrosine phosphatase nonreceptor type 2 controls colorectal cancer development

Affiliations

Protein tyrosine phosphatase nonreceptor type 2 controls colorectal cancer development

Egle Katkeviciute et al. J Clin Invest. .

Abstract

Protein tyrosine phosphatase nonreceptor type 2 (PTPN2) recently emerged as a promising cancer immunotherapy target. We set out to investigate the functional role of PTPN2 in the pathogenesis of human colorectal carcinoma (CRC), as its role in immune-silent solid tumors is poorly understood. We demonstrate that in human CRC, increased PTPN2 expression and activity correlated with disease progression and decreased immune responses in tumor tissues. In particular, stage II and III tumors displayed enhanced PTPN2 protein expression in tumor-infiltrating T cells, and increased PTPN2 levels negatively correlated with expression of PD-1, CTLA4, STAT1, and granzyme A. In vivo, T cell- and DC-specific PTPN2 deletion reduced tumor burden in several CRC models by promoting CD44+ effector/memory T cells, as well as CD8+ T cell infiltration and cytotoxicity in the tumor. In direct relevance to CRC treatment, T cell-specific PTPN2 deletion potentiated anti-PD-1 efficacy and induced antitumor memory formation upon tumor rechallenge in vivo. Our data suggest a role for PTPN2 in suppressing antitumor immunity and promoting tumor development in patients with CRC. Our in vivo results identify PTPN2 as a key player in controlling the immunogenicity of CRC, with the strong potential to be exploited for cancer immunotherapy.

Keywords: Cancer immunotherapy; Colorectal cancer; Gastroenterology; Oncology; T cells.


Conflict of interest statement

Conflict of interest: The authors have declared that no conflict of interest exists.

Figures

Figure 1
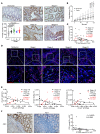
Figure 1. Enhanced PTPN2 expression in human CRC.
(A) Representative images and quantification of PTPN2 IHC staining in nontumor (Non T) and stage I–IV tumor tissue. Scale bars: 50 μm. P values were determined by 1-way ANOVA with Tukey’s multiple-comparison test. Data represent the mean ± SD. (B) PTPN2 phosphatase activity in nontumor and tumor tissue (n = 10 samples per condition). P values were determined by 2-tailed Mann-Whitney U test. (C) Correlation between PTPN2 and p-STAT1 protein quantification and (D) immunofluorescence costaining for CD3 (AF594, green), PTPN2 (AF647, red), and DAPI. Original magnification, 40×; zoom factor, 3.0. P and R2 values in C were determined by linear regression analysis. (E) Correlations between PTPN2 and STAT1 and between CXCL11 and GZMA mRNA expression. P and R2 values were determined by linear regression analysis. (F) Representative images of IHC and correlations between PTPN2 and the checkpoint molecule PD-1 in primary CRC. Scale bars: 100 μm. P values and R2 values were determined by linear regression analysis. HPF, high-power field.
Figure 2
Figure 2. PTPN2 deletion in T cells leads to reduced tumor burden in colitis-associated tumors.
Tumors were induced in Ptpn2fl/fl Cd4Cre+/– mice (ΔT) (n = 10) and littermate control Ptpn2fl/fl mice (WT) (n = 12) using the AOM/DSS model (n = 2 independent experiments). Mixed WT controls (Ptpn2fl/fl Cd4Cre– and Ptpn2fl/fl Cd11cCre–) were used in this experiment. (A) Schematic overview of the experimental procedure. (B) Representative colonoscopy images from untreated and AOM/DSS-treated mice. (C) Quantification of the total number of tumors, stratified by tumor size. P values were determined by 2-tailed Mann-Whitney U test. (D) H&E staining of tumor tissue from Ptpn2fl/fl Cd4Cre+/– and Ptpn2fl/fl mice. Scale bars: 100 μm. (E) Representative images and quantification of CD3 staining in Ptpn2fl/fl Cd4Cre+/– and WT tumor tissue. RNA-Seq was performed on untreated, inflamed nontumor, and inflamed tumor tissue from WT and Ptpn2fl/fl Cd4Cre+/– mice (n = 4 mice each). Scale bars: 50 μm. P values were determined by 1-way ANOVA with Tukey’s multiple-comparison test. (F) Heatmap of mRNA expression levels of T cell–related genes from WT inflamed nontumor tissue (WT non-T), WT inflamed tumor tissue (WT T), Ptpn2fl/fl Cd4Cre+/– untreated tissue (ΔT), Ptpn2fl/fl Cd4Cre+/– inflamed nontumor tissue (ΔT non-T), and Ptpn2fl/fl Cd4Cre+/– inflamed tumor tissue (ΔT T) normalized to the expression levels in colon tissue from water-treated WT mice. False sign rate, *P < 0.01, **P < 0.001, and ***P < 0.0001. Data represent the mean ± SD.
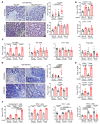
Figure 3
Figure 3. PTPN2 deletion in T cells promotes T cell activation in tumor tissue.
Tumors were induced as described in Figure 2. (A) Representative images and quantification of CD4 IHC staining and flow cytometric analysis of WT and Ptpn2fl/fl Cd4Cre+/– untreated and tumor tissue. Flow cytometric analysis of untreated colon tissue, inflamed nontumor tissue, and inflamed tumor tissue (n = 5 mice in each group). Scale bars: 50 μm. P values were determined by 1-way ANOVA with Tukey’s multiple-comparison test. (B and C) Frequencies of CD4+ T cells, effector/memory CD4+CD44+ T cells (spleen and mLNs), and Th1 cells (CD4+IFN-γ+), Th2 cells (CD4+IL-4+), Th17 cells (CD4+IL-17+), and Tregs (CD4+FoxP3+) (colon). P values were determined by 1-way ANOVA with Tukey’s multiple-comparison test. (D) Localization and quantification of CD8+ cells in Ptpn2fl/fl Cd4Cre+/– and WT untreated and tumor tissue. Scale bars: 50 μm. P values were determined by 1-way ANOVA with Tukey’s multiple-comparison test. (E) Frequencies of effector/memory CD8+CD44+ T cells (spleen and mLNs). P values were determined by 1-way ANOVA with Tukey’s multiple-comparison test. (F) Frequencies of CD8+granzyme B+, CD8+IFN-γ+, and the checkpoint molecule PD-1 on CD4+ and CD8+ T cells. P values were determined by 1-way ANOVA with Tukey’s multiple-comparison test. Data represent the mean ± SD. Freq., frequency.
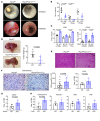
Figure 4
Figure 4. Reduced tumor burden in orthotopic tumor injection and APCmin tumor models upon PTPN2 deletion in T cells.
MC38 tumor cells (300,000 cells) were injected into the cecal wall of WT and Ptpn2fl/fl Cd4Cre+/– mice. Mixed WT controls (Ptpn2fl/fl Cd4Cre– and Ptpn2fl/fl Cd11cCre–) were used in this experiment, therefore, WT quantification in C is the same as the WT quantification in Figure 7F. (A) Representative gross image of cecal tumors from WT and Ptpn2fl/fl Cd4Cre+/– mice (n = 5 mice). (B) Total number of tumors and stratification according to size (n = 10 mice; n = 2 independent experiments) and tumor weight (n = 5 mice). P values were determined by 2-tailed Mann-Whitney U test. (C) Representative images and quantification of IHC staining and flow cytometric analysis of CD8 staining of Ptpn2fl/fl and Ptpn2fl/fl Cd4Cre+/– tumor tissue. Scale bars: 50 μm. P values were determined by 2-tailed Mann-Whitney U test. Frequencies of effector/memory CD8+CD44+ T cells in spleen (D) and of granzyme B, IFN-γ, and PD-1 in tumor (E). P values were determined by 2-tailed Mann-Whitney U test. (F) Number of tumors in the small intestine and spleen weights for Ptpn2fl/fl APCmin and Ptpn2fl/fl Cd4Cre+/– APCmin mice. P values were determined by 2-tailed Mann-Whitney U test. Data represent the mean ± SD.
Figure 5
Figure 5. CD8+ T cells are the key drivers of tumor reduction.
MC38 tumor cells (300,000 cells) were injected s.c. into WT and Ptpn2fl/fl Cd4Cre+/– mice. (A) Representative image of MC38-induced tumors from WT and Ptpn2fl/fl Cd4Cre+/– mice. (B) MC38-induced tumor development (n = 5 WT mice and 10 tumors; n = 4 Ptpn2fl/fl Cd4Cre+/– mice and 8 tumors) over time and tumor weights on the last day of the experiment. P values were determined by 2-tailed Mann-Whitney U test. (C) Scheme of CD8+ T cell depletion and image of representative tumors from IgG isotype control– and anti-CD8–treated WT and Ptpn2fl/fl Cd4Cre+/– mice. (D) Tumor sizes and weights (n = 6 WT IgG–treated mice and 12 tumors; n = 10 mice and 20 tumors for IgG-treated Ptpn2fl/fl Cd4Cre+/– mice, anti-CD8–treated WT mice, and anti-CD8–treated Ptpn2fl/fl Cd4Cre+/– mice; n = 2 independent experiments). P values were determined by 1-way ANOVA with Tukey’s multiple-comparison test. (E) Representative images and quantification of IHC and flow cytometric CD8 staining of WT and Ptpn2fl/fl Cd4Cre+/– mouse tumor tissue from IgG control– and anti–CD8–treated groups. Scale bars: 50 μm. P values were determined by 1-way ANOVA with Tukey’s multiple-comparison test. (F) Inverse correlation of tumor weight and frequency of CD8+ T cells in tumor tissue from WT and Ptpn2fl/fl Cd4Cre+/– mice. P and R2 values were determined by linear regression analysis. (G) Representative gross image of MC38 tumors from IgG isotype control– and anti-CD4–treated WT and Ptpn2fl/fl Cd4Cre+/– mice. (H) Tumor development (n = 5 mice and 10 tumors per group). P values were determined by 1-way ANOVA with Tukey’s multiple-comparison test. Data represent the mean ± SD.
Figure 6
Figure 6. Tumor reduction after therapeutic PTPN2-deficient CD8+ T cell transfer.
(A) Scheme of WT or Ptpn2fl/fl Cd4Cre+/– CD8+ T cell transfer into Rag2–/– mice. (B) Representative image, development curve, and weights of MC38 tumors from mice without T cell transfer (n = 6 mice and 12 tumors), or with either WT CD8+ T cell (n = 5 mice and 10 tumors) or Ptpn2fl/fl Cd4Cre+/– CD8+ (n = 6 mice/ 12 tumors) T cell transfer. P values were determined by 2-tailed Mann-Whitney U test. (C) In vitro killing assay of MC38 and MC38-OVA cells by WT and Ptpn2fl/fl Cd4Cre+/– OT-I T cells. Graphs represent early (annexin V+zombieNIR) and late (annexin V+zombieNIR+) apoptotic cells. P values were determined by 1-way ANOVA with Tukey’s multiple-comparison test. Data represent the mean ± SD. W/O, without addition of T cells.
Figure 7
Figure 7. PTPN2 deletion in DCs leads to reduced tumor load in the AOM/DSS and orthotopic injection models.
Tumor development was induced in WT mice (n = 5 mice) and their Ptpn2fl/fl Cd11cCre+/– littermates (ΔDC) (n = 5 mice) using the AOM/DSS model and the cecal injection model. Mixed WT controls (Ptpn2fl/fl Cd4Cre– and Ptpn2fl/fl Cd11cCre–) were used in these experiments, thus, WT quantification in F is the same as the WT quantification in Figure 4C. (A) Representative colonoscopy images. (B) Quantification of the total tumor numbers and according to tumor size. P values were determined by 2-tailed Mann-Whitney U test. Flow cytometry analysis was performed on healthy colon, inflamed nontumor, and inflamed tumor tissue. (C) Frequencies of CD8+ T cells (colon) and effector/memory CD8+CD44+ T cells (spleen). P values were determined by 2-tailed Mann-Whitney U test. (D) Gross images of ceca and plot of tumor weights for WT and Ptpn2fl/fl Cd11cCre+/– littermate mice. P value was determined by 2-tailed Mann-Whitney U test. (E) H&E staining of tumor tissue from WT and Ptpn2fl/fl Cd11cCre+/– mice. Scale bars: 100 μm. (F) Representative images and analysis of IHC and flow cytometric frequency of CD8 staining in WT and Ptpn2fl/fl Cd11cCre+/– mouse tumor tissue. Scale bars: 50 μm. P values were determined by 2-tailed Mann-Whitney U test. (G and H) Frequencies of effector/memory CD8+CD44+ T cells (spleen) and the cytotoxicity markers granzyme B, perforin, IFN-γ, and TNF (tumor). P values were determined by 2-tailed Mann-Whitney U test. Data represent the mean ± SD.
Figure 8
Figure 8. PTPN2 deficiency and anti–PD-1 therapy lead to an enhanced synergetic antitumor response.
(A) Schematic overview of the treatment and representative gross images of tumors from WT and Ptpn2fl/fl Cd4Cre+/– mice treated with IgG control or anti–PD-1 antibody. (B) Tumor development and weights (n = 10 mice and 20 tumors; n = 2 independent experiments). P values were determined by 1-way ANOVA with Tukey’s multiple-comparison test. (C) H&E staining of tumor tissue from WT and Ptpn2fl/fl Cd4Cre+/– mice. Scale bars: 100 μm. (D) Representative images of IHC staining and flow cytometric frequency of CD8 staining of WT and Ptpn2fl/fl Cd4Cre+/– mice tumor tissue. Scale bars: 100 μm. 1-way ANOVA with Tukey’s multiple-comparison test. (E) Frequencies of PD-1, CD44, granzyme B, and perforin on CD8+ T cells from IgG control and anti–PD-1 groups. P values were determined by 1-way ANOVA with Tukey’s multiple-comparison test. (F) Outline of the primary and memory response experiment and tumor development curve for Ptpn2fl/fl Cd4Cre+/– mice (first primary response, n = 7 mice and 14 tumors; memory n = 7 mice and 9 tumors; second primary response n = 13 mice and 13 tumors; n = 2 independent experiments). P values were determined by 1-way ANOVA with Tukey’s multiple-comparison test. Data represent the mean ± SD.

Similar articles

Cited by

References

    1. Ciardiello D, et al. Immunotherapy of colorectal cancer: Challenges for therapeutic efficacy. Cancer Treat Rev. 2019;76:22–32. doi: 10.1016/j.ctrv.2019.04.003. - DOI - PubMed
    1. Ganesh K, et al. Immunotherapy in colorectal cancer: rationale, challenges and potential. Nat Rev Gastroenterol Hepatol. 2019;16(6):361–375. doi: 10.1038/s41575-019-0126-x. - DOI - PMC - PubMed
    1. Bray F, Ferlay J, Soerjomataram I, Siegel RL, Torre LA, Jemal A. Global cancer statistics 2018: GLOBOCAN estimates of incidence and mortality worldwide for 36 cancers in 185 countries. CA Cancer J Clin. 2018;68(6):394–424. doi: 10.3322/caac.21492. - DOI - PubMed
    1. Montalban-Arques A, Scharl M. Intestinal microbiota and colorectal carcinoma: implications for pathogenesis, diagnosis, and therapy. EBioMedicine. 2019;carcinoma;48:648–655. - PMC - PubMed
    1. Rawla P, Barsouk A, Hadjinicolaou AV, Barsouk A. Immunotherapies and targeted therapies in the treatment of metastatic colorectal cancer. Med Sci (Basel) 2019;7(8):E83. - PMC - PubMed

Publication types

MeSH terms

Substances