. 2020 Nov 5;5(21):e138751.
doi: 10.1172/jci.insight.138751.

In utero human intestine harbors unique metabolome, including bacterial metabolites

Affiliations

In utero human intestine harbors unique metabolome, including bacterial metabolites

Yujia Li et al. JCI Insight. .

Abstract

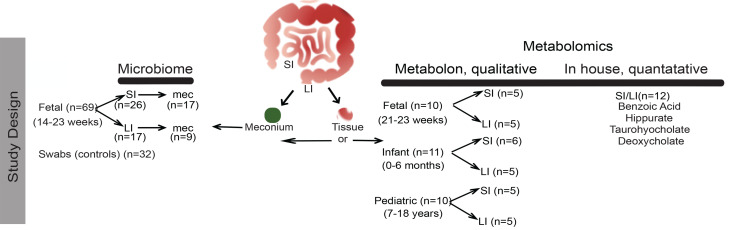
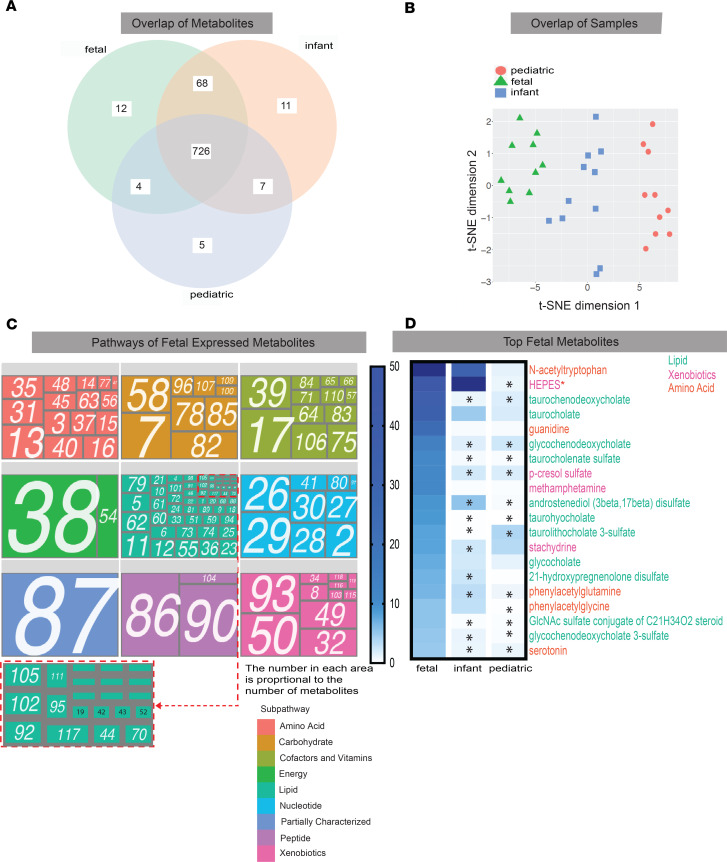
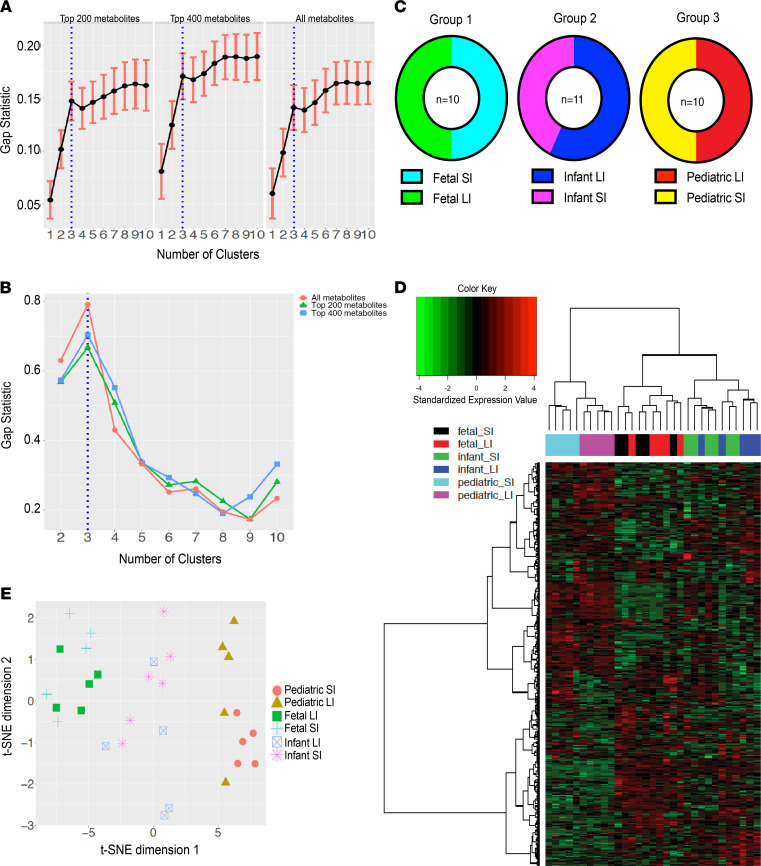
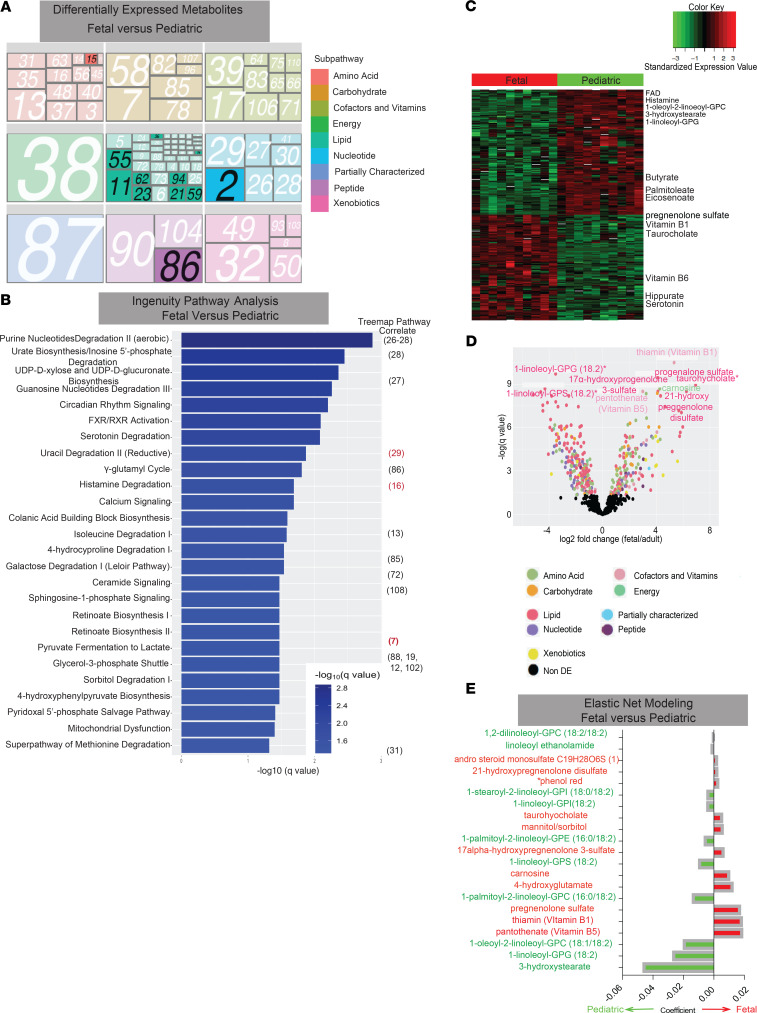
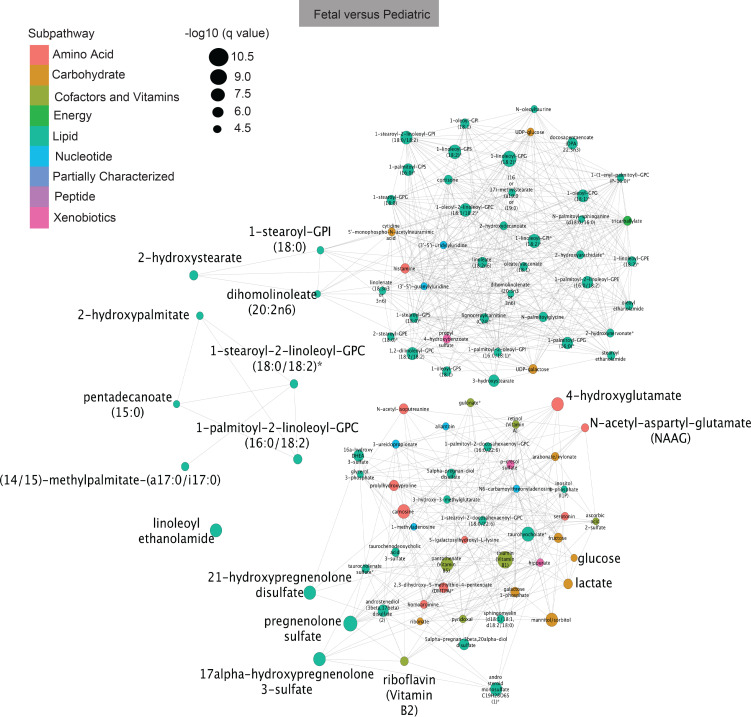
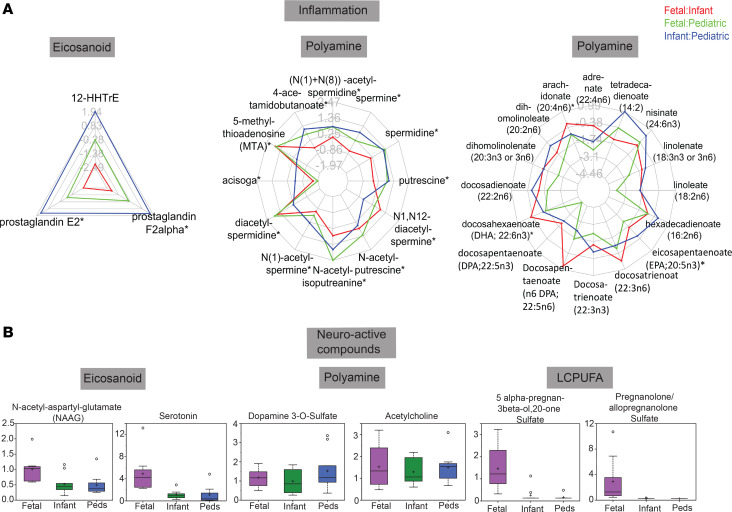
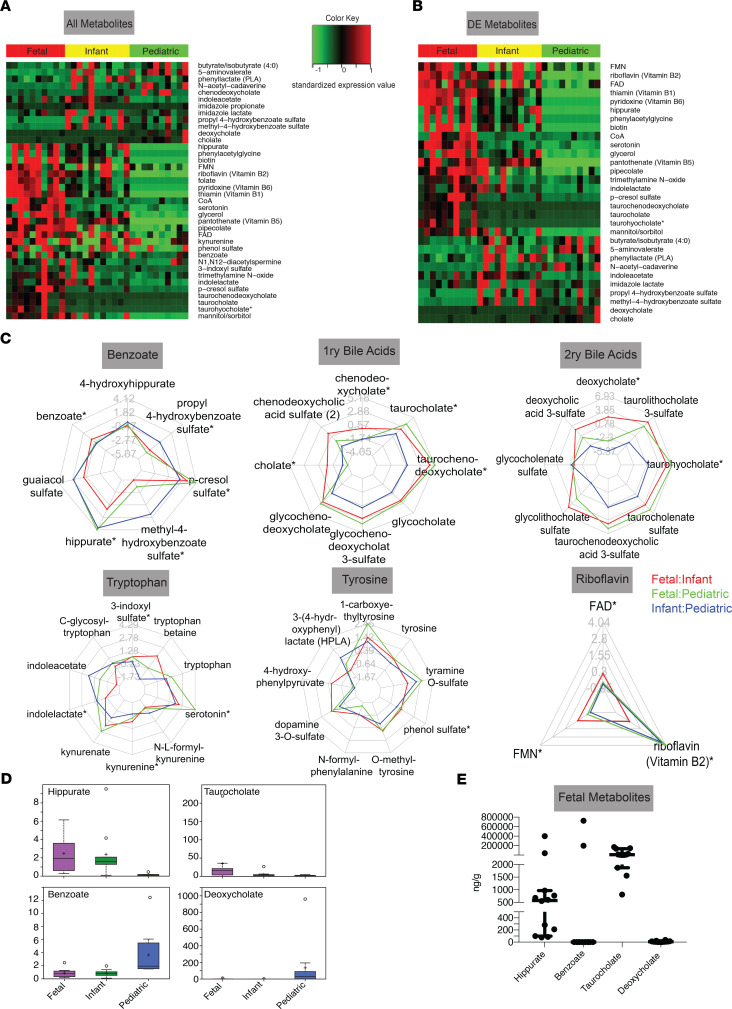
Symbiotic microbial colonization through the establishment of the intestinal microbiome is critical to many intestinal functions, including nutrient metabolism, intestinal barrier integrity, and immune regulation. Recent studies suggest that education of intestinal immunity may be ongoing in utero. However, the drivers of this process are unknown. The microbiome and its byproducts are one potential source. Whether a fetal intestinal microbiome exists is controversial, and whether microbially derived metabolites are present in utero is unknown. Here, we aimed to determine whether bacterial DNA and microbially derived metabolites can be detected in second trimester human intestinal samples. Although we were unable to amplify bacterial DNA from fetal intestines, we report a fetal metabolomic intestinal profile with an abundance of bacterially derived and host-derived metabolites commonly produced in response to microbiota. Though we did not directly assess their source and function, we hypothesize that these microbial-associated metabolites either come from the maternal microbiome and are vertically transmitted to the fetus to prime the fetal immune system and prepare the gastrointestinal tract for postnatal microbial encounters or are produced locally by bacteria that were below our detection threshold.

Keywords: Gastroenterology; Intermediary metabolism; Metabolism.


Conflict of interest statement

ex

Figures

Figure 1
Figure 1. Study demographics.
Workflow of sample cohort and delineation of microbiome or metabolomic analysis. Metadata and identification as either 16S or metabolomic analysis cohorts for all samples collected. SI, small intestine; LI, large intestine; Mec, meconium.
Figure 2
Figure 2. Description of metabolites expressed in fetal intestines.
(A) Venn diagram of metabolites expressed both uniquely and shared between cohorts. (B) t-SNE analysis of bulk metabolomic profiles between cohorts. (C) Tree map depiction of metabolic pathways expressed in fetal intestine. Numbers correspond to pathways described in Supplemental Table 1. (D) Heatmap showing normalized expression of the top 20 fetal expressed metabolites. Labels color-coded to superpathways from tree maps in Figure 1C. Student’s 2-tailed t test with B-H correction for multiple comparison was used to compare expression values. *P < 0.05. Red asterisk indicates metabolite from media.
Figure 3
Figure 3. Metabolite clustering.
(A) Gap statistics from 200, 400, and all most variable metabolites (determined by median absolute deviation). (B) Prediction strength for 200, 400, and all most variable metabolites. (C) K-means clustering was performed to generate 3 subgroups that were comprised entirely of age-matched intestinal tissue. (D) Hierarchical clustering with Ward linkage of samples using all metabolites. (E) t-SNE plot using all metabolites.
Figure 4
Figure 4. Differential expression of individual metabolites and metabolic pathways.
(A) Tree map of differentially expressed subpathways between fetal and pediatric intestines. Numbers correspond to pathways described in Supplemental Table 1. Darker shades and black numbers indicate statistically significant differentially expressed pathways using Fisher’s exact test (P < 0.1). (B) Integrated pathway analysis for differentially expressed pathways between fetal and pediatric samples. Bar length is indicative of more significant q value. Numbers on right-hand side correlate to tree map pathways in Supplemental Table 1. (C) Heatmap of differential expression of individual metabolites. Each column represents one sample and each row represents one metabolite. For a complete list of metabolites, see Supplemental Table 5. (D) Volcano plot of differentially expressed metabolites between fetal and pediatric samples. Metabolites with positive x axis are those with higher expression in fetus. The 8 most significant metabolites are labeled with the metabolite name. All significant differentially expressed metabolites (q < 0.05) are color-coded by superpathway from A. (E) Top 20 metabolites from elastic net model. Red asterisk indicates metabolite from media.
Figure 5
Figure 5. Network analysis of fetal versus pediatric metabolites.
Tanimoto network analysis for fetal versus pediatric individual metabolites. Size of circle reflective of q value, color of circle reflective of superpathway.
Figure 6
Figure 6. Inflammatory and neuroactive metabolic signatures.
(A) Radar plots of metabolites implicated in inflammation. (B) Box-and-whisker plots of individual metabolite expression for neuroactive metabolites. *P < 0.05.
Figure 7
Figure 7. Microbial metabolite signatures in fetal, infant, and pediatric intestines.
(A) Relative expression of all metabolites produced by eithermicrobes or the host in response to microbial presence identified from a literature search in each sample set. (B) Differentially expressed microbial-associated metabolites. (C) Radar plots for expression of microbial-associated metabolites in 6 families. (D) Box-and-whisker plots of relativevalues of microbial metabolites. (E) Quantitative values of fetal microbial-associated metabolites. *P < 0.05.

References

    1. Simonsen KA, Anderson-Berry AL, Delair SF, Davies HD. Early-onset neonatal sepsis. Clin Microbiol Rev. 2014;27(1):21–47. doi: 10.1128/CMR.00031-13. - DOI - PMC - PubMed
    1. Stras SF, et al. Maturation of the human intestinal immune system occurs early in fetal development. Dev Cell. 2019;51(3):357–373.e5. doi: 10.1016/j.devcel.2019.09.008. - DOI - PubMed
    1. Schreurs RRCE, et al. Human fetal TNF-α-cytokine-producing CD4+ effector memory T cells promote intestinal development and mediate inflammation early in life. Immunity. 2019;50(2):462–476.e8. doi: 10.1016/j.immuni.2018.12.010. - DOI - PubMed
    1. Li N, et al. Memory CD4+ T cells are generated in the human fetal intestine. Nat Immunol. 2019;20(3):301–312. doi: 10.1038/s41590-018-0294-9. - DOI - PMC - PubMed
    1. Frascoli M, et al. Alloreactive fetal T cells promote uterine contractility in preterm labor via IFN-γ and TNF-α. Sci Transl Med. 2018;10(438):eaan2263. doi: 10.1126/scitranslmed.aan2263. - DOI - PMC - PubMed

Publication types

MeSH terms