. 2020 Oct 2;69(39):1410-1415.
doi: 10.15585/mmwr.mm6939e2.

COVID-19 Trends Among School-Aged Children - United States, March 1-September 19, 2020

COVID-19 Trends Among School-Aged Children - United States, March 1-September 19, 2020

Rebecca T Leeb et al. MMWR Morb Mortal Wkly Rep. .

Erratum in

  • Erratum: Vol. 69, No. 39.
    [No authors listed] [No authors listed] MMWR Morb Mortal Wkly Rep. 2021 Jan 1;69(5152):1661-1662. doi: 10.15585/mmwr.mm695152a5. MMWR Morb Mortal Wkly Rep. 2021. PMID: 33382677 Free PMC article. No abstract available.

Abstract

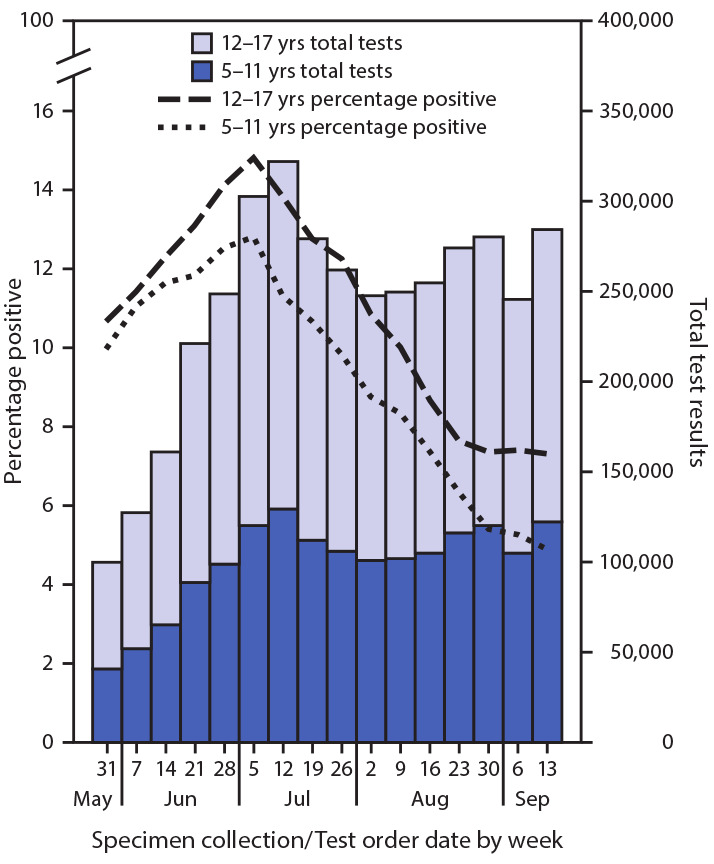
Approximately 56 million school-aged children (aged 5-17 years) resumed education in the United States in fall 2020.* Analysis of demographic characteristics, underlying conditions, clinical outcomes, and trends in weekly coronavirus disease 2019 (COVID-19) incidence during March 1-September 19, 2020 among 277,285 laboratory-confirmed cases in school-aged children in the United States might inform decisions about in-person learning and the timing and scaling of community mitigation measures. During May-September 2020, average weekly incidence (cases per 100,000 children) among adolescents aged 12-17 years (37.4) was approximately twice that of children aged 5-11 years (19.0). In addition, among school-aged children, COVID-19 indicators peaked during July 2020: weekly percentage of positive SARS-CoV-2 test results increased from 10% on May 31 to 14% on July 5; SARS-CoV-2 test volume increased from 100,081 tests on May 31 to 322,227 on July 12, and COVID-19 incidence increased from 13.8 per 100,000 on May 31 to 37.9 on July 19. During July and August, test volume and incidence decreased then plateaued; incidence decreased further during early September and might be increasing. Percentage of positive test results decreased during August and plateaued during September. Underlying conditions were more common among school-aged children with severe outcomes related to COVID-19: among school-aged children who were hospitalized, admitted to an intensive care unit (ICU), or who died, 16%, 27%, and 28%, respectively, had at least one underlying medical condition. Schools and communities can implement multiple, concurrent mitigation strategies and tailor communications to promote mitigation strategies to prevent COVID-19 spread. These results can provide a baseline for monitoring trends and evaluating mitigation strategies.


Conflict of interest statement

All authors have completed and submitted the International Committee of Medical Journal Editors form for disclosure of potential conflicts of interest. No potential conflicts of interest were disclosed.

Figures

FIGURE 1
FIGURE 1
COVID-19 incidence among school-aged children aged 5–11 years (N = 101,503) and 12–17 years (N = 175,782), by week — United States, March 1–September 19, 2020 Sources: CDC COVID-19 case report form. https://wwwn.cdc.gov/nndss/covid-19-response.html. CDC National Notifiable Disease Surveillance System. https://wwwn.cdc.gov/nndss. Abbreviation: COVID-19 = coronavirus disease 2019. * Incidence = cases per 100,000, calculated using 2018 population from https://datacenter.kidscount.org/. Data included through September 19, 2020, so that each week has a full 7 days of data.
FIGURE 2
FIGURE 2
Percentage of SARS-CoV-2 reverse transcription–polymerase chain reaction (RT-PCR) tests with positive results and test volume, by week for school-aged children aged 5–11 years and 12–17 years — United States, May 31–September 19, 2020 Abbreviation: COVID-19 = coronavirus disease 2019. * From COVID-19 electronic laboratory reporting data submitted by state health departments for 37 states and from data submitted directly by public health, commercial, and reference laboratories for 13 states, Puerto Rico, and the District of Columbia, using specimen collection or test order date. The data represent percentage of tests, not of individual persons, with a positive result and include RT-PCR tests but not antigen or point-of-care tests.

References

    1. Stokes EK, Zambrano LD, Anderson KN, et al. Coronavirus disease 2019 case surveillance—United States, January 22–May 30, 2020. MMWR Morb Mortal Wkly Rep 2020;69:759–65. 10.15585/mmwr.mm6924e2 - DOI - PMC - PubMed
    1. Bialek S, Gierke R, Hughes M, McNamara LA, Pilishvili T, Skoff T; CDC COVID-19 Response Team. Coronavirus disease 2019 in children—United States, February 12–April 2, 2020. MMWR Morb Mortal Wkly Rep 2020;69:422–6. 10.15585/mmwr.mm6914e4 - DOI - PMC - PubMed
    1. Bixler D, Miller AD, Mattison CP, et al.; Pediatric Mortality Investigation Team. SARS-CoV-2-associated deaths among persons aged <21 years— United States, February 12–July 31, 2020. MMWR Morb Mortal Wkly Rep 2020;69:1324–9. 10.15585/mmwr.mm6937e4 - DOI - PubMed
    1. Godfred-Cato S, Bryant B, Leung J, et al.; California MIS-C Response Team. COVID-19–associated multisystem inflammatory syndrome in children—United States, March–July 2020. MMWR Morb Mortal Wkly Rep 2020;69:1074–80. 10.15585/mmwr.mm6932e2 - DOI - PMC - PubMed
    1. Boehmer TK, DeVies J, Caruso E, et al. Changing age distribution of the COVID-19 pandemic—United States, May–August 2020. MMWR Morb Mortal Wkly Rep 2020;69. Epub September 23, 2020. 10.15585/mmwr.mm6939e1 - DOI - PMC - PubMed

MeSH terms