

Deaths and Years of Potential Life Lost From Excessive Alcohol Use - United States, 2011-2015
- PMID: 33001874
- PMCID: PMC7537556
- DOI: 10.15585/mmwr.mm6939a6
Deaths and Years of Potential Life Lost From Excessive Alcohol Use - United States, 2011-2015
Abstract
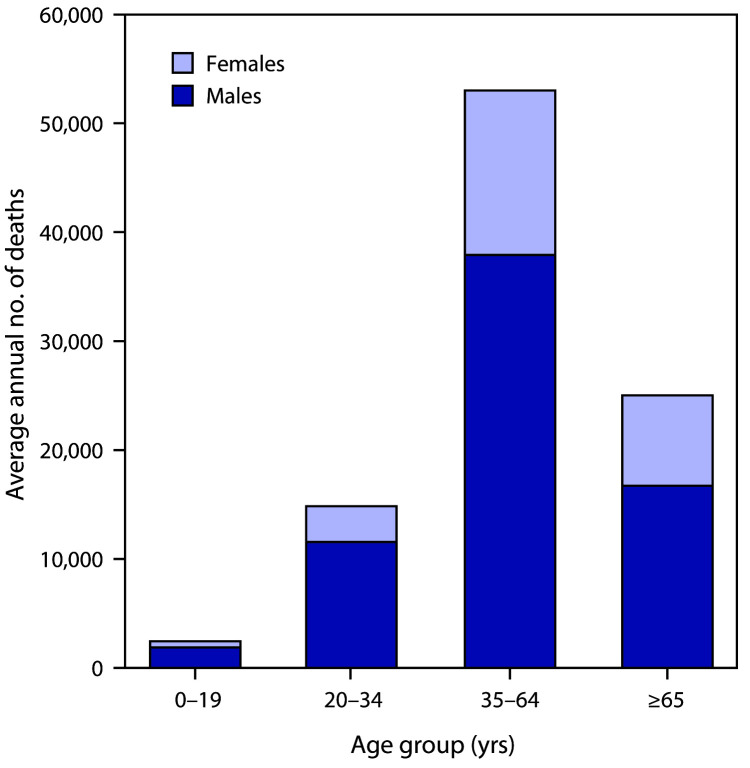
Excessive alcohol use is a leading cause of preventable death in the United States (1) and costs associated with it, such as those from losses in workplace productivity, health care expenditures, and criminal justice, were $249 billion in 2010 (2). CDC used the Alcohol-Related Disease Impact (ARDI) application* to estimate national and state average annual alcohol-attributable deaths and years of potential life lost (YPLL) during 2011-2015, including deaths from one's own excessive drinking (e.g., liver disease) and from others' drinking (e.g., passengers killed in alcohol-related motor vehicle crashes). This study found an average of 95,158 alcohol-attributable deaths (261 deaths per day) and 2.8 million YPLL (29 years of life lost per death, on average) in the United States each year. Of all alcohol-attributable deaths, 51,078 (53.7%) were caused by chronic conditions, and 52,921 (55.6%) involved adults aged 35-64 years. Age-adjusted alcohol-attributable deaths per 100,000 population ranged from 20.8 in New York to 53.1 in New Mexico. YPLL per 100,000 population ranged from 631.9 in New York to 1,683.5 in New Mexico. Implementation of effective strategies for preventing excessive drinking, including those recommended by the Community Preventive Services Task Force (e.g., increasing alcohol taxes and regulating the number and concentration of alcohol outlets), could reduce alcohol-attributable deaths and YPLL.†.
Conflict of interest statement
All authors have completed and submitted the International Committee of Medical Journal Editors form for disclosure of potential conflicts of interest. Timothy Stockwell reports grants and personal fees from Alko, Finland, outside the submitted work. Richard Saitz reports nonfinancial support from Alkermes; personal fees from UpToDate and Massachusetts Medical Society; support and consulting fees from the National Institute on Drug Abuse, the National Institute on Alcohol Abuse and Alcoholism, and the Patient-Centered Outcomes Research Institute; travel support and consulting fees from the American Medical Association, the American Society of Addiction Medicine, Wolters Kluwer, National Council on Behavioral Healthcare, the International Network on Brief Intervention for Alcohol and other drugs, Systembolaget, Kaiser Permanente, RAND, the Institute for Research and Training in the Addictions, the National Council on Behavioral Healthcare, Charles University (Czech Republic), National Committee on Quality Assurance, and the University of Oregon; and salary support from Burroughs Wellcome Fund. No other potential conflicts of interest were disclosed.
Figures
Corrected and republished from
-
Deaths and Years of Potential Life Lost From Excessive Alcohol Use - United States, 2011-2015.MMWR Morb Mortal Wkly Rep. 2020 Jul 31;69(30):981-987. doi: 10.15585/mmwr.mm6930a1. MMWR Morb Mortal Wkly Rep. 2020. Corrected and republished in: MMWR Morb Mortal Wkly Rep. 2020 Oct 02;69(39):1428-1433. doi: 10.15585/mmwr.mm6939a6. PMID: 32730240 Free PMC article. Corrected and republished.
References
-
- Smith GS, Branas CC, Miller TR. Fatal nontraffic injuries involving alcohol: a metaanalysis. Ann Emerg Med 1999;33:659–68. - PubMed
Publication types
MeSH terms
LinkOut - more resources
Full Text Sources
Medical
