

Ganglion cells and displaced amacrine cells density in the retina of the collared peccary (Pecari tajacu)
- PMID: 33002017
- PMCID: PMC7529232
- DOI: 10.1371/journal.pone.0239719
Ganglion cells and displaced amacrine cells density in the retina of the collared peccary (Pecari tajacu)
Abstract
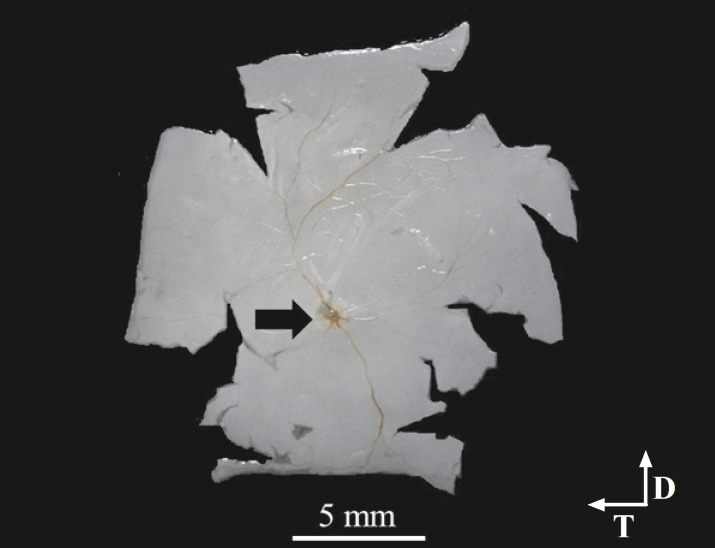
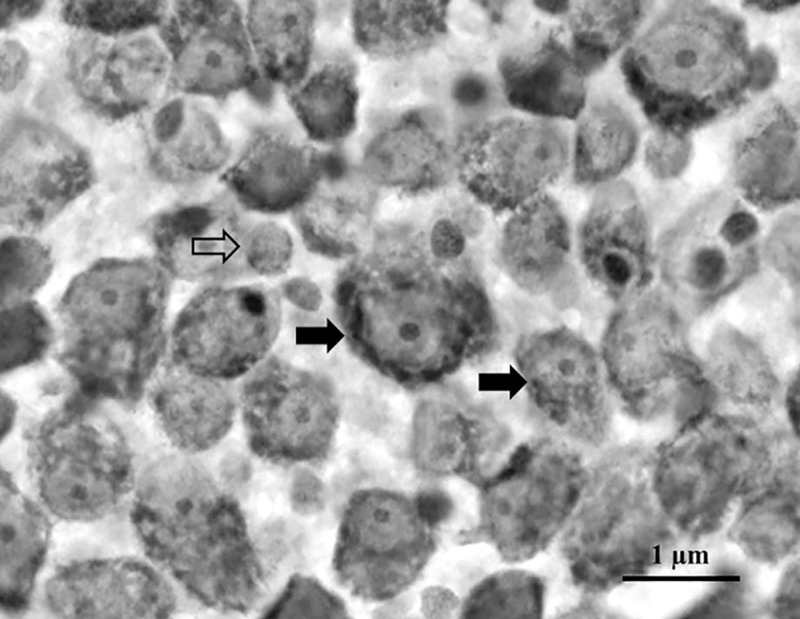
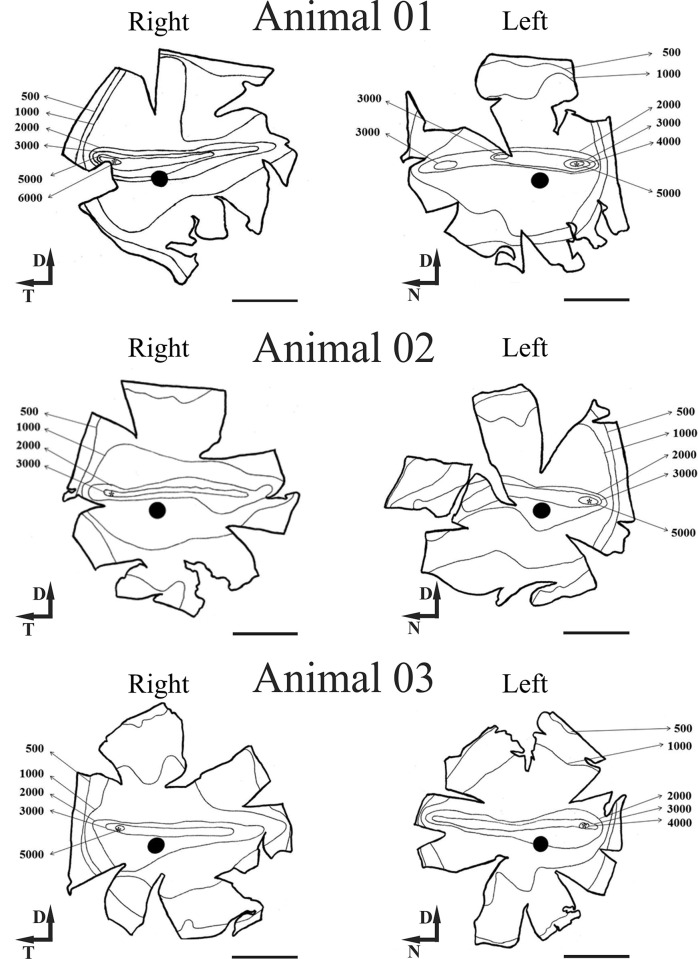
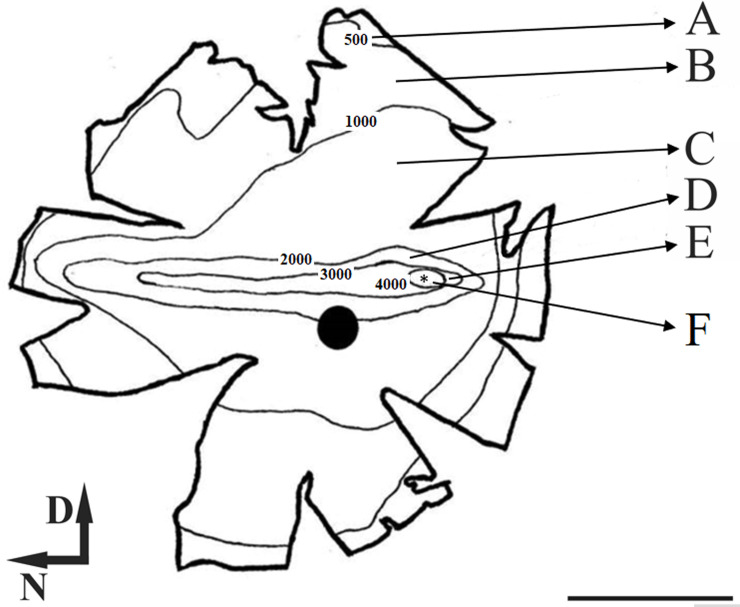
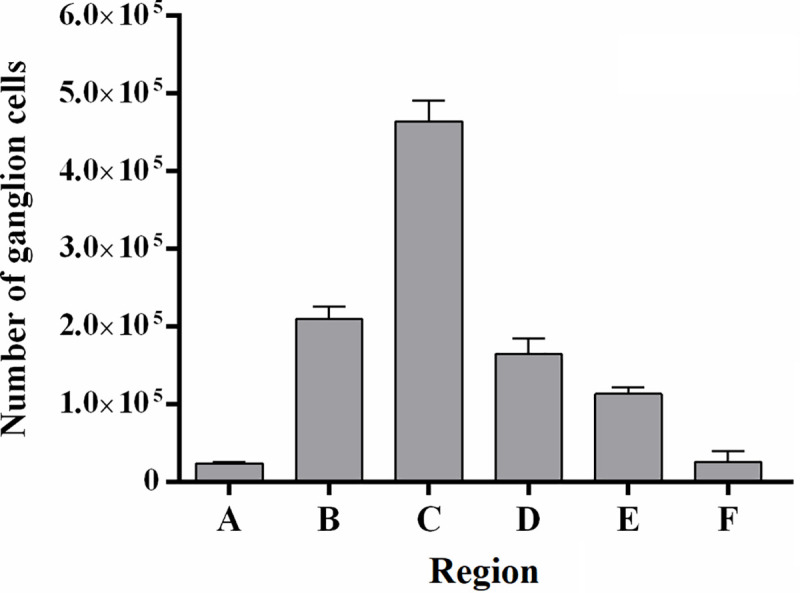
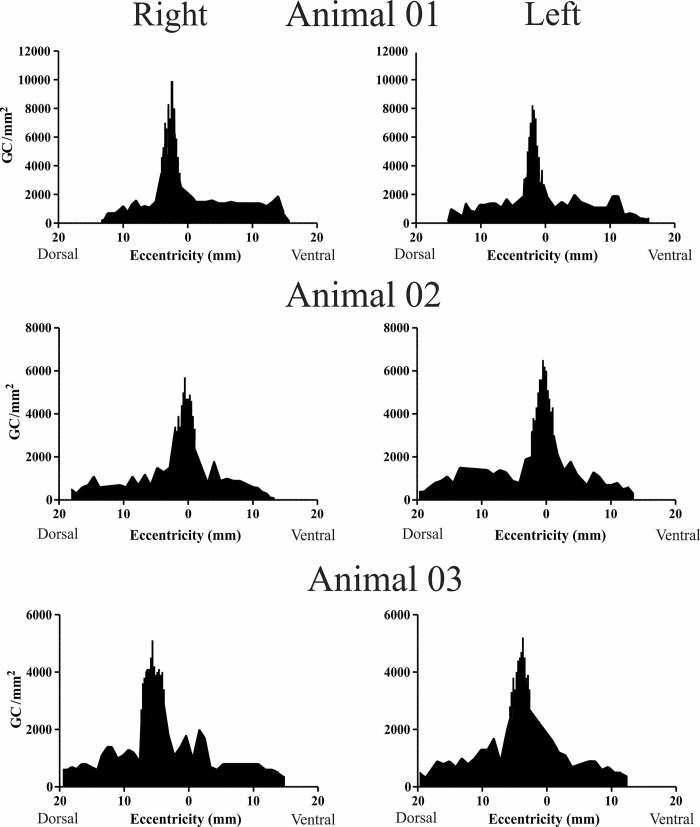
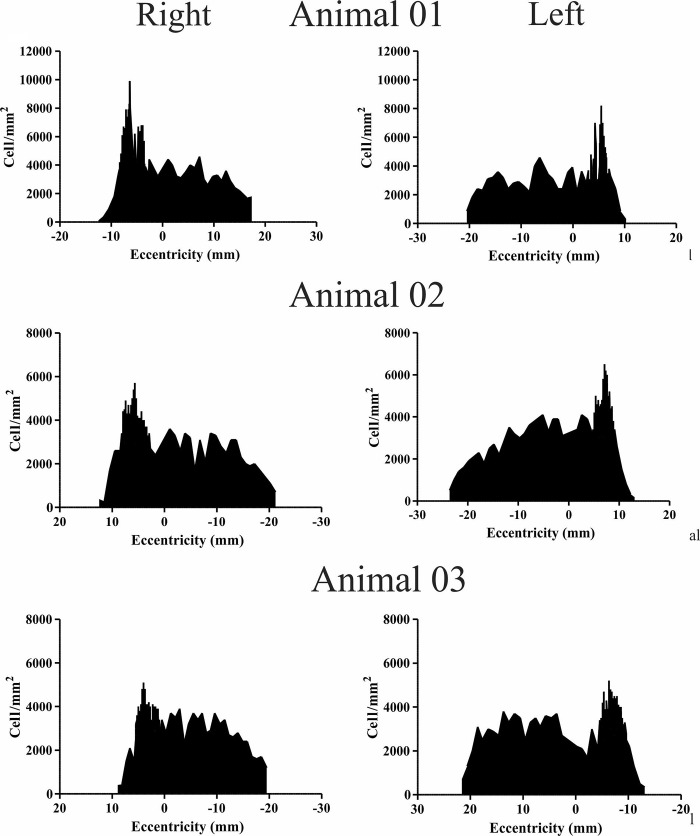
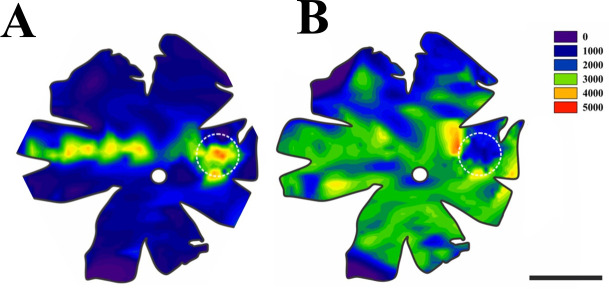
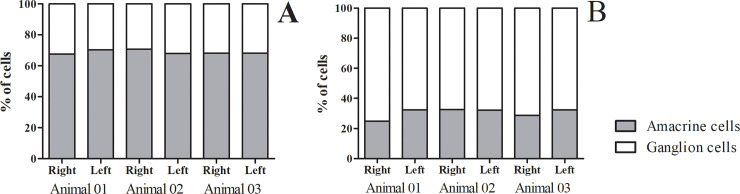
In the present study, we investigated the topographical distribution of ganglion cells and displaced amacrine cells in the retina of the collared peccary (Pecari tajacu), a diurnal neotropical mammal of the suborder Suina (Order Artiodactyla) widely distributed across central and mainly South America. Retinas were prepared and processed following the Nissl staining method. The number and distribution of retinal ganglion cells and displaced amacrine cells were determined in six flat-mounted retinas from three animals. The average density of ganglion cells was 351.822 ± 31.434 GC/mm2. The peccary shows a well-developed visual streak. The average peak density was 6,767 GC/mm2 and located within the visual range and displaced temporally as an area temporalis. Displaced amacrine cells have an average density of 300 DAC/mm2, but the density was not homogeneous along the retina, closer to the center of the retina the number of cells decreases and when approaching the periphery the density increases, in addition, amacrine cells do not form retinal specialization like ganglion cells. Outside the area temporalis, amacrine cells reach up to 80% in the ganglion cell layer. However, in the region of the area temporalis, the proportion of amacrine cells drops to 32%. Thus, three retinal specializations were found in peccary's retina by ganglion cells: visual streak, area temporalis and dorsotemporal extension. The topography of the ganglion cells layer in the retina of the peccary resembles other species of Order Artiodactyla already described and is directly related to its evolutionary history and ecology of the species.
Conflict of interest statement
The authors have declared that no competing interests exist.
Figures
Similar articles
-
Ganglion cell and displaced amacrine cell density distribution in the retina of the howler monkey (Alouatta caraya).PLoS One. 2014 Dec 29;9(12):e115291. doi: 10.1371/journal.pone.0115291. eCollection 2014. PLoS One. 2014. PMID: 25546077 Free PMC article.
-
Immuocytochemical analysis of spatial organization of photoreceptors and amacrine and ganglion cells in the tiger salamander retina.Vis Neurosci. 2004 Mar-Apr;21(2):157-66. doi: 10.1017/s0952523804042075. Vis Neurosci. 2004. PMID: 15259567
-
The neurons of the retinal ganglion cell layer of the guinea pig: quantitative analysis of their distribution and size.Braz J Med Biol Res. 1991;24(2):199-214. Braz J Med Biol Res. 1991. PMID: 1726652
-
Use of wildlife as an alternative protein source: Collared peccary meat.Meat Sci. 2022 Oct;192:108895. doi: 10.1016/j.meatsci.2022.108895. Epub 2022 Jun 18. Meat Sci. 2022. PMID: 35752060 Review.
-
Natural Habitat, Housing, and Restraint of Six Selected Neotropical Animals in Trinidad and Tobago with the Potential for Domestication.Scientifica (Cairo). 2020 Mar 26;2020:9741762. doi: 10.1155/2020/9741762. eCollection 2020. Scientifica (Cairo). 2020. PMID: 32300488 Free PMC article. Review.
Cited by
-
Inhibition of cGMP-Signalling Rescues Retinal Ganglion Cells From Axotomy-Induced Degeneration.J Neurochem. 2025 Apr;169(4):e70072. doi: 10.1111/jnc.70072. J Neurochem. 2025. PMID: 40270249 Free PMC article.
-
Loss of Stim2 in zebrafish induces glaucoma-like phenotype.Sci Rep. 2024 Oct 18;14(1):24442. doi: 10.1038/s41598-024-74909-0. Sci Rep. 2024. PMID: 39424970 Free PMC article.
-
Enhanced glaucomatous damage accompanied by glial response in a new multifactorial mouse model.Front Immunol. 2023 Jan 17;13:1017076. doi: 10.3389/fimmu.2022.1017076. eCollection 2022. Front Immunol. 2023. PMID: 36733392 Free PMC article.
-
Evidence of regional specializations in regenerated zebrafish retina.Exp Eye Res. 2021 Nov;212:108789. doi: 10.1016/j.exer.2021.108789. Epub 2021 Oct 13. Exp Eye Res. 2021. PMID: 34653519 Free PMC article. Review.
References
-
- Do-Nascimento JL, Do-Nascimento RS, Damasceno BA, Silveira LC. The neurons of the retinal ganglion cell layer of the guinea pig: quantitative analysis of their distribution and size. Braz J Med Biol Res. 1991;24: 199–214. - PubMed
-
- da Rocha EG, Freire MAM, Bahia CP, Pereira A, Sosthenes MCK, Silveira LCL, et al. Dendritic structure varies as a function of eccentricity in V1: a quantitative study of NADPH diaphorase neurons in the diurnal South American rodent agouti, Dasyprocta prymnolopha. Neuroscience. 2012;216: 94–102. 10.1016/j.neuroscience.2012.04.042 - DOI - PubMed
-
- dos Reis JWL, de Carvalho WA, Saito CA, Silveira LCL. Morphology of horizontal cells in the retina of the capuchin monkey, Cebus apella: how many horizontal cell classes are found in dichromatic primates? J Comp Neurol. 2002;443: 105–123. - PubMed
Publication types
MeSH terms
LinkOut - more resources
Full Text Sources
Miscellaneous
