

Data-Driven Patient Clustering and Differential Clinical Outcomes in the Brigham and Women's Rheumatoid Arthritis Sequential Study Registry
- PMID: 33002337
- PMCID: PMC8048846
- DOI: 10.1002/acr.24471
Data-Driven Patient Clustering and Differential Clinical Outcomes in the Brigham and Women's Rheumatoid Arthritis Sequential Study Registry
Abstract
Objective: To use unbiased, data-driven, principal component (PC) and cluster analysis to identify patient phenotypes of rheumatoid arthritis (RA) that might exhibit distinct trajectories of disease progression, response to treatment, and risk for adverse events.
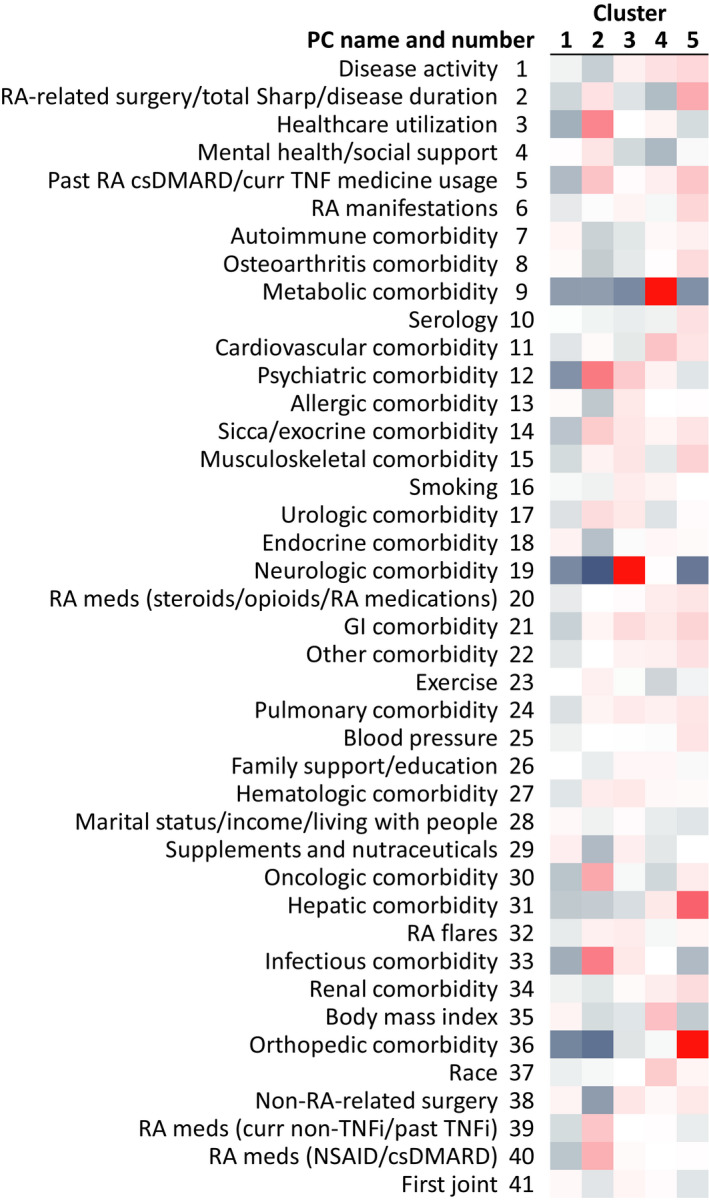
Methods: Patient demographic, socioeconomic, health, and disease characteristics recorded at entry into a large, single-center, prospective observational registry cohort, the Brigham and Women's Rheumatoid Arthritis Sequential Study (BRASS), were harmonized using PC analysis to reduce dimensionality and collinearity. The number of PCs was established by eigenvalue >1, cumulative variance, and interpretability. The resulting PCs were used to cluster patients using a K-means approach. Longitudinal clinical outcomes were compared between the clusters over 2 years.
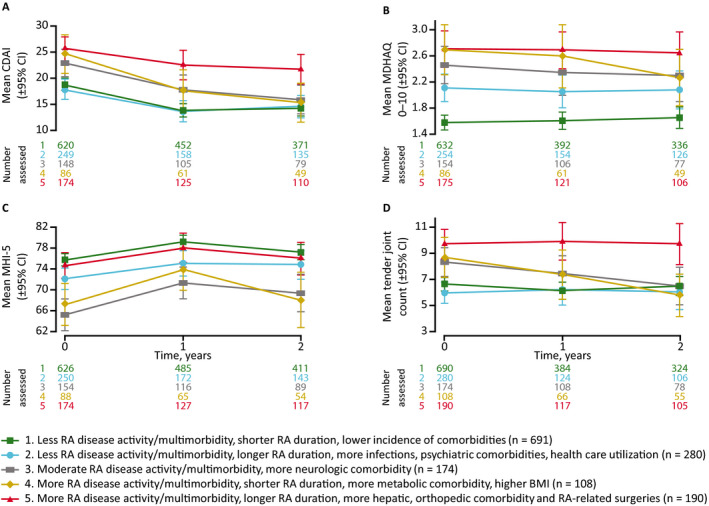
Results: Analysis of 142 variables from 1,443 patients identified 41 PCs that accounted for 77% of the cumulative variance in the data set. Cluster analysis distinguished 5 patient clusters: 1) less RA disease activity/multimorbidity, shorter RA duration, lower incidence of comorbidities; 2) less RA disease activity/multimorbidity, longer RA duration, more infections, psychiatric comorbidities, health care utilization; 3) moderate RA disease activity/multimorbidity, more neurologic comorbidity; 4) more RA disease activity/multimorbidity, shorter RA duration, more metabolic comorbidity, higher body mass index; 5) more RA disease activity/multimorbidity, longer RA duration, more hepatic, orthopedic comorbidity and RA-related surgeries. The clusters exhibited differences in clinical outcomes over 2 years of follow-up.
Conclusion: Data-driven analysis of the BRASS registry identified 5 distinct phenotypes of RA. These results illustrate the potential of data-driven patient profiling as a tool to support personalized medicine in RA. Validation in an independent data set is ongoing.
© 2020 The Authors. Arthritis Care & Research published by Wiley Periodicals LLC on behalf of American College of Rheumatology.
Figures

Similar articles
-
The longitudinal effect of biologic use on patient outcomes (disease activity, function, and disease severity) within a rheumatoid arthritis registry.Clin Rheumatol. 2019 Nov;38(11):3081-3092. doi: 10.1007/s10067-019-04649-4. Epub 2019 Jul 29. Clin Rheumatol. 2019. PMID: 31353421
-
Factors associated with attrition in a longitudinal rheumatoid arthritis registry.Arthritis Care Res (Hoboken). 2013 Jul;65(7):1183-9. doi: 10.1002/acr.21940. Arthritis Care Res (Hoboken). 2013. PMID: 23335345
-
Association of anti-cyclic citrullinated protein antibodies, erosions, and rheumatoid factor with disease activity and work productivity: A patient registry study.Semin Arthritis Rheum. 2018 Apr;47(5):630-638. doi: 10.1016/j.semarthrit.2017.10.009. Epub 2017 Oct 13. Semin Arthritis Rheum. 2018. PMID: 29241640
-
Multimorbidity in Rheumatoid Arthritis: Literature Review and Future Directions.Curr Rheumatol Rep. 2024 Jan;26(1):24-35. doi: 10.1007/s11926-023-01121-w. Epub 2023 Nov 23. Curr Rheumatol Rep. 2024. PMID: 37995046 Free PMC article. Review.
-
Databases of patients with early rheumatoid arthritis in the USA.Clin Exp Rheumatol. 2003 Sep-Oct;21(5 Suppl 31):S146-53. Clin Exp Rheumatol. 2003. PMID: 14969067 Review.
Cited by
-
Researchers in rheumatology should avoid categorization of continuous predictor variables.BMC Med Res Methodol. 2023 Apr 26;23(1):104. doi: 10.1186/s12874-023-01926-4. BMC Med Res Methodol. 2023. PMID: 37101144 Free PMC article.
-
Assessing clusters of comorbidities in rheumatoid arthritis: a machine learning approach.Arthritis Res Ther. 2023 Nov 22;25(1):224. doi: 10.1186/s13075-023-03191-8. Arthritis Res Ther. 2023. PMID: 37993918 Free PMC article.
-
A robust clustering strategy for stratification unveils unique patient subgroups in acutely decompensated cirrhosis.J Transl Med. 2024 Jun 27;22(1):599. doi: 10.1186/s12967-024-05386-2. J Transl Med. 2024. PMID: 38937846 Free PMC article.
-
Comorbidity clusters in patients with rheumatoid arthritis identify a patient phenotype with a favourable prognosis.Ann Rheum Dis. 2024 Apr 11;83(5):556-563. doi: 10.1136/ard-2023-225093. Ann Rheum Dis. 2024. PMID: 38331589 Free PMC article.
-
Classification of long-term condition patterns in rheumatoid arthritis and associations with adverse health events: a UK Biobank cohort study.J Multimorb Comorb. 2023 Feb 10;13:26335565221148616. doi: 10.1177/26335565221148616. eCollection 2023 Jan-Dec. J Multimorb Comorb. 2023. PMID: 36798088 Free PMC article.
References
-
- Aletaha D, Neogi T, Silman AJ, Funovits J, Felson DT, Bingham CO III, et al. 2010 rheumatoid arthritis classification criteria: an American College of Rheumatology/European League Against Rheumatism collaborative initiative. Arthritis Rheum 2010;62:2569–81. - PubMed
-
- Singh JA, Saag KG, Bridges SL Jr, Akl EA, Bannuru RR, Sullivan MC, et al. 2015 American College of Rheumatology guideline for the treatment of rheumatoid arthritis. Arthritis Rheumatol 2016;68:1–26. - PubMed
-
- Cirillo D, Valencia A. Big data analytics for personalized medicine. Curr Opin Biotechnol 2019;58:161–7. - PubMed
Publication types
MeSH terms
LinkOut - more resources
Full Text Sources
Other Literature Sources
Medical
