. 2020 Oct 15;183(2):490-502.e18.
doi: 10.1016/j.cell.2020.09.002. Epub 2020 Sep 30.

Phase Separation of Disease-Associated SHP2 Mutants Underlies MAPK Hyperactivation

Affiliations

Phase Separation of Disease-Associated SHP2 Mutants Underlies MAPK Hyperactivation

Guangya Zhu et al. Cell. .

Abstract

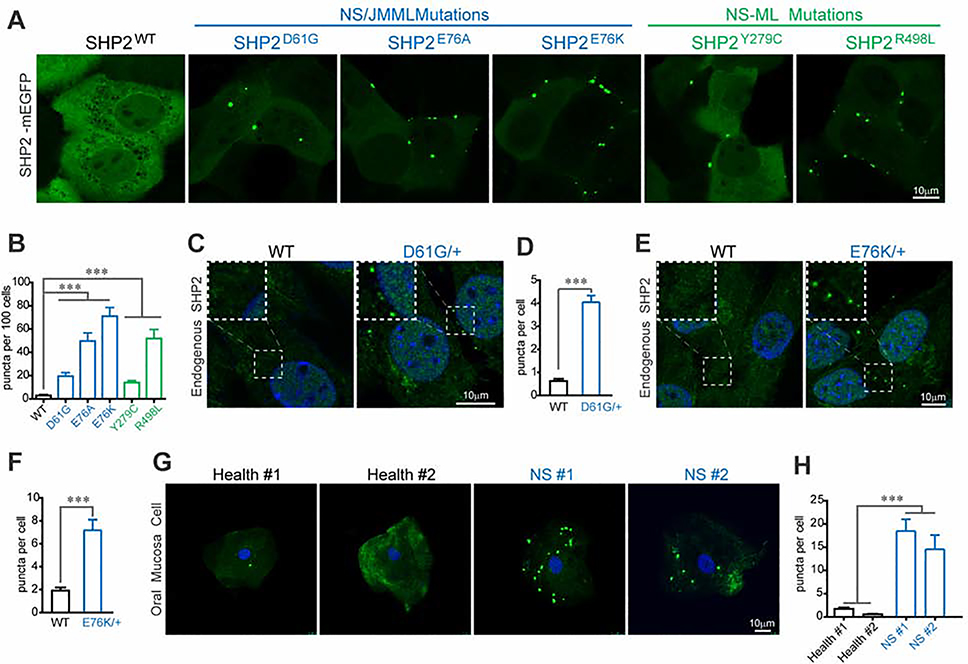
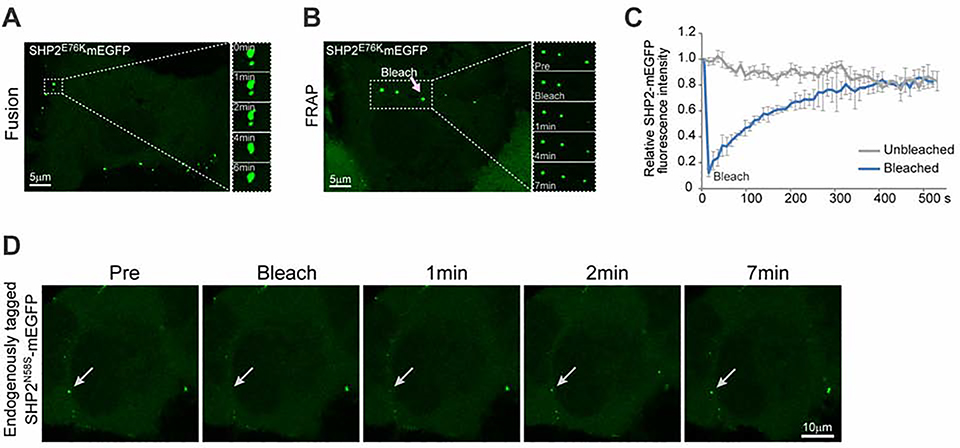
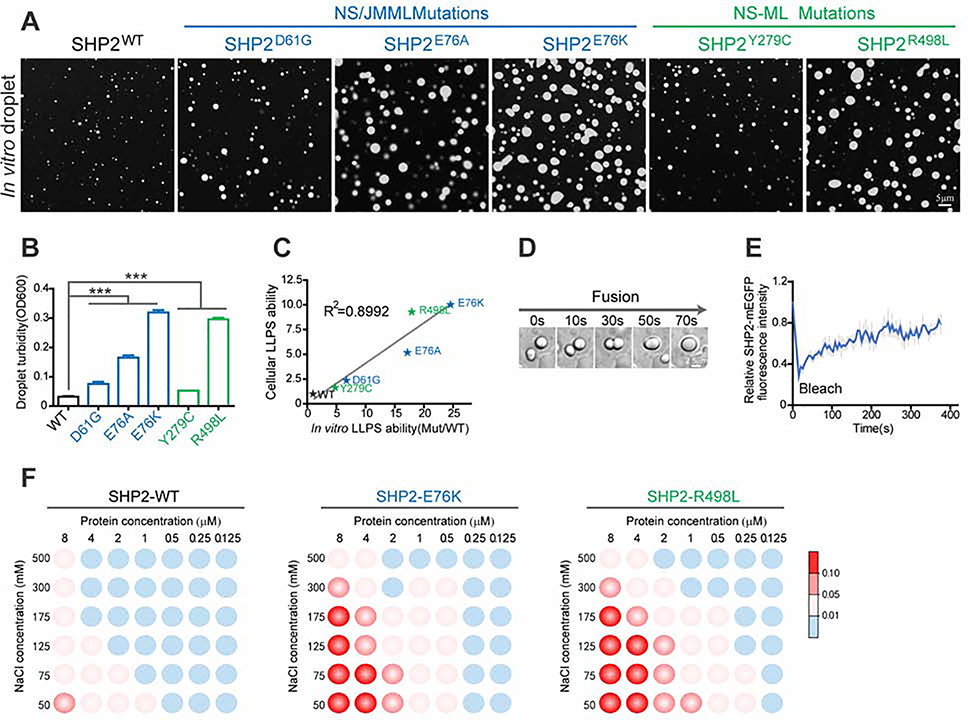
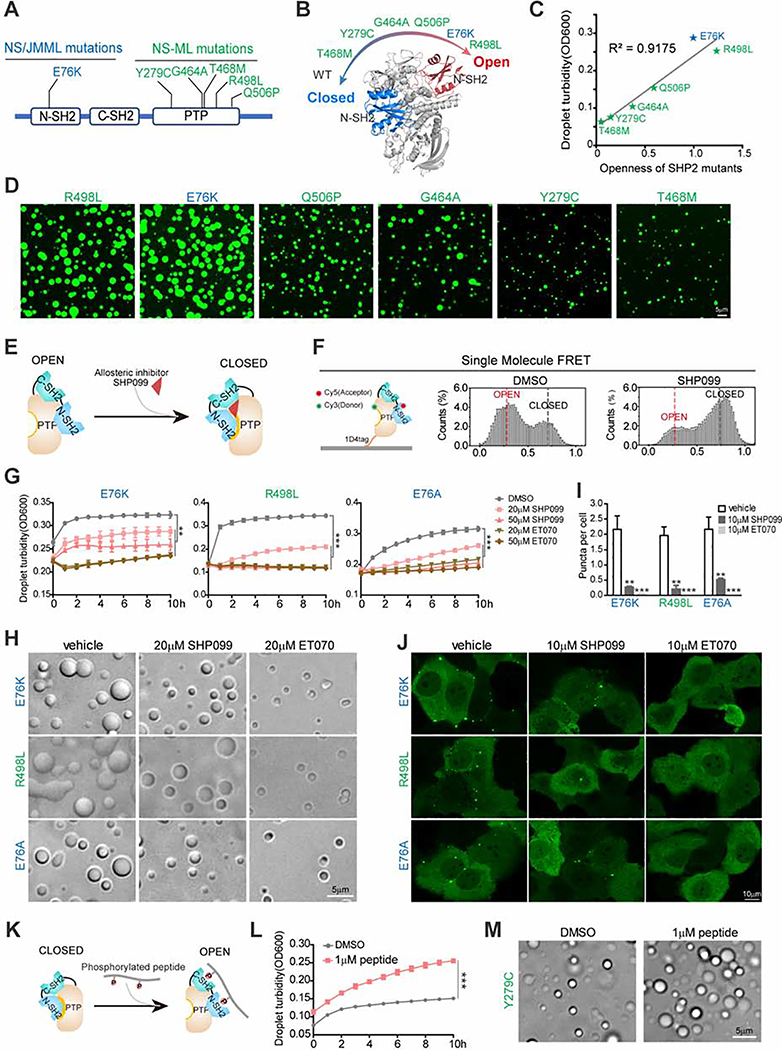
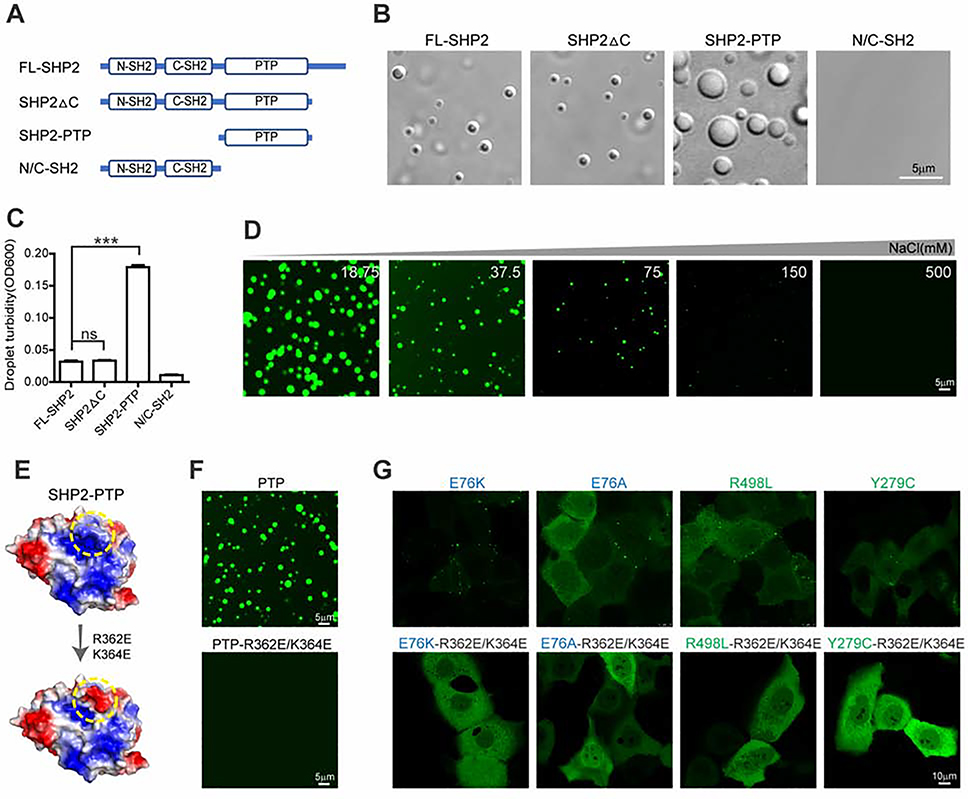
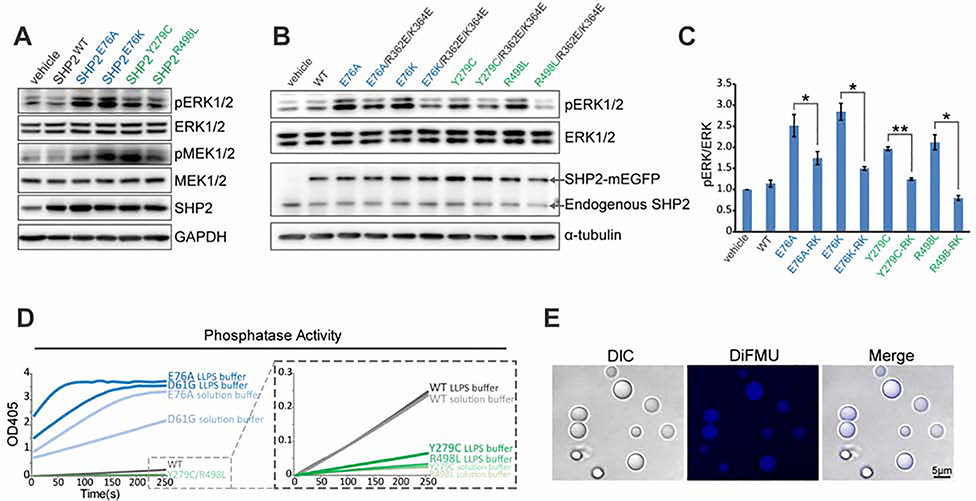
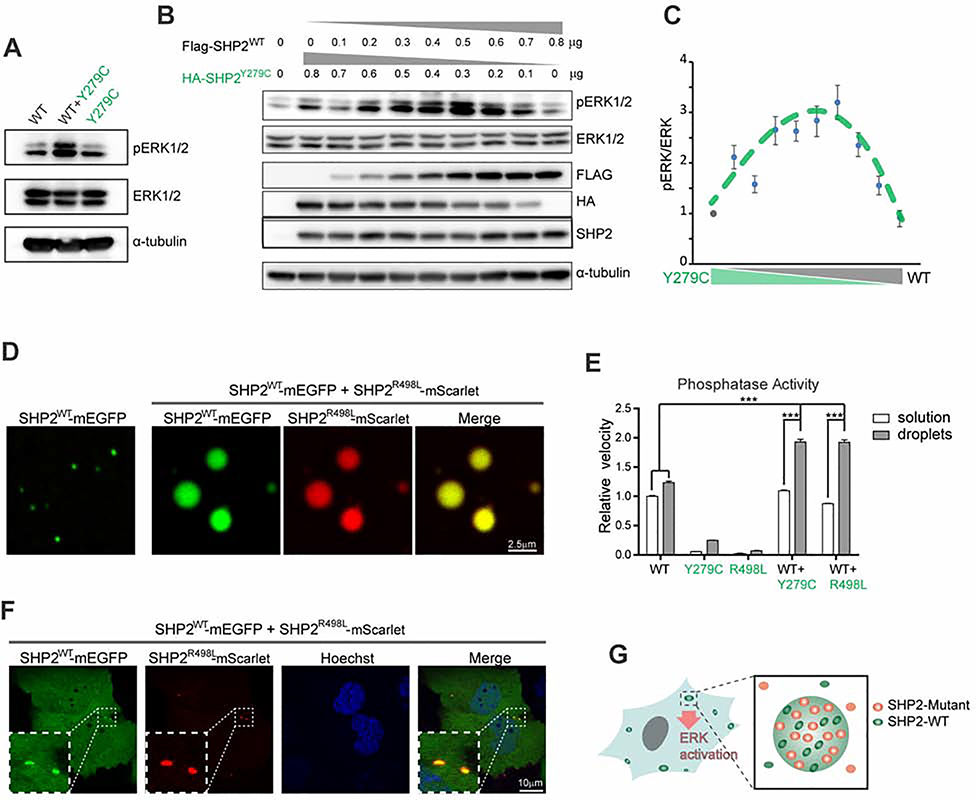
The non-receptor protein tyrosine phosphatase (PTP) SHP2, encoded by PTPN11, plays an essential role in RAS-mitogen-activated protein kinase (MAPK) signaling during normal development. It has been perplexing as to why both enzymatically activating and inactivating mutations in PTPN11 result in human developmental disorders with overlapping clinical manifestations. Here, we uncover a common liquid-liquid phase separation (LLPS) behavior shared by these disease-associated SHP2 mutants. SHP2 LLPS is mediated by the conserved well-folded PTP domain through multivalent electrostatic interactions and regulated by an intrinsic autoinhibitory mechanism through conformational changes. SHP2 allosteric inhibitors can attenuate LLPS of SHP2 mutants, which boosts SHP2 PTP activity. Moreover, disease-associated SHP2 mutants can recruit and activate wild-type (WT) SHP2 in LLPS to promote MAPK activation. These results not only suggest that LLPS serves as a gain-of-function mechanism involved in the pathogenesis of SHP2-associated human diseases but also provide evidence that PTP may be regulated by LLPS that can be therapeutically targeted.

Keywords: MAPK activation; Noonan syndrome; Noonan syndrome with multiple lentigines; PTPN11; SHP2; allosteric inhibitor; conformation change; disease-associated mutants; electrostatic interactions; liquid-liquid phase separation.


Conflict of interest statement

Declaration of Interests J.Z. is a co-founder of Etern Biopharma Co. Ltd. and a member of its scientific advisory board. Q.Z. is a consultant to Etern Biopharma Co. Ltd. L.D. is an employee of Etern Biopharma Co. Ltd. H.C.S. is an employee of Roche. Etern Biopharma Co. Ltd. holds the patent WO-2020094018 that includes ET070 as one exemplified compound.

Figures

Fig. 1.
Fig. 1.. Disease-associated SHP2 mutants form discrete puncta in cells.
(A) Live imaging of SHP2WT and indicated SHP2mut-mEGFP in KYSE520 cells. Scale bar, 10μm. See Figure S1A for schematic representation for NS and NS-ML mutations. See Figure S1B for expression levels of SHP2-mEGFP. (B) Quantification of high content image data (means ± SEM) for SHP2WT and SHP2mut-mEGFP puncta. ***p<0.001. See Figure S1C, S1D and S1E for representative images of SHP2-mEGFP and related analysis result. (C) Immunofluorescence imaging of SHP2 in MEF cells derived from Ptpn11D61G/+ and control mice. Scale bar, 10 μm. (D) Quantification result (means ± SEM, N = 104 cells) of (C) was shown. ***p<0.001. See Figure S1O for other representative images. (E) Immunofluorescence imaging of SHP2 in mesenchymal stem cells (MSCs) derived from Ptpn11E76K/+ and control mice. Scale bar, 10 μm. (F) Quantification result (means ± SEM, N = 149 cells) of (E) was shown. ***p<0.001. See Figure S1P for other representative images. (G) Immunofluorescence imaging of SHP2 in oral mucosal epithelial cells collected form two Noonan syndrome patients and two healthy volunteers. Scale bar, 10 μm. (H) Quantification result (means ± SEM, N = 34 cells) of (G) was shown. ***p<0.001.
Fig. 2.
Fig. 2.. The puncta of disease-associated SHP2 mutants exhibited liquid-like features in cells.
(A) Fusion of two SHP2E76K-mEGFP puncta. Scale bar, 5 μm. See Figure S2A and S2B for other SHP2 mutants. (B) Representative images of the FRAP experiment with SHP2E76K -mEGFP in KYSE520 cells. Scale bar, 5 μm. (C) Quantification of FRAP data (means ± SEM, N = 3 experiments) for SHP2E76K –mEGFP puncta. K (exponential constant) = 0.005497±0.000888s−1 and R (normalized plateau after fluorescence recovery) = 107.5% ± 7.45%. See Figure S2C, S2D, S2E and S2F for other SHP2 mutants. (D) Representative images of the FRAP experiment with endogenous tagged SHP2-mEGFP in H661(SHP2N58S) cells. Scale bar,10 μm.
Fig. 3.
Fig. 3.. Disease-associated mutations of SHP2 promote SHP2 LLPS in vitro.
(A) Representative images of 8 μM recombinant SHP2WT and indicated SHP2mut-mEGFP protein droplet formation in the presence of 10%(w/v) PEG3350. Scale bar, 5 μm. (B) Quantification of SHP2WT and indicated SHP2mut-mEGFP droplet formation by solution turbidity OD600 (means ± SEM, N = 5 experiments). ***p<0.001. (C) The correlation between cellular and in vitro LLPS capability of SHP2WT and SHP2mut. (D) Fusion event of SHP2E76K protein was shown. Scale bar, 5 μm. See Figure S3C for other SHP2 mutants. (E) Quantification of FRAP data (means ± SEM, N = 5 experiments) for SHP2E76K –mEGFP droplet. See Figure S3D and S3E for other SHP2 mutants. (F) Phase diagrams of SHP2WT, SHP2E76K and SHP2R498L protein with the concentration ranging from 0.125–8 μM in 20mM Tris pH8.0, 10%(w/v) PEG3350, sodium chloride (ranging from 50–500 mM). Blue dots: no phase separation; red dots: phase separation. The LLPS ability of SHP2 under different conditions was color-coded on the basis of droplet turbidity measured at OD600 when the proteins were incubated with phase separation buffer at 37°C for 120 min.
Fig. 4.
Fig. 4.. Open conformation promotes SHP2 LLPS.
(A) Representative disease-associated SHP2 mutants. NS/JMML mutations (blue) and NS-ML (green). (B) A scheme representing the intrinsic propensity for open conformation in SHP2WT and indicated SHP2mut. (C) The correlation between in vitro LLPS capability and openness of SHP2 mutants. (D) Representative images of recombinant indicated SHP2mut-mEGFP protein droplet formation in the presence of 10%(w/v) PEG3350. Scale bar, 5 μm. (E) A scheme illustrating allosteric inhibitor SHP099 locks SHP2 in the closed conformation. (F) Single molecule FRET results show the conformation change of SHP2E76A-87/266 induced by SHP099. See Figure S4A for representative FRET time-trajectories. (G, H) Indicated SHP2mut droplets were treated with SHP099 and ET070. Time course of droplet turbidity OD600 (means ± SEM, N = 3 experiments) **p<0.01; ***p<0.001. (G) and representative images (H). Scale bar, 5 μm. (I, J) KYSE520 cells stably expressing indicated SHP2mut–mEGFP treated with SHP099 or ET070. Quantification of puncta/nuclei (means ± SEM) **p<0.01; ***p<0.001. N=46 cells. (I) and representative images of indicated SHP2mut–mEGFP (J). Scale bar, 10 μm. (K) The cartoon for binding of the bis-P peptide to SHP2. (L) SHP2Y279C proteins were stimulated w/o 1 μM bis-P peptide and the droplet turbidity (means ± SEM, N=2 experiments) was assessed. ***p<0.001. (M) Images of SHP2Y279C droplets treated with DMSO and 1 μM bis-P peptide. Scale bar, 5 μm.
Fig. 5.
Fig. 5.. PTP domain drives SHP2 LLPS mediated by electrostatic interactions.
(A) Schematic of full-length SHP2 (FL-SHP2) and truncated SHP2 (SHP2ΔC, N/C-SH2, SHP2-PTP). (B) Representative images showing 8 μM FL-SHP2, SHP2ΔC, SHP2-PTP and N/C-SH2 protein droplet formation in the presence of 10%(w/v) PEG3350. Scale bar, 5 μm. (C) Quantification of droplet turbidity (means ± SEM, N = 5 experiments) for 8 μM FL-SHP2, SHP2ΔC, SHP2-PTP and N/C-SH2 in LLPS buffer (10%(w/v) PEG3350). ***p<0.001. (D) Representative images of liquid droplets formed by SHP2-PTP in the presence of indicated concentration of NaCl. Scale bar, 5 μm. (E) Schematic illustrating that R362E/K364E mutation converts the positively charged patch (in yellow circle) to the negatively charged patch on the surface of SHP2-PTP (PDB:4DGP). (F) Microscopy images of PTP and PTPR362E/K364E droplets. Scale bar, 5 μm. (G) Microscopy images of the indicated mutant SHP2-mEGFP in KYSE520 cells. Scale bar, 10 μm.
Fig. 6.
Fig. 6.. LLPS stimulates SHP2 PTP activity and is indispensable for ERK hyperactivation induced by SHP2 mutants.
(A) Immunoblot of the indicated proteins in HEK293T cells stably expressing SHP2WT and SHP2mut. (B) Immunoblots of the indicated proteins in HEK293T cells stably expressing indicated SHP2 variants. (C) The densitometry analysis of pERK/ERK levels in (B). Data are plotted as means ± SEM, (n=3 experiments). *p<0.05; **p<0.01. RK (R362E/K364E). (D) Kinetic phosphatase activity (n ≥ 2 experiments) of SHP2WT and SHP2mut under conditions of LLPS and solution using pNPP as substrate. (E) Images of SHP2E76A droplets using DiFMUP substrate. Scale bar, 5 μm. DIC, differential and interference contrast.
Fig. 7.
Fig. 7.. LLPS of SHP2 mutants recruit and activate SHP2WT to promote ERK1/2 activation.
(A) Immunoblots of the indicated proteins in HEK293T cells transiently transfected with indicated expression plasmids. (B, C) HEK293T cells were transiently transfected with the indicated amount of SHP2WT and SHP2Y297C plasmids. The immunoblots (B) and the densitometry analysis (C) of pERK/ERK levels(means ± SEM, N = 3 experiments) was shown. See Figure S7A for SHP2 knock-out cells. (D) Representative images showing SHP2WT-mEGFP was readily distributed into SHP2R498L-mScarlet droplets. Scale bar, 2.5 μm. See also Figure S7C, S7D and S7E.(E) Enzymatic activity (means ± SEM, N = 3 experiments) of indicated proteins under the conditions of LLPS and solution using pNPP as substrate. ***p<0.001. (F) Living images of KYSE520 cells co-expressed with SHP2WT-mEGFP and SHP2R498L-mScarlet. Scale bar, 10 μm. See also Figure S7G. (G) Cartoon illustrating that SHP2mut induces strong LLPS to recruit SHP2WT and promote ERK activation.

References

    1. Alberti S, and Dormann D (2019). Liquid–Liquid Phase Separation in Disease. Annu. Rev. Genet 53,3.1–3.24 - PubMed
    1. Alberti S, Gladfelter A, and Mittag T (2019). Considerations and challenges in studying liquid-liquid phase separation and biomolecular condensates. Cell 176, 419–434. - PMC - PubMed
    1. Araki T, Mohi MG, Ismat FA, Bronson RT, Williams IR, Kutok JL, Yang W, Pao LI, Gilliland DG, Epstein JA and Neel BG(2004). Mouse model of Noonan syndrome reveals cell type- and gene dosage- dependent effects of Ptpn11 mutation. Nat. Med 10, 849–857. - PubMed
    1. Böhmer F, Szedlacsek S, Tabernero L, Ostman A, and Den HJ (2013). Protein tyrosine phosphatase structure: function relationships in regulation and pathogenesis. Febs J. 280, 413–431. - PubMed
    1. Banani SF, Lee HO, Hyman AA, and Rosen MK (2017). Biomolecular condensates: organizers of cellular biochemistry. Nat. Rev. Mol. Cell Biol 18, 285. - PMC - PubMed

Publication types

MeSH terms

Substances

LinkOut - more resources