Meta-Analysis
. 2020 Dec:113:154378.
doi: 10.1016/j.metabol.2020.154378. Epub 2020 Sep 28.

Obesity in patients with COVID-19: a systematic review and meta-analysis

Affiliations
Meta-Analysis

Obesity in patients with COVID-19: a systematic review and meta-analysis

Yi Huang et al. Metabolism. 2020 Dec.

Abstract

Background: Obesity is common in patients with coronavirus disease 2019 (COVID-19). The effects of obesity on clinical outcomes of COVID-19 warrant systematical investigation.

Objective: This study explores the effects of obesity with the risk of severe disease among patients with COVID-19.

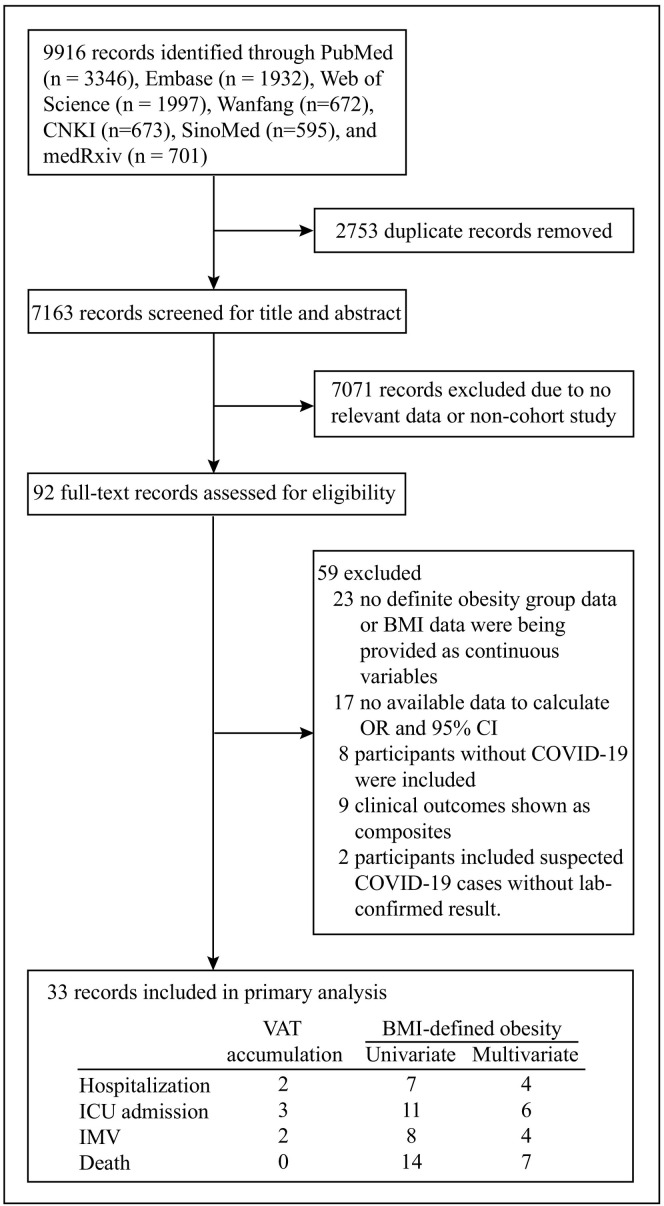
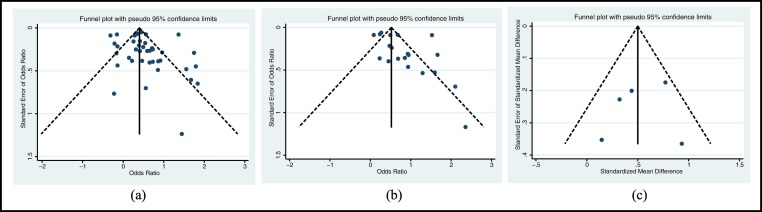
Methods: Body mass index (BMI) and degree of visceral adipose tissue (VAT) accumulation were used as indicators for obesity status. Publication databases including preprints were searched up to August 10, 2020. Clinical outcomes of severe COVID-19 included hospitalization, a requirement for treatment in an intensive care unit (ICU), invasive mechanical ventilation (IMV), and mortality. Risks for severe COVID-19 outcomes are presented as odds ratios (OR) and 95% confidence interval (95%CI) for cohort studies with BMI-defined obesity, and standardized mean difference (SMD) and 95%CI for controlled studies with VAT-defined excessive adiposity.

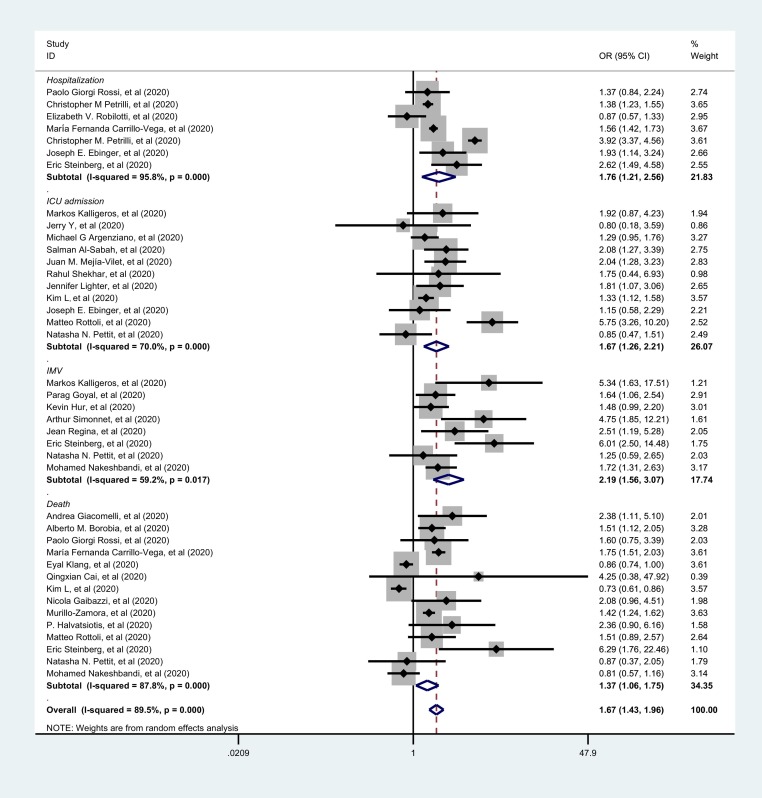
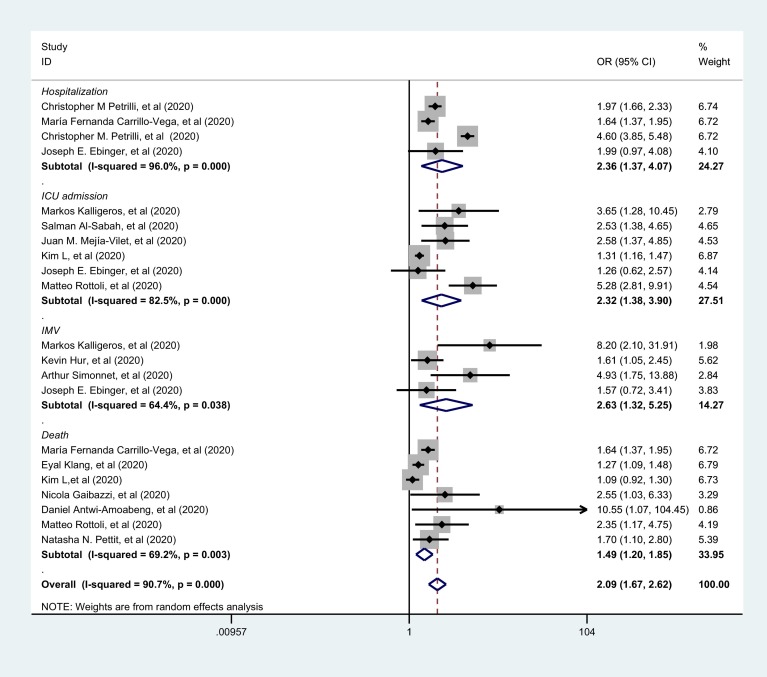
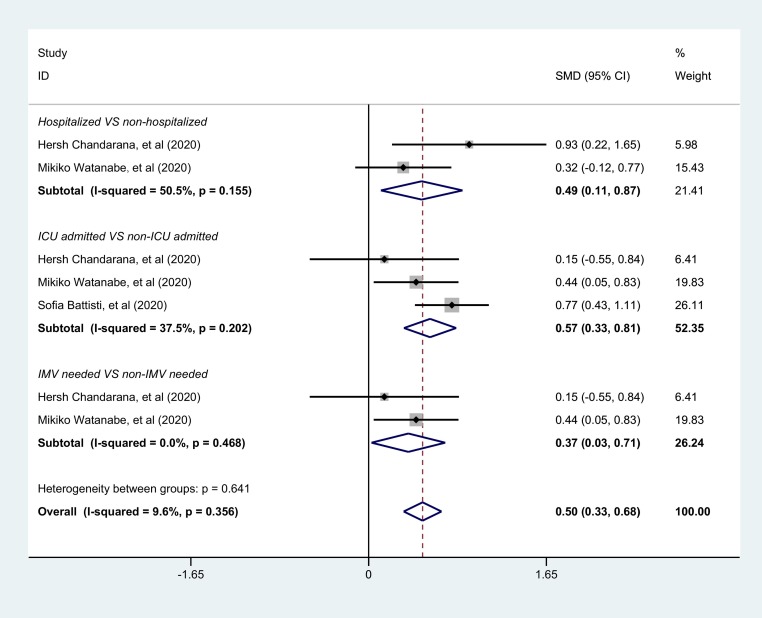
Results: A total of 45, 650 participants from 30 studies with BMI-defined obesity and 3 controlled studies with VAT-defined adiposity were included for assessing the risk of severe COVID-19. Univariate analyses showed significantly higher ORs of severe COVID-19 with higher BMI: 1.76 (95%: 1.21, 2.56, P = 0.003) for hospitalization, 1.67 (95%CI: 1.26, 2.21, P<0.001) for ICU admission, 2.19 (95%CI: 1.56, 3.07, P<0.001) for IMV requirement, and 1.37 (95%CI: 1.06, 1.75, P = 0.014) for death, giving an overall OR for severe COVID-19 of 1.67 (95%CI: 1.43, 1.96; P<0.001). Multivariate analyses revealed increased ORs of severe COVID-19 associated with higher BMI: 2.36 (95%CI: 1.37, 4.07, P = 0.002) for hospitalization, 2.32 (95%CI: 1.38, 3.90, P = 0.001) for requiring ICU admission, 2.63 (95%CI: 1.32, 5.25, P = 0.006) for IMV support, and 1.49 (95%CI: 1.20, 1.85, P<0.001) for mortality, giving an overall OR for severe COVID-19 of 2.09 (95%CI: 1.67, 2.62; P<0.001). Compared to non-severe COVID-19 patients, severe COVID-19 cases showed significantly higher VAT accumulation with a SMD of 0.49 for hospitalization (95% CI: 0.11, 0.87; P = 0.011), 0.57 (95% CI: 0.33, 0.81; P<0.001) for requiring ICU admission and 0.37 (95% CI: 0.03, 0.71; P = 0.035) for IMV support. The overall SMD for severe COVID-19 was 0.50 (95% CI: 0.33, 0.68; P<0.001).

Conclusions: Obesity increases risk for hospitalization, ICU admission, IMV requirement and death among patients with COVID-19. Further, excessive visceral adiposity appears to be associated with severe COVID-19 outcomes. These findings emphasize the need for effective actions by individuals, the public and governments to increase awareness of the risks resulting from obesity and how these are heightened in the current global pandemic.

Keywords: Coronavirus disease 2019; Intensive care; Invasive mechanical ventilation; Mortality; Obesity; Visceral adipose tissue.


Conflict of interest statement

Declaration of competing interest We declare no competing interests.

Figures

Fig. 1
Fig. 1
Flowchart of screened and included studies. In the box of included records, column headings represent obesity condition including VAT accumulation and BMI-defined obesity; Rowheadings represent clinical outcomes including hospitalization, ICU admission, IMV and death. Abbreviation: CNKI, Chinese National Knowledge Infrastructure; BMI, body mass index; OR, odds ratio; 95%CI, 95% confidence interval; COVID-19, Coronavirus Disease 2019; VAT, visceral adipose tissue; ICU, intensive care unit; IMV, invasive mechanical ventilation.
Fig. 2
Fig. 2
Forest plots of univariate association between BMI-defined obesity and the risk of COVID-19 severity using the random-effects model. Clinical outcome of each subgroup is marked in italics. The gray squares show the estimated effect of each single study and their sizes reflected the weight of each single study on the summary effect. The larger the size, the greater the weight. The diamonds represent the overall summary effects with their widths reflecting the length of the 95% CI. A wider diamond means a wider 95% CI. The horizontal black lines through the gray squares also represent the length of the 95% confidence interval of individual studies. The longer the line, the wider the 95% CI. The solid vertical black line is the line of no effect. The region to the left of the line of no effect indicates no association while the region to the right indicates association. When the diamond touches the solid vertical black line, this indicates no statistical difference. The dotted black line is the line of the overall summary effect. Subtotal effect estimate results and the overall results are marked in bold. I-squared indicates the degree of heterogeneity within the studies. Abbreviation: OR, odds ratio; 95%CI, 95% confidence interval; ICU, intensive care unit; IMV, invasive mechanical ventilation; COVID-19, Coronavirus Disease 2019.
Fig. 3
Fig. 3
Forest plots of multivariate association between BMI-defined obesity and the risk of COVID-19 severity using the random-effects model. Clinical outcome of each subgroup is marked in italics. The gray squares show the estimated effect of each single study and their sizes reflect the weight of each single study on the summary effect. The larger the size, the greater the weight. The diamonds represent the overall summary effects with their widths reflecting the length of the 95% CI. A wider diamond means a wider 95% CI. The horizontal black lines through the gray squares also represent the length of the 95% CI of individual studies. The longer the line, the wider the 95% CI. The solid vertical black line is the line of no effect. The region to the left of the line of no effect indicates no association while the region to the right indicates association. When the diamond touches the solid vertical black line, this indicates no statistical difference. The dotted black line is the line of the overall summary effect. Subtotal effect estimate results and the overall results are marked in bold. I-squared indicates the degree of heterogeneity within the studies. Abbreviation: OR, odds ratio; 95%CI, 95% confidence interval; ICU, intensive care unit; IMV, invasive mechanical ventilation; COVID-19, Coronavirus Disease 2019.
Fig. 4
Fig. 4
Forest plots of VAT amount between severe group and non-severe group among COVID-19 patients using the fixed-effects model. The gray squares show the estimated effect of each single study and their sizes reflect the weight of each single study on the summary effect. The larger the size, the greater the weight. The diamonds represent the overall summary effects with their widths reflecting the length of the 95% CI. A wider diamond means a wider 95% CI. The horizontal black lines through the gray squares also represent the length of the 95% CI of individual studies. The longer the line, the wider the 95% CI. The solid vertical black line is the line of no effect. The region to the left of the line of no effect indicates a lower mean value for the experimental group versus the control group while the region to the right indicates a higher mean value for the experimental group versus the control group. When the diamond touches the solid vertical black line, this indicates no statistical difference. The dotted black line is the line of the overall summary effect. Subtotal effect estimate results and the overall results are marked in bold. I-squared indicates the degree of heterogeneity within the studies. Abbreviation: SMD, Standardized Mean Difference; 95%CI, 95% confidence interval; ICU, intensive care unit; IMV, invasive mechanical ventilation; VAT, visceral adipose tissue;COVID-19, Coronavirus Disease 2019.
Fig. 5
Fig. 5
Funnel plot of included studies for publication bias. a. Funnel plot of included studies using univariate analysis between BMI-defined obesity and COVID-19 severity; b. Funnel plot of included studies using multivariate analysis between BMI-defined obesity and COVID-19 severity; c. Funnel plot of included studies that assessed the association between VAT accumulation and severe COVID-19.

Comment in

References

    1. World Health Organization Coronavirus. 2020. https://www.who.int/health-topics/coronavirus#tab=tab_1
    1. World Health Organization Coronavirus disease 2019. 2020. https://www.who.int/emergencies/diseases/novel-coronavirus-2019
    1. Berlin D.A., Gulick R.M., Martinez F.J. Severe Covid-19[published online ahead of print, 2020 May 15] N Engl J Med. 2020 doi: 10.1056/NEJMcp2009575. - DOI - PubMed
    1. Liang W., Guan W., Chen R., Wang W., Li J., Xu K. Cancer patients in SARS-CoV-2 infection: a nationwide analysis in China. Lancet Oncol. 2020;21(3):335–337. doi: 10.1016/S1470-2045(20)30096-6. - DOI - PMC - PubMed
    1. World Health Organization Obesity and overweight. 2020. https://www.who.int/news-room/fact-sheets/detail/obesity-and-overweight

Publication types

MeSH terms