. 2020 Oct 20;117(42):26470-26481.
doi: 10.1073/pnas.2007620117. Epub 2020 Oct 1.

Adhesion-GPCR Gpr116 (ADGRF5) expression inhibits renal acid secretion

Affiliations

Adhesion-GPCR Gpr116 (ADGRF5) expression inhibits renal acid secretion

Nathan A Zaidman et al. Proc Natl Acad Sci U S A. .

Abstract

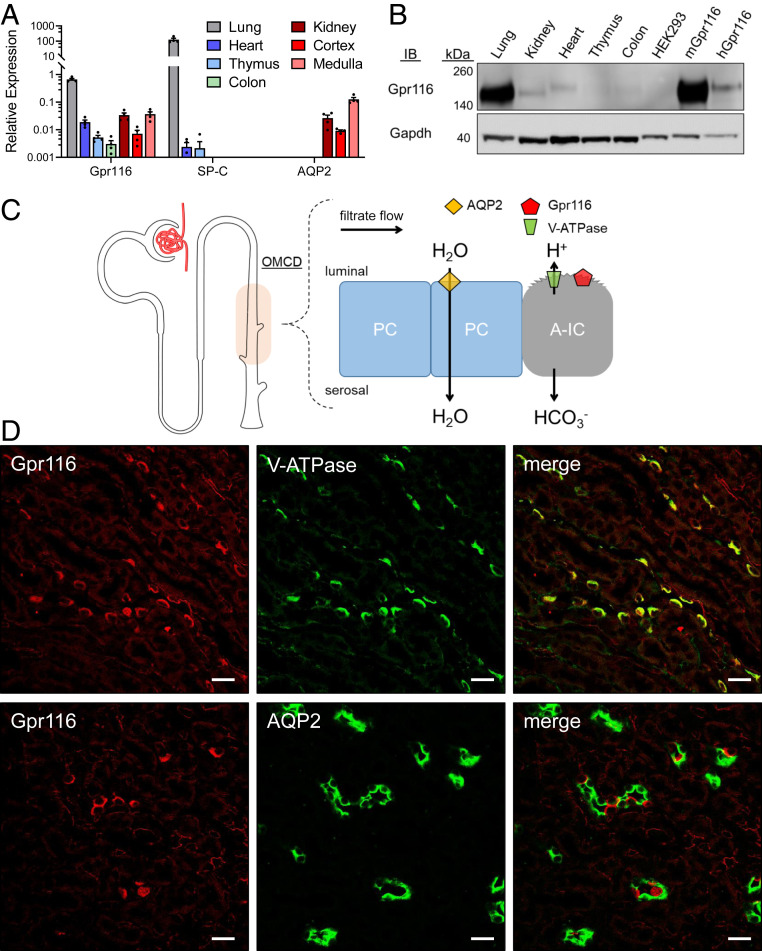
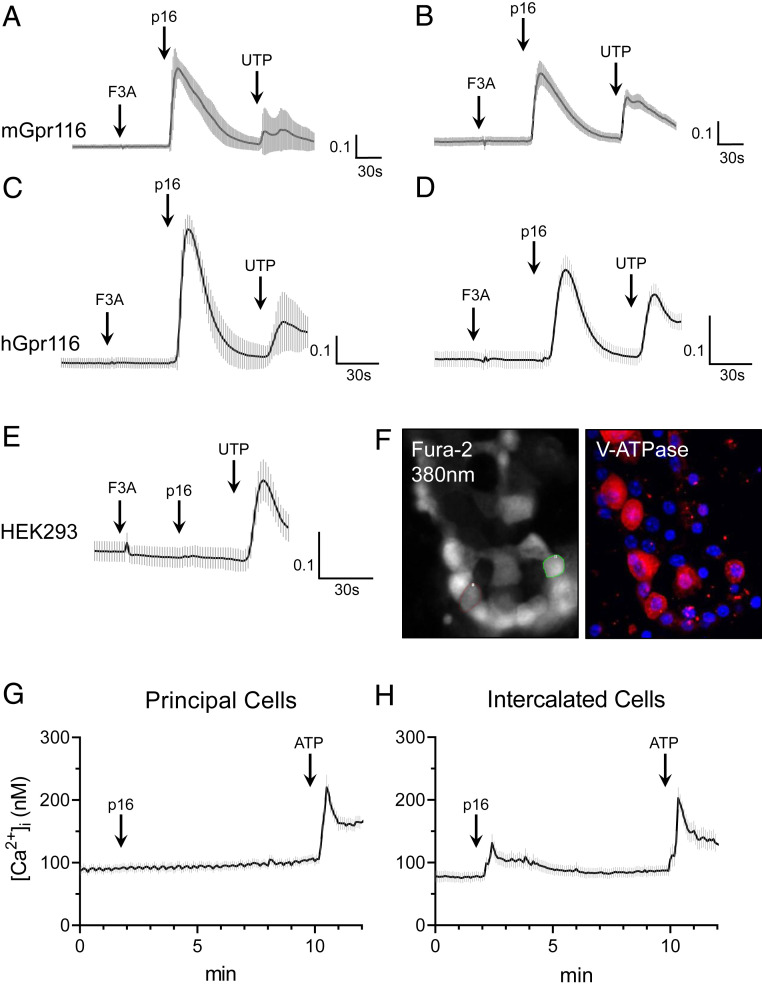
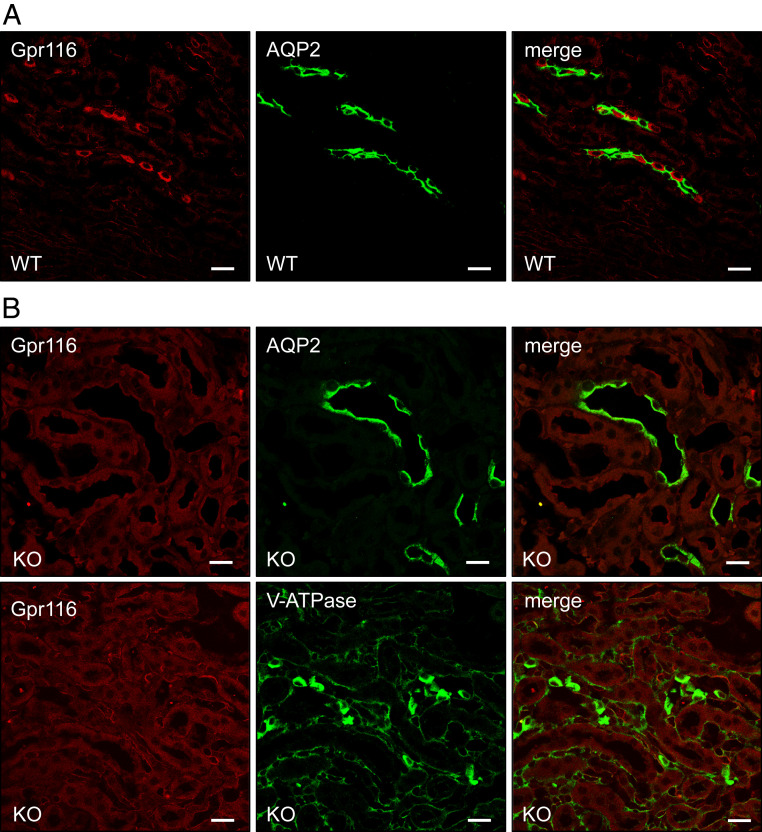
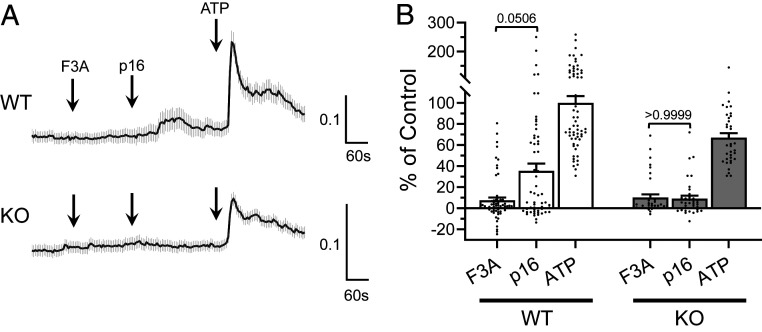
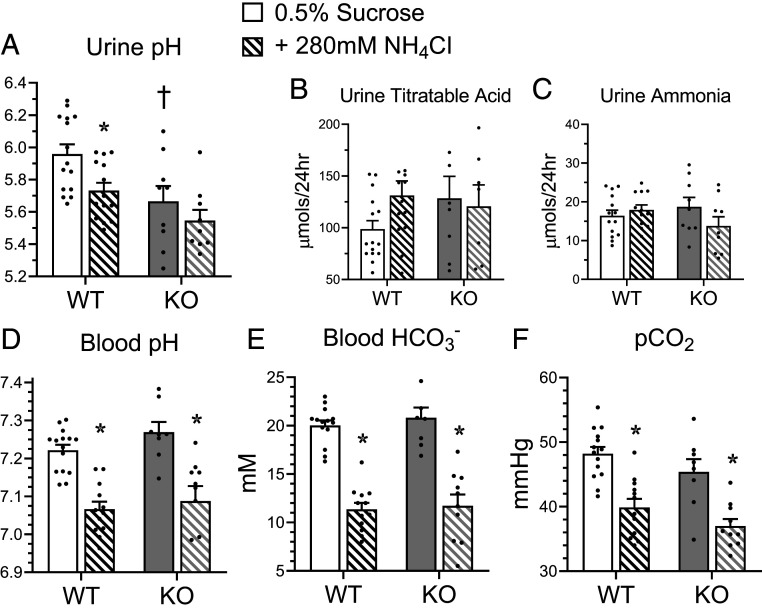
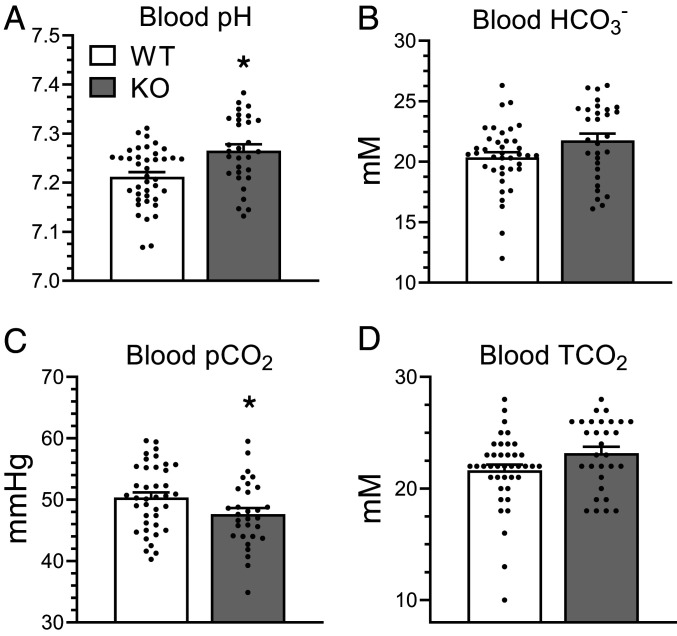
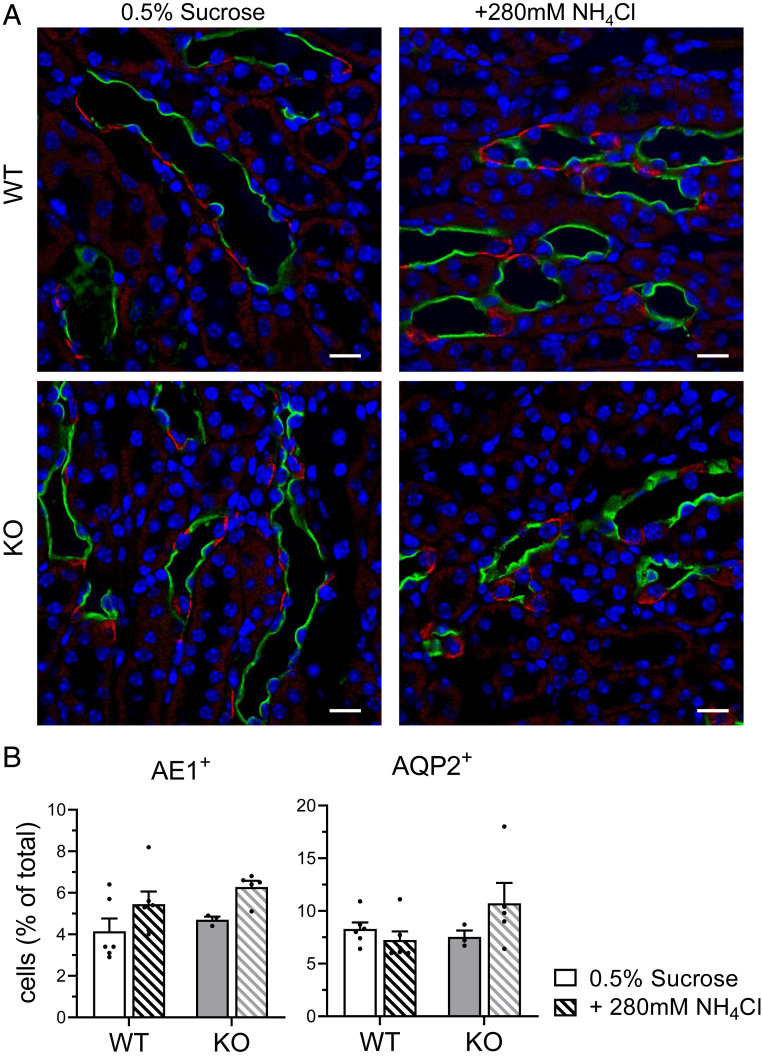
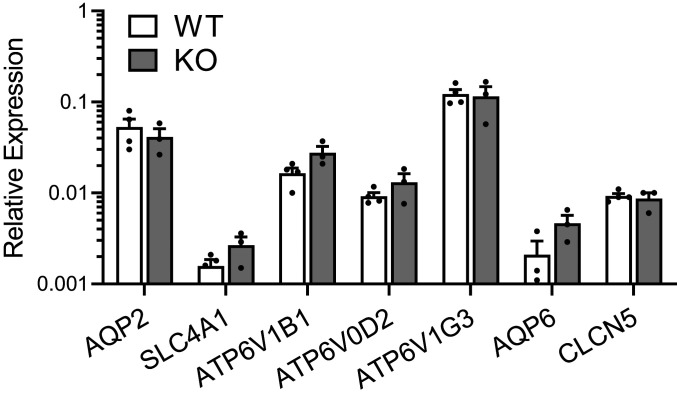
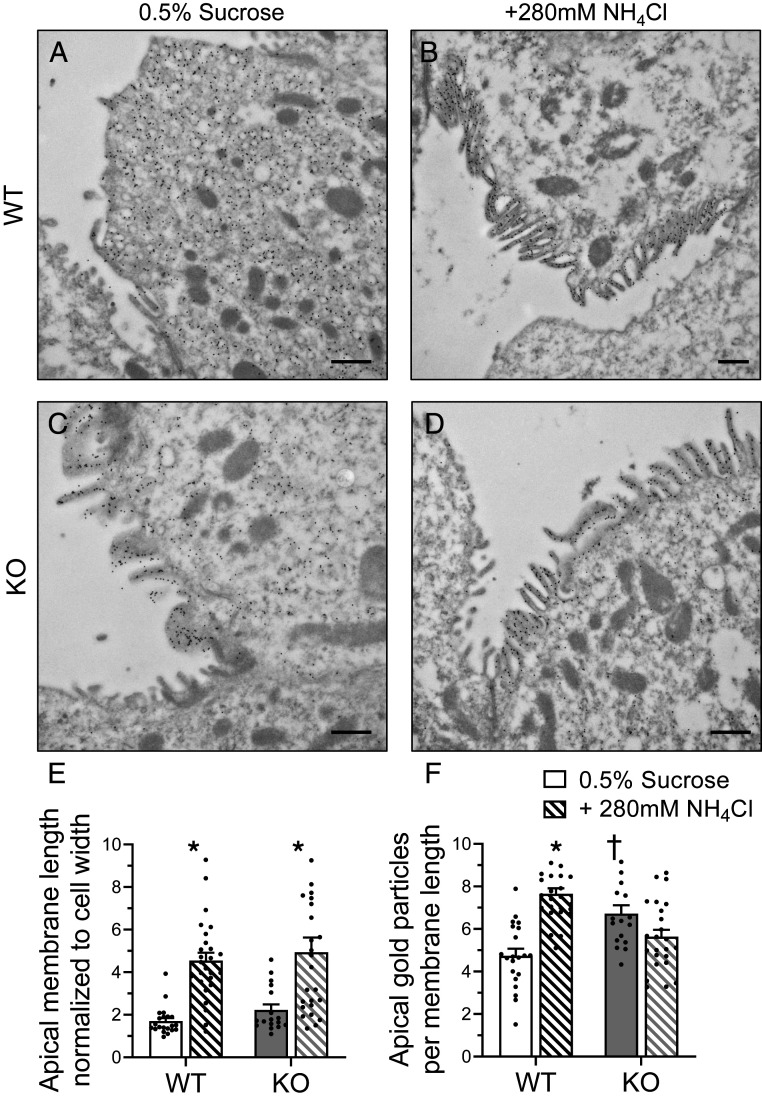
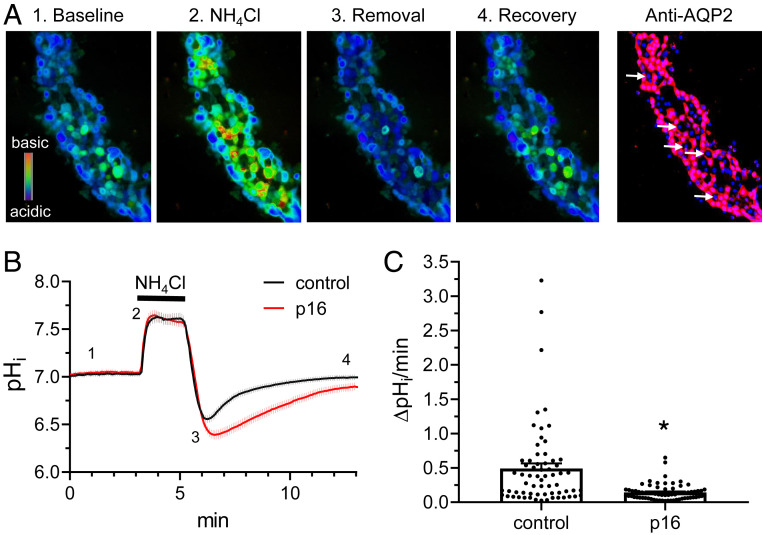
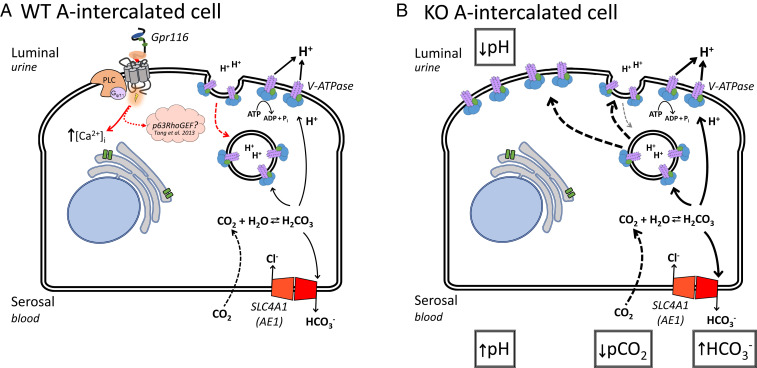
The diversity and near universal expression of G protein-coupled receptors (GPCR) reflects their involvement in most physiological processes. The GPCR superfamily is the largest in the human genome, and GPCRs are common pharmaceutical targets. Therefore, uncovering the function of understudied GPCRs provides a wealth of untapped therapeutic potential. We previously identified an adhesion-class GPCR, Gpr116, as one of the most abundant GPCRs in the kidney. Here, we show that Gpr116 is highly expressed in specialized acid-secreting A-intercalated cells (A-ICs) in the kidney using both imaging and functional studies, and we demonstrate in situ receptor activation using a synthetic agonist peptide unique to Gpr116. Kidney-specific knockout (KO) of Gpr116 caused a significant reduction in urine pH (i.e., acidification) accompanied by an increase in blood pH and a decrease in pCO2 compared to WT littermates. Additionally, immunogold electron microscopy shows a greater accumulation of V-ATPase proton pumps at the apical surface of A-ICs in KO mice compared to controls. Furthermore, pretreatment of split-open collecting ducts with the synthetic agonist peptide significantly inhibits proton flux in ICs. These data suggest a tonic inhibitory role for Gpr116 in the regulation of V-ATPase trafficking and urinary acidification. Thus, the absence of Gpr116 results in a primary excretion of acid in KO mouse urine, leading to mild metabolic alkalosis ("renal tubular alkalosis"). In conclusion, we have uncovered a significant role for Gpr116 in kidney physiology, which may further inform studies in other organ systems that express this GPCR, such as the lung, testes, and small intestine.

Keywords: A-intercalated cell; ADGRF5; Gpr116; V-ATPase; kidney.


Conflict of interest statement

The authors declare no competing interest.

Figures

Fig. 1.
Fig. 1.
Gpr116 is highly expressed in kidney and is localized to V-ATPase expressing ICs of the collecting duct. (A) Gpr116 mRNA expression as measured by qRT-PCR in various tissues including lung and kidney. SP-C and AQP2 served as positive controls of lung and kidney mRNA. Gene expression is normalized to Gapdh. Cycle threshold of 35 approximately corresponds with 0.001 on the y axis. (B) Western blot analysis of Gpr116 expression in various tissues as well as stably transfected HEK293 cells with mouse (mGpr116) or human (hGpr116) Gpr116. Expected molecular mass for Gpr116 is ∼150 kDa. (C) Diagram of the murine outer medullary collecting duct (OMCD) showing water-transporting principal cells (PC) and acid-secreting A-IC. Proton secretion is coupled to bicarbonate reabsorption throughout the nephron. (D) Representative immunofluorescence images demonstrating colocalization of Gpr116 with V-ATPase in mouse collecting ducts. Similarly, Gpr116 is interspersed among AQP2 expressing cells in mouse collecting ducts. (Scale bars, 20 μm.)
Fig. 2.
Fig. 2.
Gpr116 activation by exogenous synthetic agonist peptide mobilizes calcium in vitro and in split-open cortical collecting ducts. (AE) Stimulation of heterologous murine and human Gpr116 in HEK293 cells with p16 synthetic agonist peptide (200 μM), but not with the control peptide (F3A), causes an increase in [Ca2+]i as measured by ΔF340/F380. Nontransfected control is shown in E. In A and C, traces are the mean ± SEM of 20 individual p16-responsive cells; in B, D, and E traces are the mean ± SEM of 16 regions of an entire field of view. (F) Representative images of Fura-2 loaded murine split-open collecting ducts demonstrating identification of V-ATPase expressing ICs. As these are split-open tubules viewed from above, V-ATPase stain can be used to identify cell types (but not for subcellular localization). Magnification: 40×. (G) Calcium mobilization in principal cells following stimulation with p16 (200 μM) and then ATP (50 μM) in split-open collecting ducts. Trace is mean ± SEM of 24 cells from three collecting ducts. (H) Calcium mobilization in V-ATPase expressing ICs following stimulation with p16 and then ATP. Trace is mean ± SEM of 21 cells from 3 collecting ducts.
Fig. 3.
Fig. 3.
Targeted deletion of Gpr116 in kidney tubules results in loss of Gpr116 in collecting ducts. (A) Representative immunofluorescence images demonstrating localization of Gpr116-expressing cells among AQP2 expressing cells in WT mouse collecting ducts. (B) Representative immunofluorescence images demonstrating loss of Gpr116-expressing cells in mouse collecting ducts after targeted deletion with KSP-Cre/Lox system. (Scale bars, 20 μm.)
Fig. 4.
Fig. 4.
Split-open cortical collecting ducts from kidney-specific Gpr116 KO do not contain cells that are stimulated by exogenous p16 synthetic agonist peptide. (A) Representative Fura-2 (ΔF340/F380) traces of split-open collecting ducts from WT and KO mice. Traces are mean ± SEM of all ATP-responsive cells in three split-open collecting ducts. (B) Summary data of ΔF340/F380 for all ATP-responsive cells observed in split-open collecting ducts from WT and KO mice. Data are normalized to ΔF340/F380 of WT tubules to ATP. Bars are mean ± SEM. n = 63 WT cells, 37 KO cells. Statistical analysis performed using Kruskal–Wallis test followed by Dunn’s multiple comparisons.
Fig. 5.
Fig. 5.
Deletion of Gpr116 in mouse collecting ducts decreases urine pH. (AC) Twenty-four–hour urine pH, urine titrable acid, and urine ammonia of WT and KO mice with access to control water (0.5% sucrose, solid bars) or metabolic-acidosis inducing water (0.5% sucrose + 280 mM NH4Cl, hatched bars; paired samples). (DF) Paired whole-blood samples harvested from facial vein puncture were analyzed for pH, HCO3 concentration, pCO2. For paired samples in AF, bars are mean ± SEM. n = 15 WT mice, 9 KO mice. Statistical analysis performed using Kruskal–Wallis test followed by Dunn’s multiple comparisons. *P < 0.05 vs. treatment; P < 0.05 vs. genotype. Urine pH: WT 0.5% sucrose vs. +280 mM NH4Cl *P = 0.04; WT 0.5% sucrose vs. KO 0.5% sucrose P = 0.04. Blood pH: WT 0.5% sucrose vs. +280 mM NH4Cl *P = 0.001; KO 0.5% sucrose vs. +280 mM NH4Cl *P = 0.004. Blood HCO3: WT 0.5% sucrose vs. +280 mM NH4Cl *P = 0.0001; KO 0.5% sucrose vs. +280 mM NH4Cl *P = 0.001. pCO2: WT 0.5% sucrose vs. +280 mM NH4Cl *P = 0.001; KO 0.5% sucrose vs. +280 mM NH4Cl *P = 0.04.
Fig. 6.
Fig. 6.
Kidney-specific Gpr116 KO mice have alkaline blood and reduced pCO2 compared to WT littermates. (AD) Whole-blood samples harvested from facial vein puncture demonstrate increased blood pH from KO mice, a trend toward increased blood HCO3, and significantly reduced pCO2. TCO2 is not statistically different, but shows a trend toward increased values in KO samples (due to increased HCO3 in those samples). TCO2 was calculated as the sum of pCO2 (in mM) and HCO3. Bars are mean ± SEM. n = 39 WT mice, 30 KO mice. Statistical analysis performed using Mann–Whitney test. *P < 0.05. Blood pH: WT vs. KO *P = 0.002; blood HCO3: WT vs. KO P = 0.06; pCO2: WT vs. KO *P = 0.04. TCO2: WT vs. KO P = 0.06.
Fig. 7.
Fig. 7.
KO mice do not have more A-ICs than WT mice. (A) Representative images demonstrating AQP2 (green) labeling of principal cells and AE1 (red) labeling of ICs from mice drinking control water and water with NH4Cl. (Scale bars, 20 μm.) (B, Left) Quantification of AE1+ cells per 100 DAPI+ cells. For each kidney section, quantification was performed on whole medulla. (Right) Quantification of AQP2+ cells per 100 DAPI+ cells. For B, bars are mean ± SEM. n = 6 kidneys per group. Solid bars are 0.5% sucrose water, hatched bars are 0.5% sucrose + 280 mM NH4Cl water.
Fig. 8.
Fig. 8.
mRNAs of V-ATPase subunits are similar in WT and KO mice. qPCR analysis of AQP2, SLC4A1 (AE1), V-ATPase subunits ATP6V1B1, ATP6V0D2, ATP6V1G3, AQP6, and CLCN5 mRNAs are not statistically different in WT and KO kidney samples. V-ATPase subunits ATP6V0D2 and ATP6V1G3 were previously shown to be unique transcriptional markers for A-ICs in the kidney (18). AQP6 and CLCN5 encode for proteins that colocalize with V-ATPase in subapical vesicles (59). Bars are mean ± SEM. n = 4 WT kidneys, 3 KO kidneys. Cycle threshold of 35 approximately corresponds with 0.001 on the y axis.
Fig. 9.
Fig. 9.
Kidney-specific Gpr116 KO mice have increased accumulation of V-ATPase at the apical membrane of A-ICs. Representative transmission electron micrographs reveal the subcellular localization of V-ATPase by immunogold labeling. (A) Gold particles (black dots) labeling V-ATPase are localized to subapical vesicles in A-ICs from WT mice. (B) Induction of a metabolic acidosis with the addition of NH4Cl to the drinking water causes translocation of V-ATPase to the apical membrane. Numerous microplicae are visible on the surface of the A-IC. (C) KO mice accumulate gold particles at the apical membrane of A-ICs and have visible microplicae. (D) Addition of NH4Cl to the drinking water induces growth of microplicae in KO mice. Images are representative of n = 3 kidneys per group. (Scale bars, 500 nm.) (E) Quantification of A-IC apical membrane length normalized to the cell width. (F) Quantification of gold particle density per unit length of membrane. For E and F, n = 21 cells WT 0.5% sucrose, n = 26 cells WT NH4Cl, n = 17 KO 0.5% sucrose, n = 25 cells KO NH4Cl. Statistical analysis performed using Kruskal–Wallis test followed by Dunn’s multiple comparisons. *P < 0.05 vs. treatment; P < 0.05 vs. genotype. Apical membrane length: WT 0.5% sucrose vs. +280 mM NH4Cl *P < 0.0001; KO 0.5% sucrose vs. +280 mM NH4Cl *P = 0.005. Apical gold particles: WT 0.5% sucrose vs. +280 mM NH4Cl *P < 0.0001; WT 0.5% sucrose vs. KO 0.5% sucrose P = 0.007.
Fig. 10.
Fig. 10.
Gpr116 activation in A-ICs inhibits pHi recovery. (A) Representative pseudocolor images (blue, acidic; red, alkali) of intracellular pH in a split opened collecting duct loaded with pH-sensitive dye BCECF at the baseline (1), upon application of 40 mM NH4Cl (2), immediately after NH4Cl removal (3), and recovery toward the baseline pHi values (4). Confocal micrograph of the same split-opened CD probed with anti-AQP2 (pseudocolor red) is shown on the right. Examples of AQP2 ICs are depicted with white arrows. Nuclear DAPI staining is shown in pseudocolor blue. Magnification: 40×. (B) Summary graph comparing the time course of pHi changes in control (black) and p16 pretreated (100 µM for 40 min, red) ICs. Trace shows mean ± SEM for 65 control cells and 69 p16-treated cells. Each experimental condition is a summary from four collecting ducts from four different mice. Application of the NH4Cl pulse is designated by the black bar above the trace. The time points shown in A are marked as 1 to 4. (C) Summary graph of H+ extrusion rate from ICs from the control and after pretreatment with p16 shown in B. The rate was calculated as a linear slope of pHi recovery after 40 mM NH4Cl application. Statistical analysis performed using Mann–Whitney test. *P < 0.05. Control vs. p16 *P < 0.0001.
Fig. 11.
Fig. 11.
Working model of Gpr116 function in A-IC from WT and KO mice. (A) In WT mice, Gpr116 is expressed on the apical membrane of A-ICs. Activation of the receptor leads to an increase in [Ca2+]i and possibly Rho GTPases (48). We hypothesize that Gpr116 acts to decrease surface accumulation of V-ATPase (red arrow) by counteracting the effects of agents, such as aldosterone and adenosine (31, 34), which promote increased surface density of proton pumps. (B) In the absence of Gpr116, there is no counter to the up-regulatory pathways, leading to accumulation of V-ATPase at the apical membrane of A-ICs. This results in increased pumping of protons into the lumen and a decrease to urine pH. By Le Chantelier’s principle, the constant depletion of cytosolic protons causes more CO2 to diffuse into the cell and combine with H2O, producing carbonic acid and ultimately more HCO3 and H+, leading to increased HCO3 reabsorption across the basolateral membrane.

References

    1. Bockaert J., Pin J. P., Molecular tinkering of G protein-coupled receptors: An evolutionary success. EMBO J. 18, 1723–1729 (1999). - PMC - PubMed
    1. Bassilana F., Nash M., Ludwig M. G., Adhesion G protein-coupled receptors: Opportunities for drug discovery. Nat. Rev. Drug Discov. 18, 869–884 (2019). - PubMed
    1. Fredriksson R., Lagerström M. C., Lundin L. G., Schiöth H. B., The G-protein-coupled receptors in the human genome form five main families. Phylogenetic analysis, paralogon groups, and fingerprints. Mol. Pharmacol. 63, 1256–1272 (2003). - PubMed
    1. Bjarnadóttir T. K. et al., The human and mouse repertoire of the adhesion family of G-protein-coupled receptors. Genomics 84, 23–33 (2004). - PubMed
    1. Lin H. H. et al., Autocatalytic cleavage of the EMR2 receptor occurs at a conserved G protein-coupled receptor proteolytic site motif. J. Biol. Chem. 279, 31823–31832 (2004). - PubMed

Publication types

Substances