. 2020 Oct 20;117(42):26398-26405.
doi: 10.1073/pnas.2009165117. Epub 2020 Oct 1.

A microstructural neural network biomarker for dystonia diagnosis identified by a DystoniaNet deep learning platform

Affiliations

A microstructural neural network biomarker for dystonia diagnosis identified by a DystoniaNet deep learning platform

Davide Valeriani et al. Proc Natl Acad Sci U S A. .

Abstract

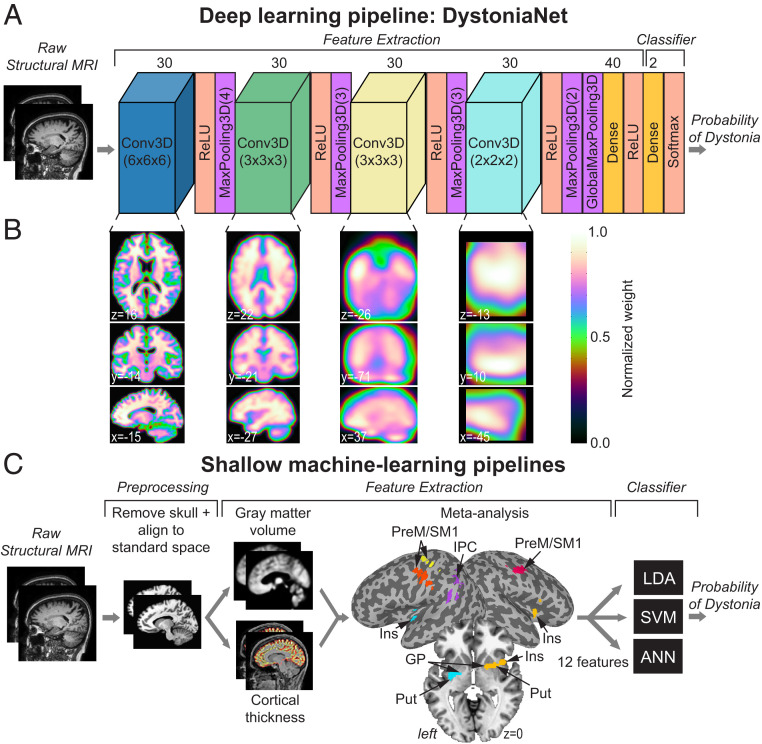
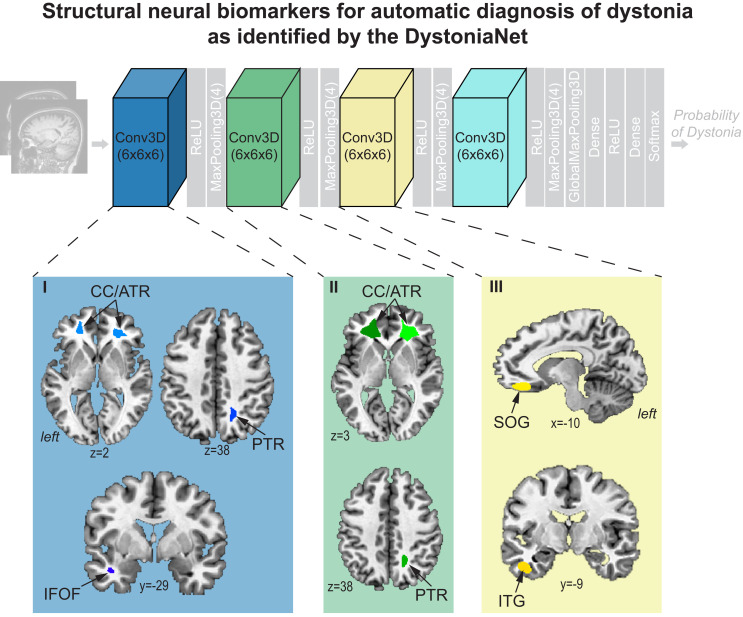
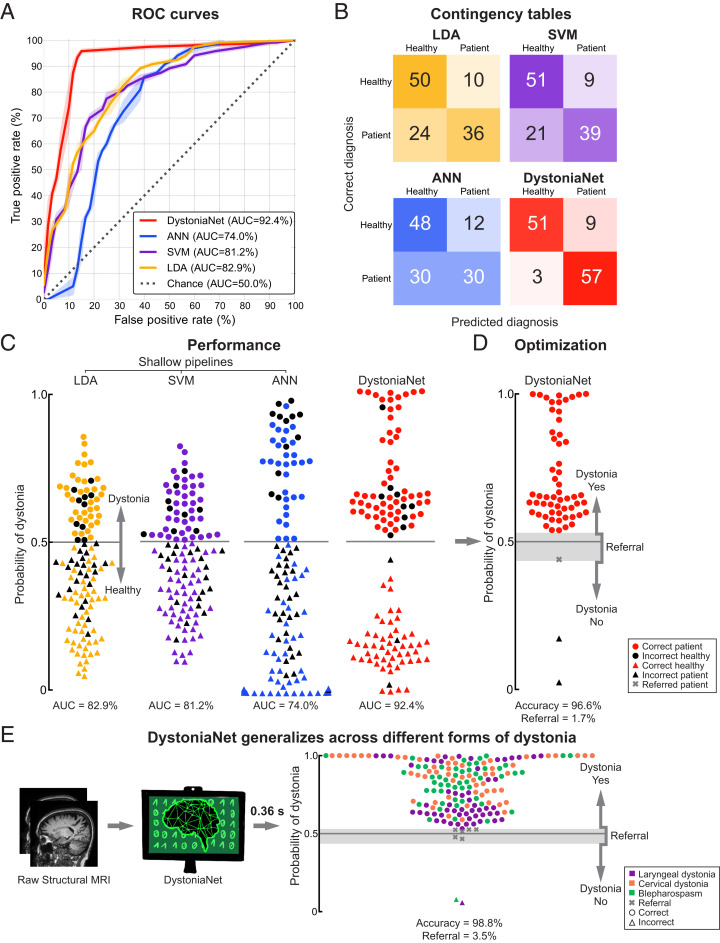
Isolated dystonia is a neurological disorder of heterogeneous pathophysiology, which causes involuntary muscle contractions leading to abnormal movements and postures. Its diagnosis is remarkably challenging due to the absence of a biomarker or gold standard diagnostic test. This leads to a low agreement between clinicians, with up to 50% of cases being misdiagnosed and diagnostic delays extending up to 10.1 y. We developed a deep learning algorithmic platform, DystoniaNet, to automatically identify and validate a microstructural neural network biomarker for dystonia diagnosis from raw structural brain MRIs of 612 subjects, including 392 patients with three different forms of isolated focal dystonia and 220 healthy controls. DystoniaNet identified clusters in corpus callosum, anterior and posterior thalamic radiations, inferior fronto-occipital fasciculus, and inferior temporal and superior orbital gyri as the biomarker components. These regions are known to contribute to abnormal interhemispheric information transfer, heteromodal sensorimotor processing, and executive control of motor commands in dystonia pathophysiology. The DystoniaNet-based biomarker showed an overall accuracy of 98.8% in diagnosing dystonia, with a referral of 3.5% of cases due to diagnostic uncertainty. The diagnostic decision by DystoniaNet was computed in 0.36 s per subject. DystoniaNet significantly outperformed shallow machine-learning algorithms in benchmark comparisons, showing nearly a 20% increase in its diagnostic performance. Importantly, the microstructural neural network biomarker and its DystoniaNet platform showed substantial improvement over the current 34% agreement on dystonia diagnosis between clinicians. The translational potential of this biomarker is in its highly accurate, interpretable, and generalizable performance for enhanced clinical decision-making.

Keywords: biomarker; brain MRI; dystonia; machine learning.


Conflict of interest statement

The authors declare no competing interest.

Figures

Fig. 1.
Fig. 1.
Deep learning and shallow machine-learning pipelines for diagnosis of isolated dystonia. (A) Raw structural brain MRIs were used with the deep learning pipeline (DystoniaNet). The architecture of DystoniaNet included four convolutional layers (Conv3D) for feature extraction from raw structural MR images, each followed by the rectified linear unit (ReLU) activation and maximum pooling (MaxPooling3D) layers. The kernel sizes of each Conv3D layer were 6 × 6 × 6, 3 × 3 × 3, 3 × 3 × 3, and 2 × 2 × 2 voxels, respectively. The kernel sizes of each MaxPooling3D layer were 4 × 4 × 4, 3 × 3 × 3, 3 × 3 × 3, and 2 × 2 × 2, respectively (given in the brackets). The global maximum pooling layer (GlobalMaxPooling3D) followed the fourth MaxPooling3D layer and was followed by a fully connected Dense layer of 40 filters. The classifier included dense layer of two filters with Softmax activation, with the probability of dystonia as the output. (B) Axial brain slices depict 2D visualization of the average 3D feature maps extracted from the corresponding Conv3D layers of DystoniaNet. The color bar shows the normalized weight of discriminative voxels learned by DystoniaNet based on the training set of 160 patients with laryngeal dystonia and 160 healthy controls. Coordinates are given in the AFNI standard Talairach–Tournoux space. (C) Shallow machine-learning pipelines show the steps for preprocessing of raw structural MRI (skull removal and alignment to the AFNI standard space), extraction of 12 features from gray matter volume and cortical thickness based on meta-analysis of neuroimaging literature in laryngeal dystonia, and their input into three machine-learning classifiers: linear discriminant analysis (LDA), support vector machine (SVM), and artificial neural network (ANN), with the probability of dystonia as the output. PreM, premotor cortex; SM1, primary sensorimotor cortex; IPC, inferior parietal cortex; Ins, insula; Put, putamen; GP, globus pallidus.
Fig. 2.
Fig. 2.
Microstructural neural network biomarker for automatic diagnosis of isolated dystonia as identified by the DystoniaNet platform. Brain regions as components of the biomarker are identified by the first three convolutional layers of DystoniaNet for diagnostic classification. Brain regions in the fourth layer are not visualized due to low spatial resolution. Axial and sagittal brain slices depict 2D visualizations of the most discriminative features in the AFNI standard Talairach–Tournoux space. ReLU, rectified linear unit; CC/ATR, corpus callosum/anterior thalamic radiation of corona radiata; PTR, posterior thalamic radiation of corona radiata; IFOF, inferior fronto-occipital fasciculus; SOG, superior orbital gyrus; ITG, inferior temporal gyrus.
Fig. 3.
Fig. 3.
Performance of deep learning and shallow machine-learning pipelines. (A) Receiver operating characteristic (ROC) curves for each pipeline using the first independent test set of 60 patients with laryngeal dystonia and 60 healthy controls. The area under the ROC curve (AUC) values for each pipeline are reported in the key. The dotted line represents the performance of a random classifier. (B) The corresponding contingency tables report the number of healthy controls and patients who are correctly and incorrectly classified by each pipeline. (C) The diagnostic performance of each pipeline in the first independent test set of 60 patients with laryngeal dystonia and 60 healthy controls. Each symbol represents a subject. Subjects classified as patients are represented by circles; subjects classified as healthy controls are represented by triangles. Colored symbols represent correct diagnosis; black symbols represent misclassifications. The y axis represents the probability of dystonia as assessed by each pipeline; the gray line represents the decision boundary. The corresponding AUC values are given for each pipeline. (D) Optimized DystoniaNet with a dynamic range to maximize diagnostic performance in 60 laryngeal dystonia patients of the first independent test set. The gray shading represents the area of uncertainty where DystoniaNet refers the subject (gray cross) for further examination. The y axis represents the probability of dystonia; the gray line represents the decision boundary. The corresponding accuracy and referral rate are reported. (E) Testing of generalizability of the DystoniaNet-derived biomarker in the second independent test set of 172 patients with different forms of dystonia, including 59 patients with laryngeal dystonia, 59 patients with cervical dystonia, and 54 patients with blepharospasm. The pipeline shows the steps from the use of raw structural MRI as input to the final optimized DystoniaNet, which processes data and outputs the final diagnostic decision as dystonia-yes, dystonia-no, or referral within 0.36 s for each subject. Each symbol represents a subject. Subjects classified as patients are represented by circles; misclassified subjects are represented by triangles; referrals are represented by crosses. The y axis represents the probability of dystonia; the gray line represents the decision boundary; the gray shading shows the area of diagnostic uncertainty (referral). The corresponding accuracy and referral rate are reported. Data are visualized using the Matplotlib library (63).

References

    1. Sadnicka A., Kornysheva K., Rothwell J. C., Edwards M. J., A unifying motor control framework for task-specific dystonia. Nat. Rev. Neurol. 14, 116–124 (2018). - PMC - PubMed
    1. Hellberg C., Alinder E., Jaraj D., Puschmann A., Nationwide prevalence of primary dystonia, progressive ataxia and hereditary spastic paraplegia. Parkinsonism Relat. Disord. 69, 79–84 (2019). - PubMed
    1. Defazio G. et al., The Italian dystonia registry: Rationale, design and preliminary findings. Neurol. Sci. 38, 819–825 (2017). - PubMed
    1. Creighton F. X. et al., Diagnostic delays in spasmodic dysphonia: A call for clinician education. J. Voice 29, 592–594 (2015). - PMC - PubMed
    1. de Lima Xavier L., Simonyan K., The extrinsic risk and its association with neural alterations in spasmodic dysphonia. Parkinsonism Relat. Disord. 65, 117–123 (2019). - PMC - PubMed

Publication types

MeSH terms