. 2020 Nov 20;370(6519):eaay8826.
doi: 10.1126/science.aay8826. Epub 2020 Oct 1.

Autosomal dominant VCP hypomorph mutation impairs disaggregation of PHF-tau

Affiliations

Autosomal dominant VCP hypomorph mutation impairs disaggregation of PHF-tau

Nabil F Darwich et al. Science. .

Abstract

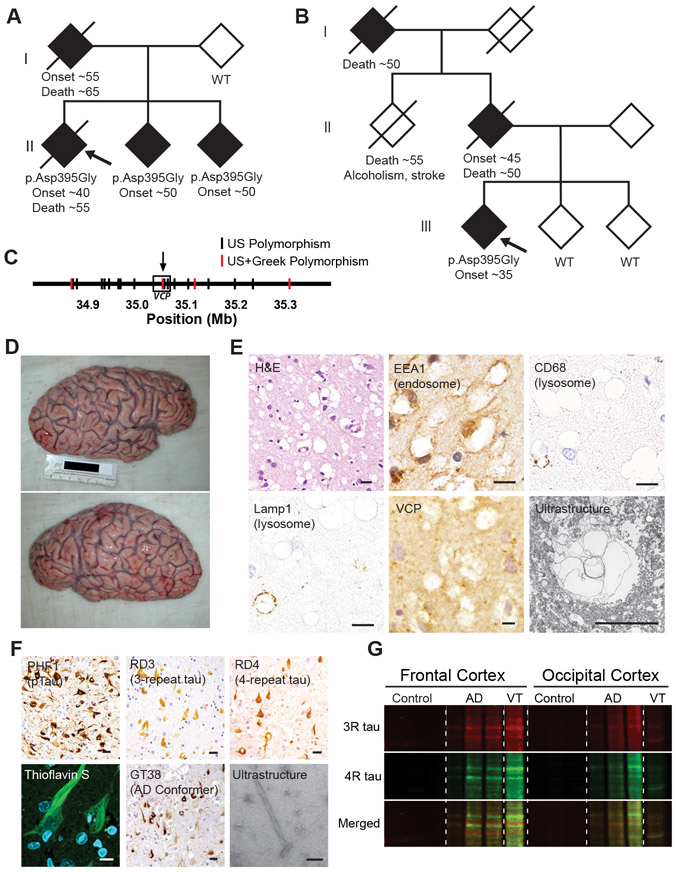
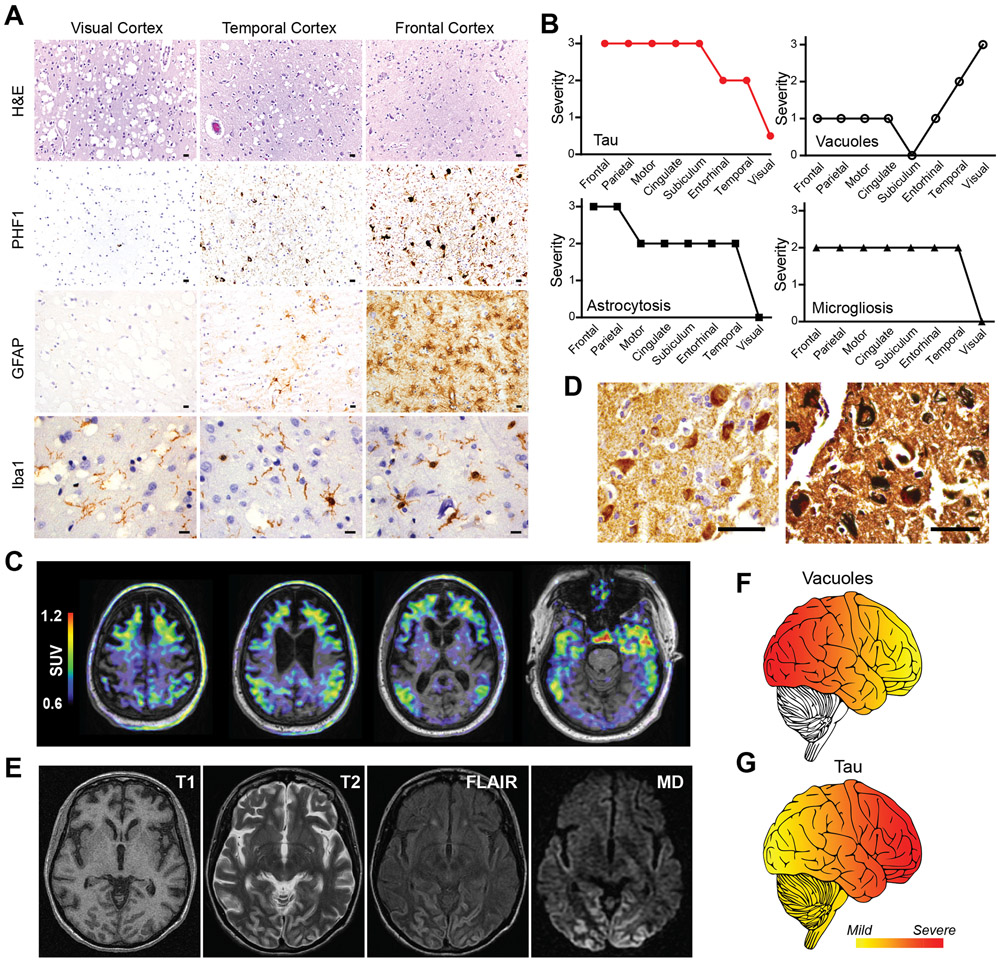
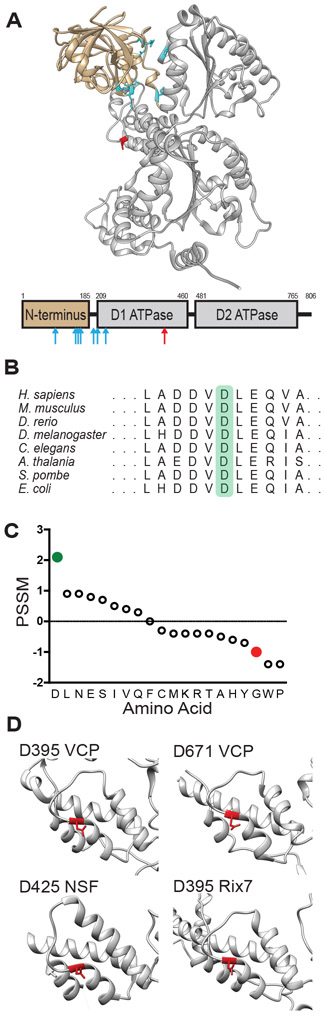
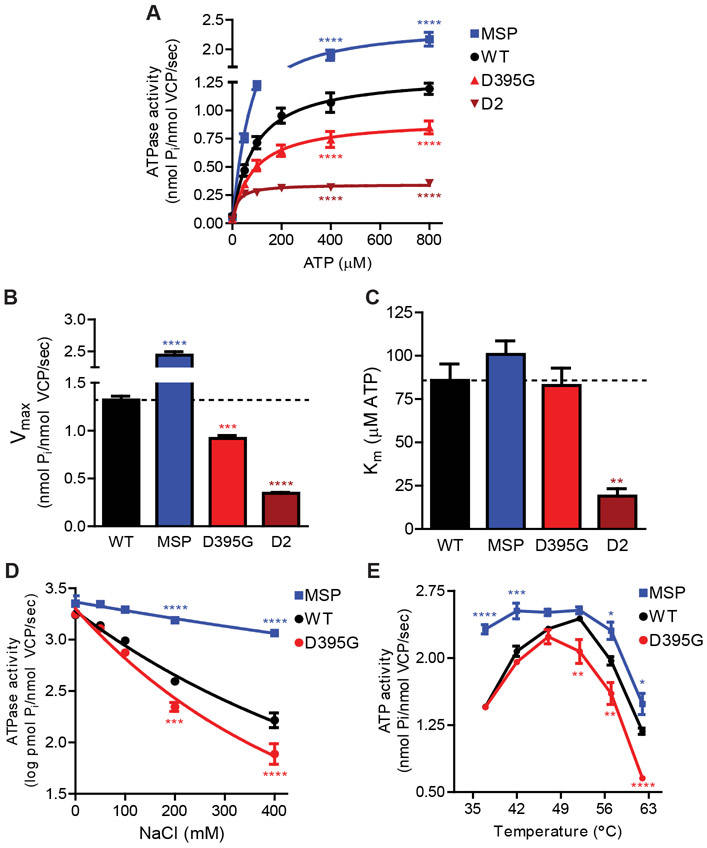
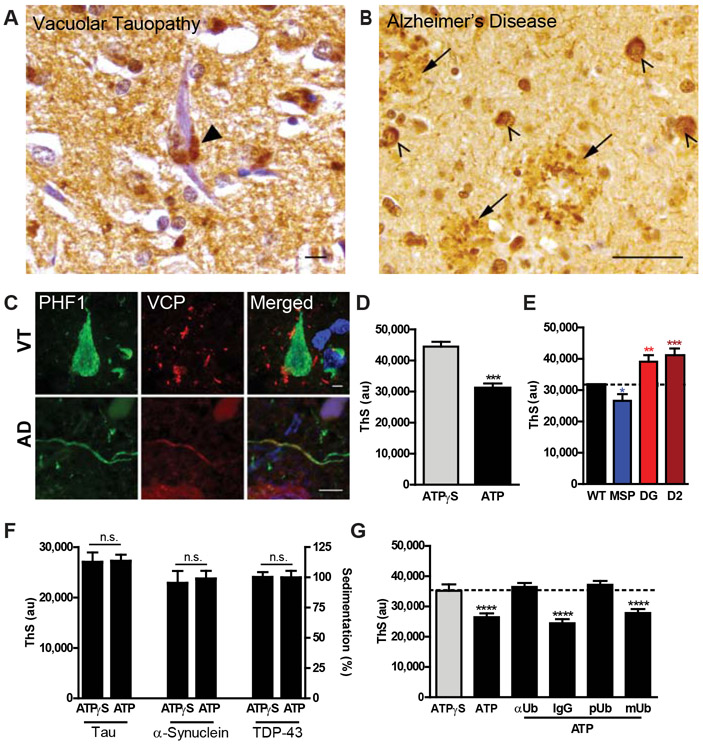
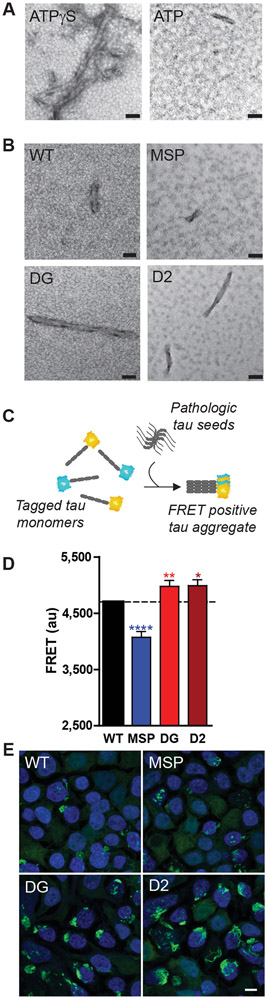
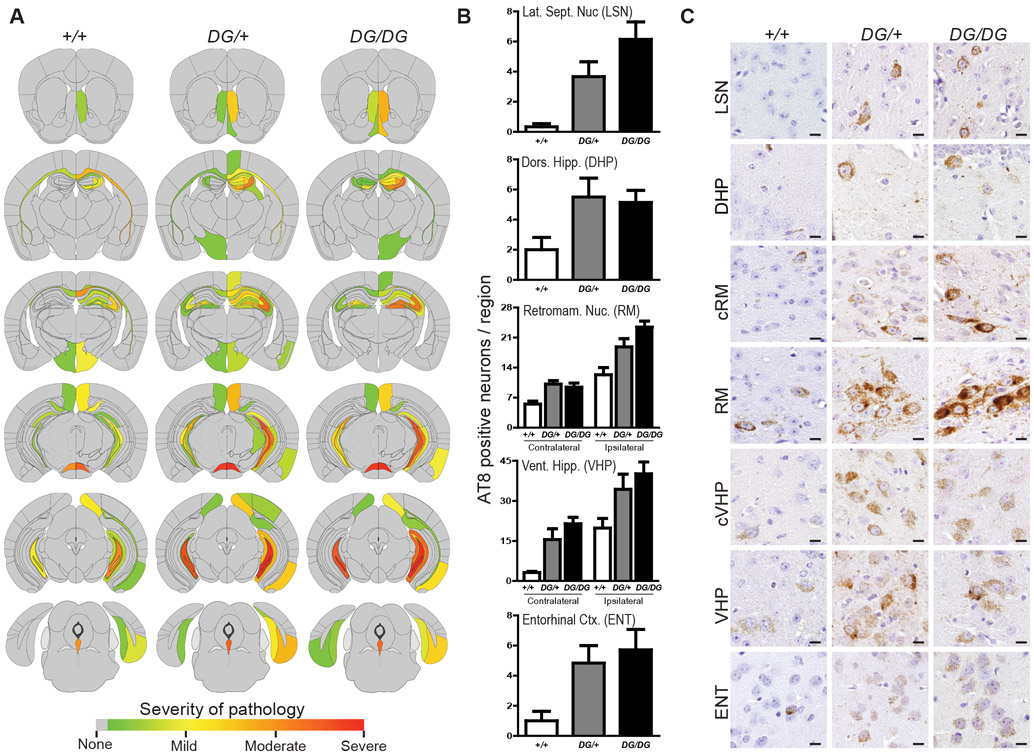
Neurodegeneration in Alzheimer's disease (AD) is closely associated with the accumulation of pathologic tau aggregates in the form of neurofibrillary tangles. We found that a p.Asp395Gly mutation in VCP (valosin-containing protein) was associated with dementia characterized neuropathologically by neuronal vacuoles and neurofibrillary tangles. Moreover, VCP appeared to exhibit tau disaggregase activity in vitro, which was impaired by the p.Asp395Gly mutation. Additionally, intracerebral microinjection of pathologic tau led to increased tau aggregates in mice in which p.Asp395Gly VCP mice was knocked in, as compared with injected wild-type mice. These findings suggest that p.Asp395Gly VCP is an autosomal-dominant genetic mutation associated with neurofibrillary degeneration in part owing to reduced tau disaggregation, raising the possibility that VCP may represent a therapeutic target for the treatment of AD.


Figures

Fig. 1
Fig. 1. p.Asp395Gly VCP is associated with vacuolar tauopathy.
(A and B) Family pedigrees for the kindred from the United States (A) or Greece (B) showing an autosomal dominant pattern of inheritance with shaded shapes denoting individuals with FTD. VCP genotype, approximate age of disease onset and death are listed, if available. Proband denoted by arrow. (C) Distinct VCP haplotypes suggest absence of a common founder mutation. Genotype data was extracted from whole genome sequencing where polymorphisms shared between the three affected American siblings but absent in their unaffected parent are shown in black, and polymorphisms which are additionally found in the affected Greek individual are highlighted in red. VCP designated by box with arrow showing location of the p.Asp395Gly VCP mutation. (D) Gross photographs of VT brain showing circumscribed frontal atrophy. (E) Vacuolar neuropathology. Representative hematoxylin and eosin (H&E), antibody immunostain, or electron microscopic ultrastructure images are shown. Scales bars are 10 μm. (F) Neuropathology of tau aggregates. Representative antibody immunostain, thioflavin S stain, or electron microscopic ultrastructure images are shown. Scale bars are 10 μm except for electron microscopy which is 200 nm. (G) Biochemical analysis of pathologic tau. Sarkosyl-insoluble frontal and occipital neocortex lysates from control, AD, or VT were immunoblotted for 3-repeat (RD3, red) and 4-repeat tau (anti-4R tau, green).
Fig. 2
Fig. 2. Inverse regional relationship between vacuoles and neurofibrillary degeneration in vacuolar tauopathy.
(A) Rostral to caudal gradient of vacuoles versus neurofibrillary degeneration. Representative hematoxylin and eosin (H&E), PHF1 (phospho-tau), GFAP (astrocyte), and Iba1 (microglia) stained images from occipital/visual, temporal, and frontal neocortical regions are shown. Scale bars are 10 μm. (B) Regional scoring of tau accumulation, vacuoles, astrogliosis, and microgliosis. Cortical brain regions were scored for severity of tau (red), vacuoles (circles), astrogliosis (squares), and microgliosis (triangles). Severity scores ranged from 0 (none) to 3 (severe). (C) Neuroimaging of affected kindred. Overlaid T1-weighted MRI and tau PET images from affected p.Asp395Gly VCP carrier pseudocolored to standard uptake values (SUV). (D) Cerebral biopsy of Greek proband demonstrates neurofibrillary tangles. Representative images of AT8 (phospho-tau, left) and Gallyas silver (right) stained sections from a frontal neocortex biopsy. Scale bars are 50 μm (left) and 20 μm (right). (E) Neuroimaging of Greek proband. MRI neuroimaging images are shown including T1, T2, fluid-attenuated inversion recovery (FLAIR), and MD from diffuse tensor imaging. (F and G) Schematic showing the distribution of (F) vacuole or (G) tau pathology is illustrated (yellow=mild, red=severe) where vacuoles were most severe in caudal neocortical regions in contrast with tau aggregates which were most severe in rostral neocortical regions.
Fig. 3
Fig. 3. In silico analysis of D395 VCP.
(A) Structure of VCP monomer. N terminal domain is tan, D1 and D2 ATPase domains are gray, MSP mutations are cyan, and VT mutation is red (PDB 5C19). The primary structure of VCP is underneath with the same color scheme, mutations marked by arrows. (B) Conservation of D395 VCP across species (highlighted in green). (C) PSSM scores for conservation in VCP homologues for amino acids including aspartic acid (D, green) and glycine (G, red). (D) Common aspartic acid N-cap in AAA+ proteins. The structures of several AAA+ proteins are shown with D395, or its equivalent, highlighted in red (VCP PDB 5C19, NSF PDB 1NSF, Rix7 PDB 6MAT).
Fig. 4
Fig. 4. ATPase activity of mutant VCP proteins.
(A) Michaelis-Menten kinetic ATPase analysis. Recombinant WT, MSP, p.Asp395Gly, and D2 VCP proteins were assessed for ATPase activity over a range of ATP concentrations (n=3). ATPase activity shown as mean +/− SEM (two-way ANOVA: mutation p<0.0001; ATP p<0.0001; interaction p<0.0001; Bonferroni posthoc shown for only 400 and 800 μM ATP ****p<0.0001). (B) Vmax values and (C) Km from Michaelis-Menten kinetics (n=3). Data shown as mean +/− SEM (one-way ANOVA: Vmax p<0.0001; Km p=0.0005; Bonferroni posthoc **p<0.01 ***p<0.001 ****p<0.0001). (D) Salt denaturation of recombinant VCP proteins. VCP ATPase activity was assessed across NaCl concentrations (n=5). ATPase activity shown as mean +/− SEM (two-way ANOVA: mutation p<0.0001; NaCl p<0.0001; interaction p<0.0001; Bonferroni posthoc shown for only 200 and 400 mM NaCl ***p<0.001 ****p<0.0001). (E) Heat activation and denaturation of recombinant VCP proteins. VCP ATPase activity was assessed across temperature (n=3). ATPase activity shown as mean +/− SEM (two-way ANOVA: mutation p<0.0001; temperature p<0.0001; interaction p<0.0001; Bonferroni posthoc *p<0.05 **p<0.01 ***p<0.001 ****p<0.0001).
Fig. 5
Fig. 5. ATP- and polyubiquitin- dependent tau disaggregase activity of VCP.
(A) VT neocortex showing granular VCP immunostaining (arrowhead) adjacent to a NFT. Scale bar is 10 μm. (B) AD neocortex showing VCP immunostaining within NFTs (arrows) and dystrophic neurites in neuritic plaques (arrowheads). Scale bar is 50 μm. (C) Localization of VCP and tau in human VT and AD tissues. Double immunofluorescence of VCP (green) and PHF1 (phospho-tau, red) in VT (top) and AD (bottom). Scale bars are 5 μm. (D) Recombinant VCP activity against pathologic PHF-tau. ThS fluorescence after incubation of human AD tissue derived pathologic tau with recombinant VCP, UFD1, NPLOC4, and either ATPγS or ATP (n=5). ThS signal shown as mean +/− SEM (two-tailed t-test, ***p=0.0003). (E) Mutant VCP activities against pathologic PHF-tau. ThS fluorescence after incubation of pathologic tau with recombinant WT, MSP, p.Asp395Gly (DG), or D2 VCP (n=5). ThS signal shown as beta +/− SEM (mixed effects model, MSP *p=0.0272; **DG p=0.0036; ***D2 p=0.0005). (F) VCP activity against recombinant protein aggregates. Recombinant tau, α-synuclein, or TDP-43 aggregates were incubated with VCP, VCP cofactors, and ATPγS or ATP. ThS fluorescence signal shown as a mean +/− SEM for tau (n=3) and α-synuclein (n=3). Sedimentation data shown as mean percent of average of ATPγS samples +/− SEM for TDP-43 (n=5). Pairwise testing by two-tail t-test resulted in non-significance (n.s.). (G) Polyubiquitin-dependence of VCP activity against pathologic PHF-tau. ThS fluorescence after addition of anti-ubiquitin monoclonal antibody (αUb), nonspecific isotope control (IgG), recombinant polyubiquitin (pUb), or recombinant monoubiquitin (mUb) to VCP, VCP cofactors, pathologic tau, and ATP (black with underline, n=5). Reactions with only VCP, VCP cofactors, pathologic tau, and either ATP or ATPγS (black and gray bar, respectively) were run in parallel as controls. ThS fluorescence signal shown as beta +/− SEM (mixed effects model: ATP, αUb, pUb ****p<0.0001).
Fig. 6
Fig. 6. VCP activity against pathologic tau fibrils and cellular tau aggregates.
(A) Electron microscopy of human AD tissue derived PHF tau fibrils after treatment with recombinant VCP, UFD1, NPLOC4, and either ATPγS or ATP (n=3). Scales bars are 50 nm. (B) Electron microscopy of VCP tau disaggregase reactions with recombinant WT VCP protein versus MSP, p.Asp395Gly (DG), and D2 mutant VCP proteins (n=3). Scales bars are 50 nm. (C) Schematic of tau seeding in tau biosensor cells. (D and E) Biosensor cells expressing WT or mutant VCP were transduced with human AD tissue derived pathologic tau (n=5). (D) FRET signal was assessed by flow cytometry and shown as beta +/− SEM (mixed effects model: MSP ****p<0.0001; **DG p=0.0095, *D2 p=0.0126). (E) Representative confocal fluorescence microscopy images of biosensor cells with intracellular tau aggregates (green) and DAPI nuclear counterstain (blue). Scale bar is 10 μm.
Fig. 7
Fig. 7. p.Asp395Gly VCP exacerbates tau pathology in vivo.
(A) Semiquantitative analysis of AT8-positive phospho-tau pathology. Six-month old wild-type (+/+), heterozygous p.Asp395Gly (DG/+), and homozygous p.Asp395Gly (DG/DG) knock-in mice analyzed three months after injection of pathologic tau in the right dorsal hippocampus and overlying cortex (n=6-7 mice per genotype). Semiquantitative scores were averaged across mice of the same genotype and mapped onto coronal brain maps (grey=no pathology, red=severe pathology). (B) Regional quantitative analysis of AT8-positive phospho-tau pathology. The number of AT8-positive neurons was counted across different brain regions, shown as beta +/− SEM (mixed effects model: DG/+ p=0.0005; DG/DG p<0.0001). (C) Tau pathology in p.Asp395Gly knock-in mice. Representative AT8 immunostained images are shown. Scale bars are 10 μm. LSN lateral septal nucleus, DHP dorsal hippocampus, RM retromammillary nucleus, VHP ventral hippocampus, ENT entorhinal cortex, c contralateral.

References

    1. Braak H, Alafuzoff I, Arzberger T, Kretzschmar H, Del Tredici K, Staging of Alzheimer disease-associated neurofibrillary pathology using paraffin sections and immunocytochemistry. Acta Neuropathol 112, 389 (October, 2006). - PMC - PubMed
    1. Kovacs GG, Tauopathies. Handb Clin Neurol 145, 355 (2017). - PubMed
    1. Spillantini MG, Goedert M, Tau pathology and neurodegeneration. Lancet Neurol 12, 609 (June, 2013). - PubMed
    1. Lee VM, Goedert M, Trojanowski JQ, Neurodegenerative tauopathies. Annu Rev Neurosci 24, 1121 (2001). - PubMed
    1. van den Boom J, Meyer H, VCP/p97-Mediated Unfolding as a Principle in Protein Homeostasis and Signaling. Mol Cell 69, 182 (January 18, 2018). - PubMed

Publication types

MeSH terms