. 2020 Oct 2;5(19):e138808.
doi: 10.1172/jci.insight.138808.

CAR T cells targeting tumor endothelial marker CLEC14A inhibit tumor growth

Affiliations

CAR T cells targeting tumor endothelial marker CLEC14A inhibit tumor growth

Xiaodong Zhuang et al. JCI Insight. .

Abstract

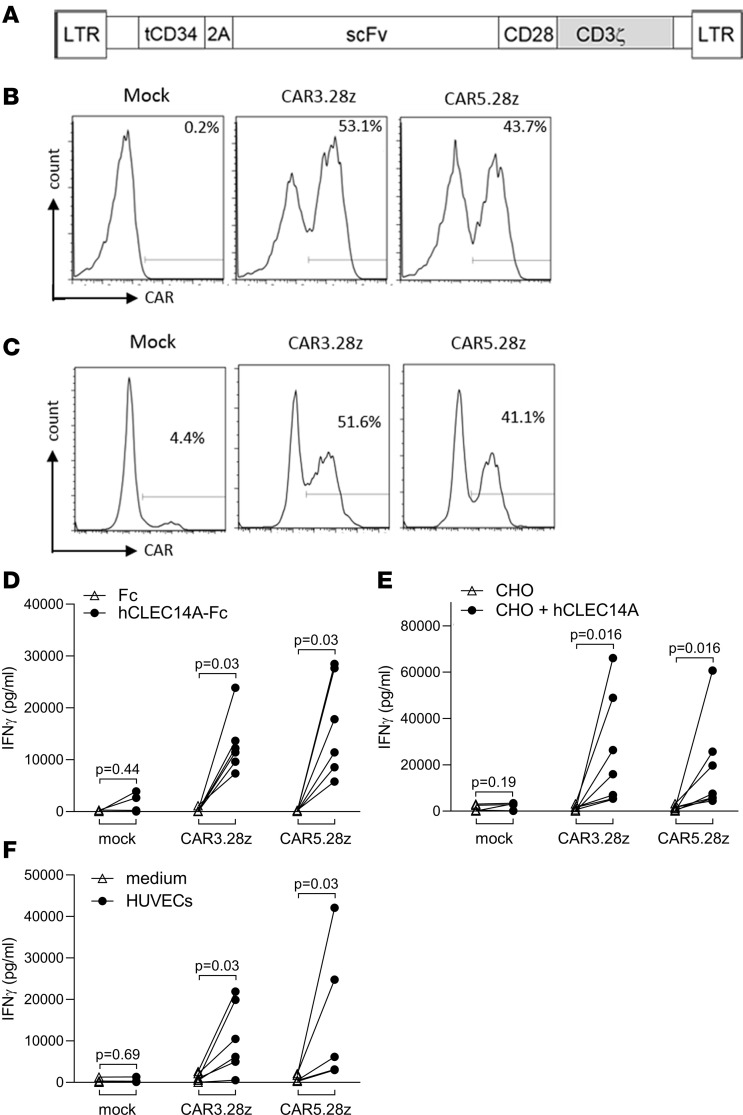
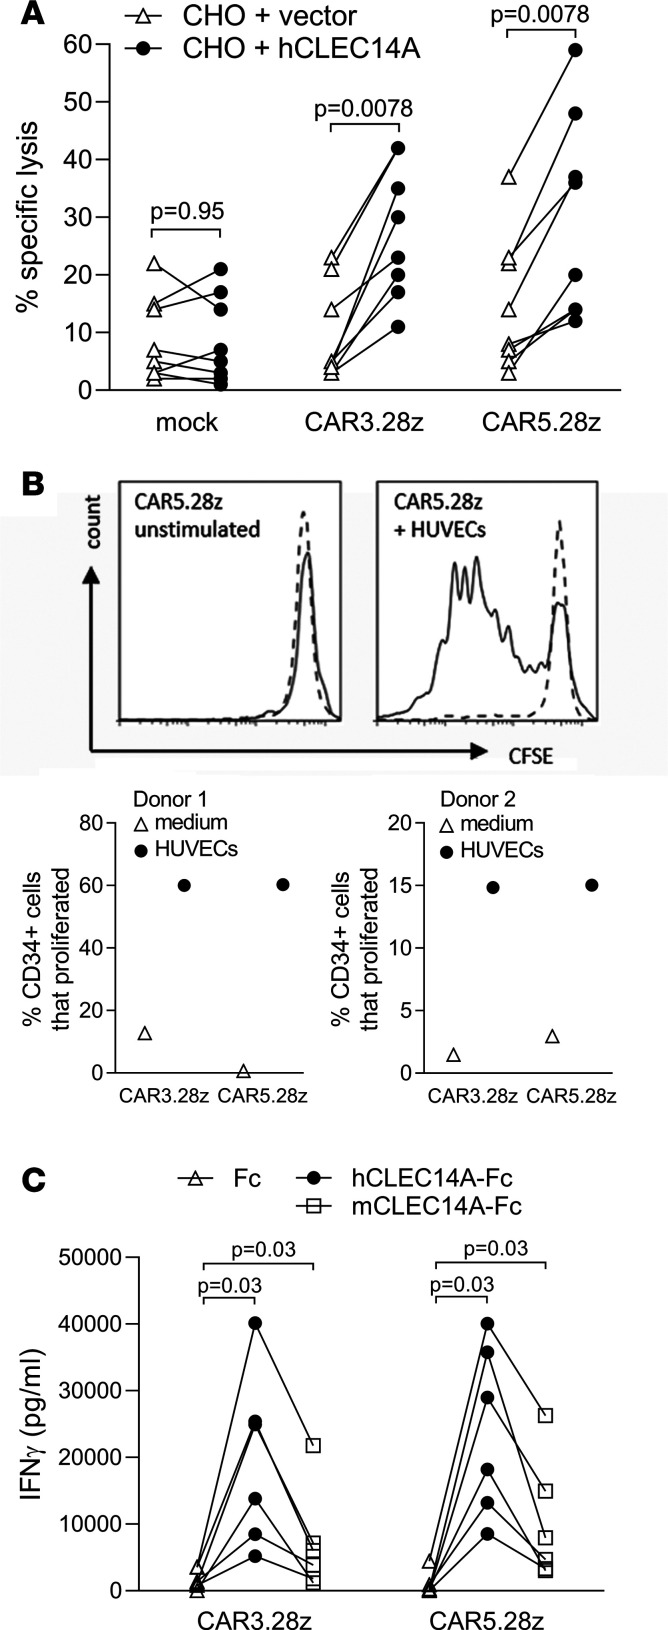
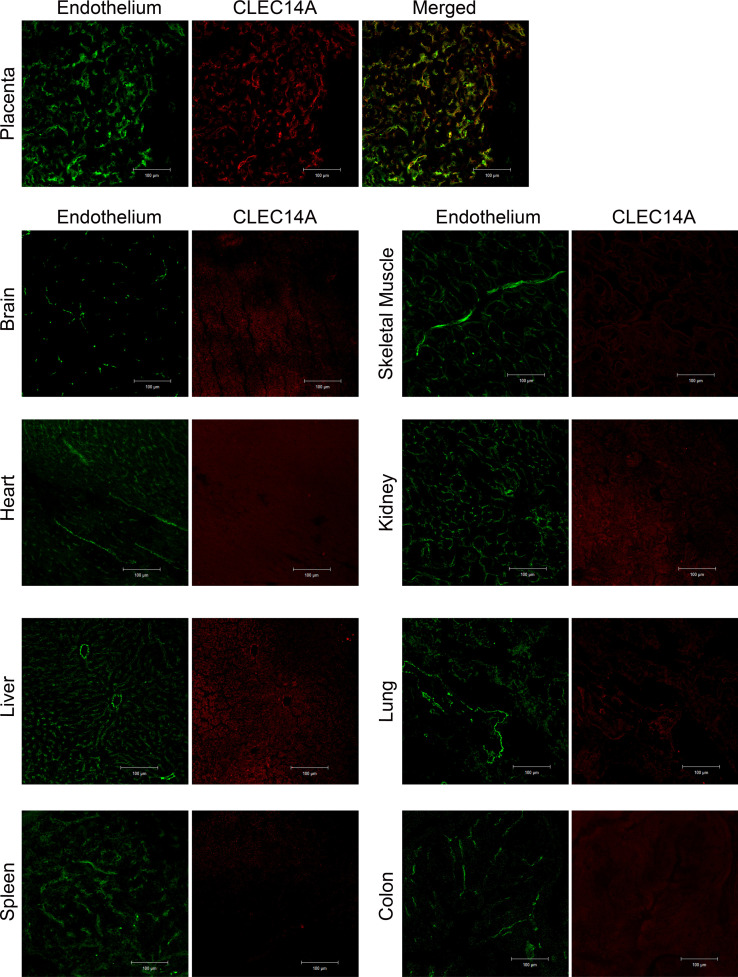
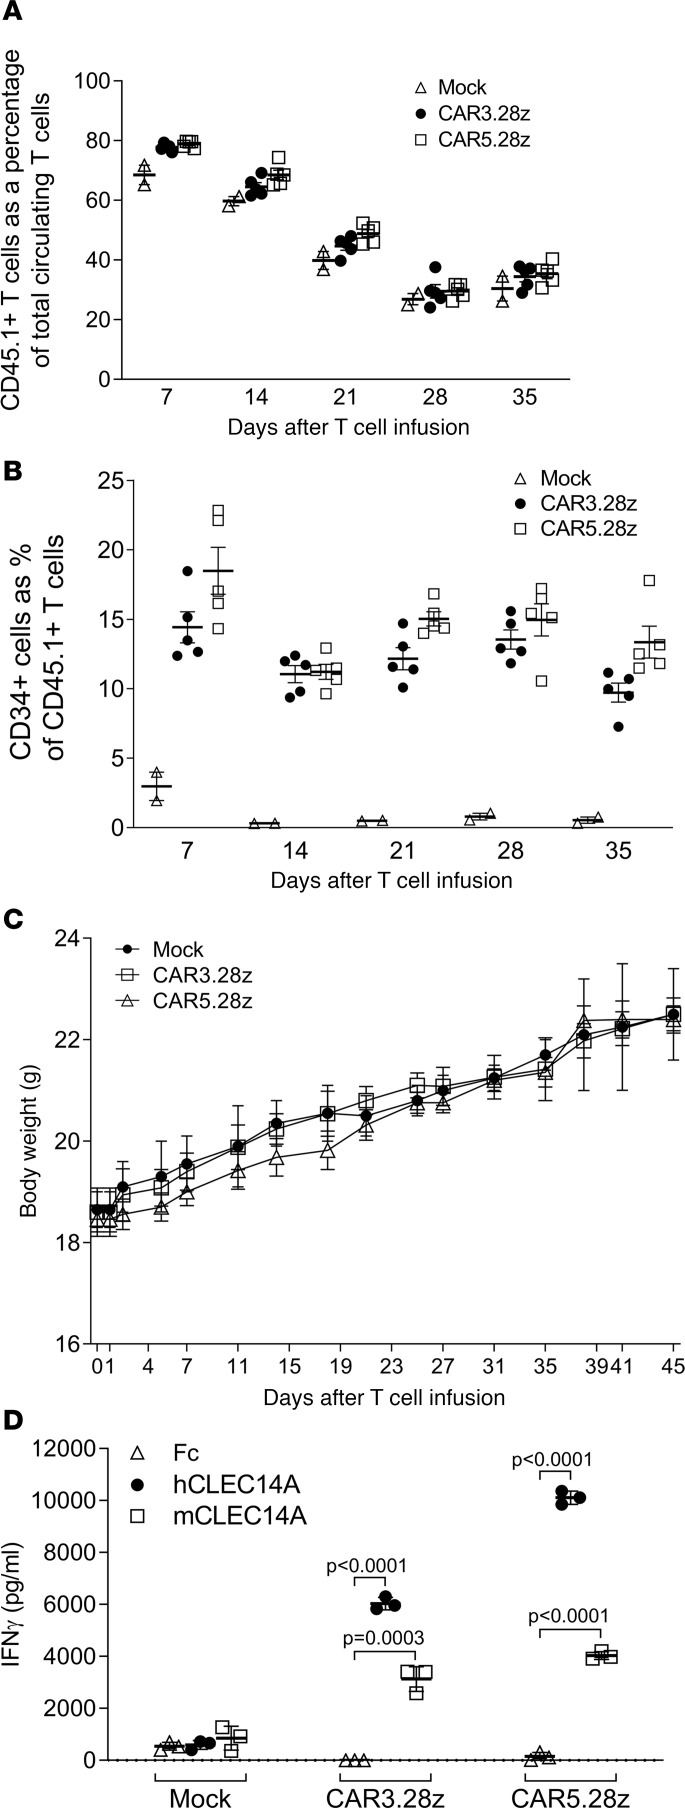
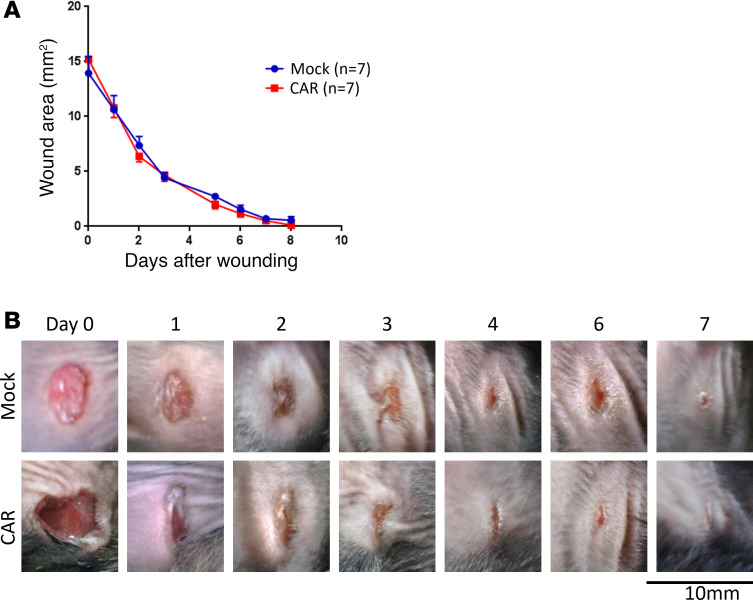
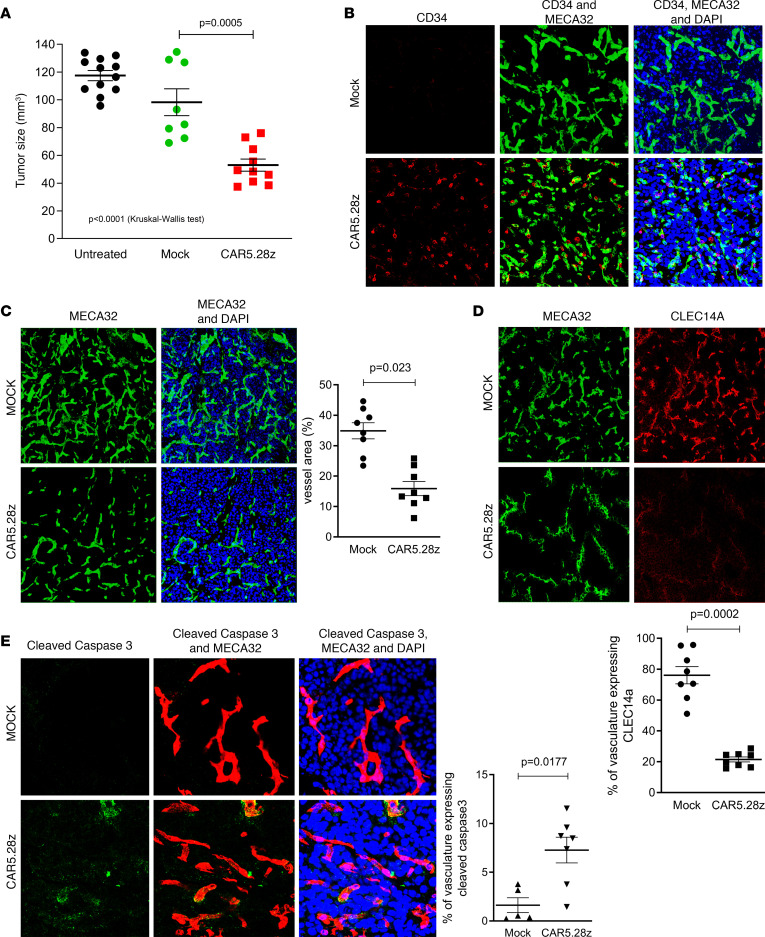
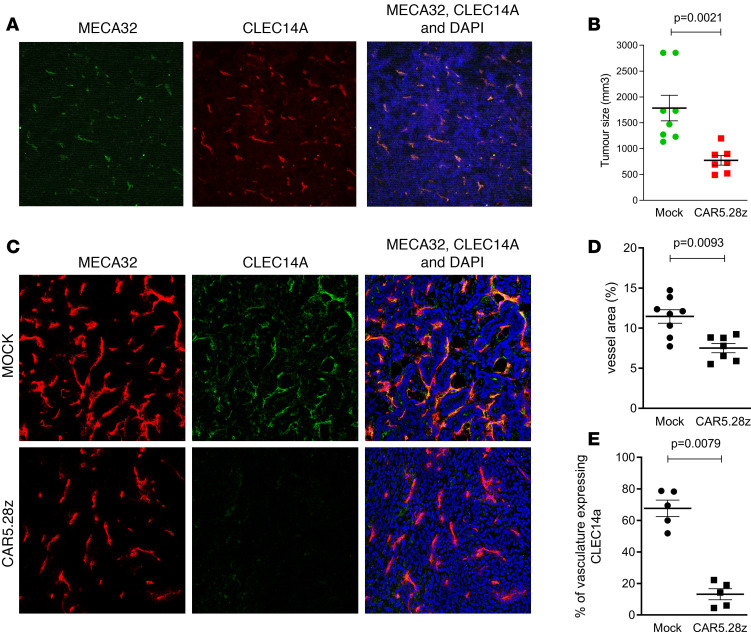
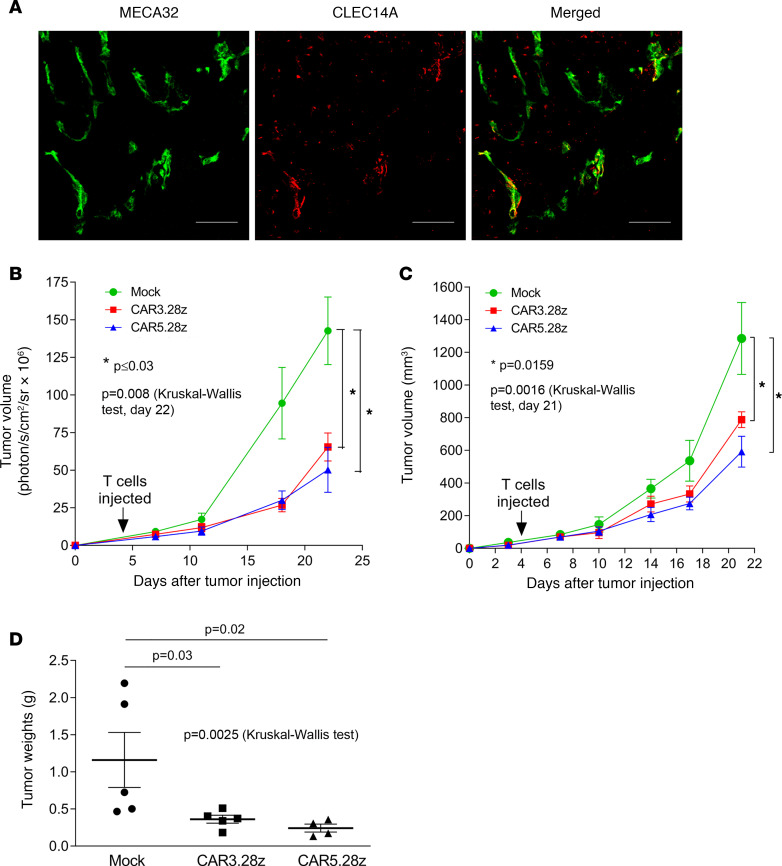
Engineering T cells to express chimeric antigen receptors (CARs) specific for antigens on hematological cancers has yielded remarkable clinical responses, but with solid tumors, benefit has been more limited. This may reflect lack of suitable target antigens, immune evasion mechanisms in malignant cells, and/or lack of T cell infiltration into tumors. An alternative approach, to circumvent these problems, is targeting the tumor vasculature rather than the malignant cells directly. CLEC14A is a glycoprotein selectively overexpressed on the vasculature of many solid human cancers and is, therefore, of considerable interest as a target antigen. Here, we generated CARs from 2 CLEC14A-specific antibodies and expressed them in T cells. In vitro studies demonstrated that, when exposed to their target antigen, these engineered T cells proliferate, release IFN-γ, and mediate cytotoxicity. Infusing CAR engineered T cells into healthy mice showed no signs of toxicity, yet these T cells targeted tumor tissue and significantly inhibited tumor growth in 3 mouse models of cancer (Rip-Tag2, mPDAC, and Lewis lung carcinoma). Reduced tumor burden also correlated with significant loss of CLEC14A expression and reduced vascular density within malignant tissues. These data suggest the tumor vasculature can be safely and effectively targeted with CLEC14A-specific CAR T cells, offering a potent and widely applicable therapy for cancer.

Keywords: Cancer immunotherapy; Immunology; Immunotherapy; Oncology; T cells.


Conflict of interest statement

Conflict of interest: SPL, XZ, and RB are listed as inventors on the following patent application/patent families: PCT/GB2010/001689 (published as WO2011/027132), PCT/GB2016/050134 (published as WO2016/116760), PCT/GB2017/050686, and PCT/GB2017/050689. DG is a founder and shareholder in Cellular Therapeutics Ltd. and an employee of Celyad SA.

Figures

Figure 1
Figure 1. CLEC14A-specific CAR design, expression, and function.
(A) Schematic representation of a recombinant retroviral vector encoding CLEC14A-specific CARs. Retroviral CAR vector (pMP71) coexpresses a truncated CD34 marker gene and an scFv fragment/CD3ζ chain chimeric receptor with a CD28 costimulatory domain. Expression is driven from the LTR promoter, and the 2A peptide linker ensures equimolar expression of both molecules. (B) Recombinant retroviral expression vectors encoding CARs CAR3.28z and CAR5.28z (with scFv fragments from CLEC14A-specific monoclonal antibodies CRT3 or CRT5, respectively) were used to transduce human T cells. CAR expression was detected by staining for the CD34 marker. Percentage values show proportion of cells stained for CD34 compared with mock-transduced T cells. (C) Transduced T cells stained for expression of CAR using CLEC14A-Fc (percentage values show specific binding of CLEC14A-Fc having subtracted background staining with Fc alone). (DF) Human T cells engineered to express putative CLEC14A-specific CARs (or mock-transduced T cell controls) were tested using an ELISA for IFN-γ production for response to plate-bound recombinant CLEC14A-Fc (extracellular domain) fusion protein (or Fc alone) (D), CHO cells engineered to express full-length human CLEC14A (or CHO transduced with vector alone) (responder/stimulator [R/S] ratio = 6:1) (E), and HUVECs naturally expressing CLEC14A (or medium alone). (R/S ratio = 1:1) (F). In all cases, the different CAR T cell lines were diluted with mock T cells to equalize for transduction efficiency. Cells were stimulated for 18 hours before testing for IFN-γ production. Results of ELISAs show data from 6–7 repeat experiments, having subtracted background responses of T cells alone. All P values shown were calculated using a Wilcoxon matched-pairs signed rank test.
Figure 2
Figure 2. Further characterization of functional responses in CAR-transduced T cells.
(A) Human T cells expressing CLEC14A-specific CARs (or mock T cell controls) were tested for cytotoxicity against CHO cells engineered to express full-length human CLEC14A (or control CHO cells transduced with vector alone). Results show data from 8 repeat experiments (effector/target ratio = 9:1). (B) Such T cells were also tested for proliferation, measured by CFSE staining of CD34+ T cells (solid line) and CD34 T cells (dotted line) when cocultured with HUVECs or medium alone (unstimulated). Results show a histogram of T cells expressing CAR5.28z, and the 2 graphs below show data from 2 repeat experiments giving the percentage of CD34+ cells that proliferated for each of the CARs indicated (having subtracted the percentage of CD34+ T cells that proliferated in medium alone). (C) CLEC14A-specific CAR T cells (or mock T cell controls) were also tested for IFN-γ release in response to plate-bound recombinant human or mouse CLEC14A (both expressed as Fc-fusion proteins) or to Fc alone. Results show data from 6 repeat experiments. All P values shown were calculated using a Wilcoxon matched-pairs signed rank test.
Figure 3
Figure 3. Immunofluorescence staining for CLEC14A in healthy mouse tissues.
Confocal images of CLEC14A immunofluorescence staining of healthy mouse tissue. Green, MECA32 (kidney) or CD31 (all other tissues) staining for endothelial cells. Red, CLEC14A staining. Scale bars: 100 μm.
Figure 4
Figure 4. Toxicity testing of mouse T cells expressing CLEC14A-specific CARs in healthy mice.
C57BL/6 mice were conditioned by irradiation and then infused with mouse T cells from a congenic (CD45.1+) strain. These T cells expressed CAR3.28z (n = 5), CAR5.28z (n = 5), or no CAR (mock; n = 2). (A and B) Serial blood samples were analyzed by flow cytometry to determine the percentage of infused T cells in the circulating T cell pool (A) and the percentage of CAR-expressing (CD34+) T cells in the infused T cell population (B). (C) The animals showed no signs of toxicity, as illustrated by their consistent increase in body weight. Results in AC show the mean ± SEM. (D) Ex vivo analysis of CAR-expressing T cells (or mock T cells) recovered from the spleens of animals at the end of the experiment tested by ELISA for their ability to release IFN-γ when exposed to recombinant human or mouse CLEC14A protein. Results in D show the mean of triplicate cultures (±SD), with P values calculated using an unpaired t test, and are representative of 2 repeat experiments. All t tests were 2 tailed.
Figure 5
Figure 5. CLEC14A-specific CAR T cells do not affect wound healing.
C57BL/6 mice were injected s.c. on the flank with 1 × 10⁶ LLC cells and, 4 days later, injected with CLEC14A-specific CAR T cells (n = 7) or mock-transduced cells (n = 7). The next day, skin wounds were administered to the opposite flank of the mouse. (A) The size of the wound area was recorded over time (n = 7 mice per group; data shown are mean ± SEM). (B) Representative images of the wounds from mock- and CAR-treated mice at the time points indicated.
Figure 6
Figure 6. Antitumor responses in Rip-Tag2 mice.
Rip-Tag2 mice at 12 weeks of age were conditioned with 4 Gy total body irradiation and then infused with CAR5.28z-expressing mouse T cells (n = 12) or mock-transduced mouse T cells (n = 12). (A) Tumor size was measured at 14 or 16 weeks of age for mock- and CAR-treated animals, respectively. Results show tumor size for individual mice that survived to the end of the experiment, along with the mean ± SEM. Tumor sizes in 12 untreated (nonirradiated) mice measured at 14 weeks of age are included as a control. (B) CAR-transduced (CD34+) T cells were detectable by immunofluorescent imaging in CAR-treated RIP-Tag2 tumors 4 weeks after injection (red, CD34; green, MECA32 endothelial marker; blue, DAPI stain). Staining of tumor tissue from mock-treated animals is included as a control. CE show data from immunofluorescent imaging of CAR- and mock-treated tumor tissue, with representative images of staining plus a scatterplot of results from individual mice. (C) Data on vascular density (green, MECA32 endothelial marker; blue, DAPI). (D) CLEC14A expression in vessels (green, MECA32; red, CLEC14A). (E) Proportion of apoptotic vessels (green, cleaved caspase-3; red, MECA32; blue, DAPI). All scatterplots show mean ± SEM. All P values shown were calculated using a 2-tailed Mann-Whitney U test (except where indicated in A, where the 3 test groups were compared using a Kruskal-Wallis test).
Figure 7
Figure 7. Antitumor responses in PDAC mice.
(A) CLEC14A expression in PDAC tumor tissue (green, MECA32 endothelial marker; red, CLEC14A). FVB/n mice were injected into the pancreas with PDAC tumor cells and then conditioned 1 week later with cyclophosphamide. The following day, mice were infused with CAR5.28z-expressing mouse T cells (n = 7) or mock-transduced mouse T cells (n = 8). Three weeks later, mice were culled and tumor sizes were measured. (B) Results show tumor size for individual mice. (CE) Representative images of immunofluorescent staining of CAR- and mock-treated tumor tissue (red, MECA32 endothelial marker; green, CLEC14A; blue, DAPI; C) to determine vascular density (D) and density of CLEC14A+ vessels (E). All scatterplots show data from individual mice, with mean ± SEM. All P values shown were calculated using a 2-tailed Mann-Whitney U test.
Figure 8
Figure 8. Antitumor responses in the Lewis lung carcinoma mouse model.
(A) CLEC14A expression in Lewis lung carcinoma tissue (green, MECA32 endothelial marker; red, CLEC14A). Scale bar: 50 μm. C57BL/6 mice were s.c. injected with LLC cells and 4 days later infused with mouse T cells expressing CAR3.28z (n = 5), CAR5.28z (n = 4), or mock transduced (n = 5). (B and C) Tumor size was measured at the time points indicated using bioluminescence (B) or calipers (C). (D) At the end of the experiment (day 22 after tumor inoculation), tumors were resected and weighed. All scatterplots show data from individual mice with mean ± SEM. All graphs show mean ± SEM. All P values shown were calculated using a 2-tailed Mann-Whitney U test, except when comparing all 3 groups, where a Kruskal-Wallis test was used (as indicated).

References

    1. Rosenberg SA, et al. Durable complete responses in heavily pretreated patients with metastatic melanoma using T-cell transfer immunotherapy. Clin Cancer Res. 2011;17(13):4550–4557. doi: 10.1158/1078-0432.CCR-11-0116. - DOI - PMC - PubMed
    1. Heslop HE, et al. Long-term outcome of EBV-specific T-cell infusions to prevent or treat EBV-related lymphoproliferative disease in transplant recipients. Blood. 2010;115(5):925–935. doi: 10.1182/blood-2009-08-239186. - DOI - PMC - PubMed
    1. Neri D, Bicknell R. Tumour vascular targeting. Nat Rev Cancer. 2005;5(6):436–446. doi: 10.1038/nrc1627. - DOI - PubMed
    1. Boehm T, Folkman J, Browder T, O’Reilly MS. Antiangiogenic therapy of experimental cancer does not induce acquired drug resistance. Nature. 1997;390(6658):404–407. doi: 10.1038/37126. - DOI - PubMed
    1. Turtle CJ, Hudecek M, Jensen MC, Riddell SR. Engineered T cells for anti-cancer therapy. Curr Opin Immunol. 2012;24(5):633–639. doi: 10.1016/j.coi.2012.06.004. - DOI - PMC - PubMed

Publication types

MeSH terms