. 2020 Oct 2;5(19):e136469.
doi: 10.1172/jci.insight.136469.

Seizures elevate gliovascular unit Ca2+ and cause sustained vasoconstriction

Affiliations

Seizures elevate gliovascular unit Ca2+ and cause sustained vasoconstriction

Cam Ha T Tran et al. JCI Insight. .

Abstract

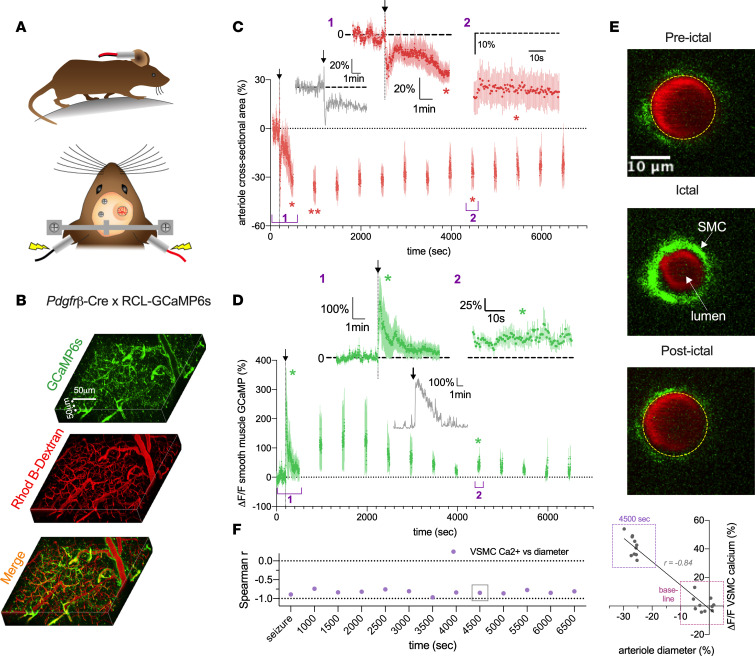
Seizures can result in a severe hypoperfusion/hypoxic attack that causes postictal memory and behavioral impairments. However, neither postictal changes to microvasculature nor Ca2+ changes in key cell types controlling blood perfusion have been visualized in vivo, leaving essential components of the underlying cellular mechanisms unclear. Here, we use 2-photon microvascular and Ca2+ imaging in awake mice to show that seizures result in a robust vasoconstriction of cortical penetrating arterioles, which temporally mirrors the prolonged postictal hypoxia. The vascular effect was dependent on cyclooxygenase 2, as pretreatment with ibuprofen prevented postictal vasoconstriction. Moreover, seizures caused a rapid elevation in astrocyte endfoot Ca2+ that was confined to the seizure period, and vascular smooth muscle cells displayed a significant increase in Ca2+ both during and following seizures, lasting up to 75 minutes. Our data show enduring postictal vasoconstriction and temporal activities of 2 cell types within the neurovascular unit that are associated with seizure-induced hypoperfusion/hypoxia. These findings support prevention of this event may be a novel and tractable treatment strategy in patients with epilepsy who experience extended postseizure impairments.

Keywords: Epilepsy; Neuroimaging; Neuroscience; Seizures.


Conflict of interest statement

Conflict of interest: The authors have declared that no conflict of interest exists.

Figures

Figure 1
Figure 1. MES seizures induce postictal hypoxia that generalizes across sex and strains.
(A) Experimental setup has mice with a chronically implanted optode and electrode in their barrel cortex. Awake freely moving mice received one 0.2-second MES per day for 3 days with concurrent local field potential and local partial pressure of oxygen (pO2) recordings. (B and C) Mean oxygen profile before, during, and after MES in male (B) and female (C) C57BL/6J mice (N = 5, each). The inset shows the duration of electrographic seizures during the 3 seizures. (D) Quantification (mean ± SEM) of the area (depth and duration) below the severe hypoxic threshold (pO2 < 10 mmHg) following the third seizure. Male and female C57BL/6J mice were not different from each other (t test, t[8] = 1.11, P = 0.30). (E and F) Mean oxygen profile before, during, and after MES in mixed sex Slc1a3 (astrocyte reporter) (E) and PdgfrB (mural cell reporter) (F) mice (N = 5, each). (G) Quantification (mean ± SEM) of the area below the severe hypoxic threshold (pO2 < 10 mmHg) following the third seizure. Slc1a3 and PdgfrB and combined male and female C57BL/6J mice were not different from each other (1-way ANOVA, F[2,17] = 0.56, P = 0.58).
Figure 2
Figure 2. Seizure-induced sustained arteriole constriction is associated with an initial transient rise in astrocytic endfoot Ca2+.
(A) Schematics of awake-mouse experimental setup. (B) Reconstruction in 3D of the superficial barrel cortex from a Slc1a3-Cre/ERT RCL-GCaMP3 mouse. Astrocytes expressing GCaMP3 are shown in green; the vasculature is loaded with Rhod B-dextran shown in red. (C) Cross section of a penetrating arteriole (p.a.) enwrapped by an endfoot (e.f.). Images show preictal (top), severe vasoconstriction and a large astrocyte Ca2+ rise triggered by MES during the ictal period (middle), and the postictal period (bottom). (D). Summary time course of arteriolar diameter in Slc1a3-Cre/ERT RCL-GCaMP3 mice (N = 5). To limit photobleaching and/or photodamage, measurements were taken for 60 seconds every 300 seconds. Arrow and vertical dotted line indicate MES (0.2 second). Inset: Temporal close-up of percent diameter changes during the ictal (t test, t[4] = 8.06, P < 0.001) and postictal (t test, t[4] = 4.04, P = 0.007) period, and representative trace of diameter response to 0.2-second MES. (E) Summary time course of endfoot Ca2+ measurements in the same experiment as diameter measures (N = 4). Vertical dotted line indicates MES (0.2 second). Inset: Temporal close-up of endfoot Ca2+ response during the ictal (t test, t[3] = 6.36, P = 0.007) and postictal (t test, t[3] = 1.63, P = 0.20) period and representative trace of endfoot Ca2+ to 0.2-second MES. (F) Summary time course of astrocyte arbor Ca2+ measurements in the same experiment as diameter measures (N = 4). Vertical dotted line indicates MES (0.2 second). Inset: Temporal close-up of astrocyte arbor Ca2+ response during the ictal (t test, t[3] = 3.43, P = 0.04) and postictal (t test, t[3] = 1.56, P = 0.2) period and representative trace of astrocyte arbor Ca2+ to 0.2-second MES. Data represent mean ± SEM. *P < 0.05, **P < 0.01, ***P < 0.001.
Figure 3
Figure 3. Prolonged postictal vasoconstriction is prevented by COX-2 antagonism.
(A) Summary time course of arteriolar diameter in the presence of ibuprofen in response to MES (N = 5). To limit photobleaching and/or photodamage, measurements were taken for 60 seconds every 300 seconds. Arrow and vertical dotted line indicate MES (0.2 second). Inset: Temporal close-up of percent diameter changes during the ictal and postictal period (5200 seconds vs. baseline: t test, t[4] = 0.92, P = 0.41). (B) Summary data comparing vehicle i.p. injection (gray) with ibuprofen (purple), at a preictal (t test, t[4] = 1.31, P = 0.25), ictal (t test, t[4] = 0.38, P = 0.72), and postictal time point (5200 seconds: t test, t[4] = 4.14, P = 0.007). Data represent mean ± SEM. **P < 0.01.
Figure 4
Figure 4. COX-2 antagonism affects the secondary component of the MES evoked endfoot Ca2+ signal.
(A) Summary time course of endfoot Ca2+ in the absence (red) or presence (purple) of ibuprofen in response to MES (N = 5). To limit photobleaching and/or photodamage, measurements were taken for 60 seconds every 300 seconds. Arrow and vertical dotted line indicate MES (0.2 second). Inset: Temporal close-up of percentage endfoot Ca2+ changes during the ictal and postictal period (5200 seconds) comparing vehicle (red) versus ibuprofen (purple). (B) Summary data comparing vehicle i.p. injection (red) with ibuprofen (purple) at a preictal (t test, t[3] = 0.99, P = 0.4), ictal peak (t test, t[3] = 1.57, P = 0.21), ictal plateau (t test, t[3] = 3.31, P = 0.04), and postictal time point (5200 seconds: [t test, t{3} = 0.77, P = 0.5]). (C) Summary data comparing the duration of the endfoot Ca2+ signal in vehicle (red) and ibuprofen (purple) during the ictal period (t test, t[3] = 3.9, P = 0.03). Data represent mean ± SEM. *P < 0.05.
Figure 5
Figure 5. Seizure-induced sustained arteriole constriction is associated with rapid and prolonged vascular smooth muscle cell Ca2+ elevation.
(A) Schematics of awake-mouse experimental setup. (B) Reconstruction in 3D of the superficial barrel cortex from a PdgfrB-Cre RCL-GCaMP6s mouse. VSMC expressing GCaMP6s are shown in green; the vasculature loaded with Rhod B-dextran is shown in red. (C) Summary time course of arteriole diameter responses (N = 5). Arrow and vertical dotted line indicate MES (0.2 second). To limit photobleaching and/or photodamage, measurements were taken for 60 seconds every 300 seconds. Inset: Temporal close-up of percent diameter changes during the ictal (t test, t[4] = 3.74, P = 0.02) and postictal (t test, t[4] = 3.58, P = 0.023) period and representative trace of diameter in response to 0.2-second MES. (D) Summary time course of VSMC Ca2+ elevations in the same experiments as diameter measures. Inset: Temporal close-up of percentage VSMC Ca2+ changes during the ictal (t test, t[4] = 2.42, P = 0.036) and postictal (t test, t[4] = 3.03, P = 0.038) period. Inset: representative trace of VSMC Ca2+ in response to 0.2-second MES. (E) Cross section of a penetrating arteriole (red) with VSMC expressing GCaMP6s (green). Images show baseline (top), the ictal period (middle), and the postictal period (bottom). (F) Left: Summary of calculated Spearman’s r values between changes in arteriole diameter and VSMC Ca2+ during the postictal period. Right: Correlation between VSMC Ca2+ and arteriole diameter during baseline (100 seconds before MES) and postictal period (4500 seconds). Each data point represents a 10-second bin and averages across all 5 animals. Data represent mean ± SEM. *P < 0.05, **P < 0.01.

Similar articles

Cited by

References

    1. Leung LS, Ma J, McLachlan RS. Behaviors induced or disrupted by complex partial seizures. Neurosci Biobehav Rev. 2000;24(7):763–775. doi: 10.1016/S0149-7634(00)00035-X. - DOI - PubMed
    1. Gallmetzer P, Leutmezer F, Serles W, Assem-Hilger E, Spatt J, Baumgartner C. Postictal paresis in focal epilepsies--incidence, duration, and causes: a video-EEG monitoring study. Neurology. 2004;62(12):2160–2164. doi: 10.1212/WNL.62.12.2160. - DOI - PubMed
    1. Todd RB. The Lumleian Lectures for 1849. On the pathology and treatment of convulsive diseases. Epilepsia. 2005;46(7):995–1009. doi: 10.1111/j.1528-1167.2005.10205.x. - DOI - PubMed
    1. Mathews MS, Smith WS, Wintermark M, Dillon WP, Binder DK. Local cortical hypoperfusion imaged with CT perfusion during postictal Todd’s paresis. Neuroradiology. 2008;50(5):397–401. doi: 10.1007/s00234-008-0362-1. - DOI - PubMed
    1. Masterson K, Vargas MI, Delavelle J. Postictal deficit mimicking stroke: role of perfusion CT. J Neuroradiol. 2009;36(1):48–51. doi: 10.1016/j.neurad.2008.08.006. - DOI - PubMed

Publication types