. 2020 Oct 1;11(9):819.
doi: 10.1038/s41419-020-03024-5.

Sulforaphane-cysteine inhibited migration and invasion via enhancing mitophagosome fusion to lysosome in human glioblastoma cells

Affiliations

Sulforaphane-cysteine inhibited migration and invasion via enhancing mitophagosome fusion to lysosome in human glioblastoma cells

Yan Zhou et al. Cell Death Dis. .

Abstract

Here we uncovered the involved subcellular mechanisms that sulforaphane-cysteine (SFN-Cys) inhibited invasion in human glioblastoma (GBM). SFN-Cys significantly upregulated 45 and downregulated 14 microtubule-, mitophagy-, and invasion-associated proteins in GBM cells via HPLC-MS/MS and GEO ontology analysis; SFN-Cys disrupted microtubule by ERK1/2 phosphorylation-mediated downregulation of α-tubulin and Stathmin-1 leading to the inhibition of cell migration and invasion; SFN-Cys downregulated invasion-associated Claudin-5 and S100A4, and decreased the interaction of α-tubulin to Claudin-5. Knockdown of Claudin-5 and S100A4 significantly reduced the migration and invasion. Besides, SFN-Cys lowered the expressions of α-tubulin-mediated mitophagy-associated proteins Bnip3 and Nix. Transmission electron microscopy showed more membrane-deficient mitochondria and accumulated mitophagosomes in GBM cells, and mitochondria fusion might be downregulated because that SFN-Cys downregulated mitochondrial fusion protein OPA1. SFN-Cys increased the colocalization and interplay of LC3 to lysosomal membrane-associated protein LAMP1, aggravating the fusion of mitophagosome to lysosome. Nevertheless, SFN-Cys inhibited the lysosomal proteolytic capacity causing LC3II/LC3I elevation but autophagy substrate SQSTM1/p62 was not changed, mitophagosome accumulation, and the inhibition of migration and invasion in GBM cells. These results will help us develop high-efficiency and low-toxicity anticancer drugs to inhibit migration and invasion in GBM.


Conflict of interest statement

The authors declare that they have no conflict of interest.

Figures

Fig. 1
Fig. 1. SFN-Cys regulated proteomic expression and inhibited cell migration and invasion in U373MG and U87MG cells.
a The SFN-Cys-regulated protein expressions in U87MG cells were identified by HPLC–MS/MS. Red, upregulation; black, downregulation. b Gene Expression Profile was performed in predicted SFN-Cys-targeted proteins in either tumor (T) or normal (N) tissue among different cancers by GEPIA. c The Protein–Protein Interaction network in SFN-Cys-targeted proteins was predicted by String server. d The Overall Survival Map of predicted SFN-Cys-targeted proteins in different cancers by GEPIA. e The Correlation Analysis among SFN-Cys-targeted TUBA1C, CLDN5, S100A4, MAP1LC3B, Bnip3, Nix, and LAMP1 in GBM by GEPIA server (p < 0.05). Migration assay without matrigel (f) or invasion assay with matrigel (g) was performed separately to detect the numbers of migratory or invasive cells in U87MG and U373MG cells after cells were treated with 0, 10, and 20 μM SFN-Cys for 24 h. h The area covered by migratory cells was recorded by Leica DMIRB microscope at ×40 magnification at 0 and 24 h. The relative closure (0 h vs. 24 h) was measured by Image J. At least three independent experiments were performed. *p < 0.05. The values are expressed as means ± SD (n ≥ 3).
Fig. 2
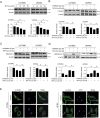
Fig. 2. SFN-Cys inhibited cell migration and invasion via sustained activation of ERK1/2 in U373MG and U87MG cells.
The expressions of p-ERK1/2 and ERK1/2 were detected by western blot with the treatment of 0, 10, 20, and 30 μM SFN-Cys for 24 h (a) or with the treatment of 20 μM SFN-Cys and/or 25 μM PD98059 for 24 h (b). The migratory ability was examined by scratch assay (c) or by migration assay (d) with the treatment of 20 μM SFN-Cys and/or 25 μM PD98059 for 24 h. e The invasion ability was detected by invasion assay with the treatment of 20 μM SFN-Cys and/or 25 μM PD98059 for 24 h. β-actin was used to be the loading control. At least three independent experiments were performed. *p < 0.05. Data were shown as means ± SD (n ≥ 3).
Fig. 3
Fig. 3. SFN-Cys changed microtubule morphology and downregulated α-tubulin via sustained activation of ERK1/2.
The expression of α-tubulin was detected by western blot with the treatment of 0, 10, 20, and 30 μM SFN-Cys for 24 h (a) or with the treatment of 20 μM SFN-Cys and/or 25 μM PD98059 for 24 h (b). The expression of Stathmin-1 (c) or pStathmin-1 (Ser 25) (d) was detected by western blot with the treatment of 20 μM SFN-Cys and/or 25 μM PD98059 for 24 h. e Cells were treated with or without 20 μM SFN-Cys and the microtubule morphology was observed by immunofluorescence and confocal microcopy. Scale bar = 50 μm. β-actin was used to be the loading control. At least three independent experiments were performed. *p < 0.05. Data were shown as means ± SD (n ≥ 3).
Fig. 4
Fig. 4. SFN-Cys inhibited migration and invasion by downregulating S100A4 and α-tubulin-mediated Claudin-5.
The expression of Claudin-5 (a) or S100A4 (b) was detected by western blot with the treatment of 0, 10, 20, and 30 μM SFN-Cys for 24 h. The expression of Claudin-5 (c) or S100A4 (d) was detected by western blot with the treatment of 20 μM SFN-Cys and/or knockdown of Claudin-5 (c) or S100A4 (d) for 24 h. Scratch assay was performed to evaluate the migration ability after knockdown of Claudin-5 (e) or S100A4 (f) with or without 20 μM SFN-Cys treatment for 24 h. Invasion assay was performed to evaluate the invasion ability after knockdown of Claudin-5 (g) or S100A4 (h) with or without the treatment of 20 μM SFN-Cys for 24 h. i Immunofluorescence staining showed the cellular colocalization of Claudin-5 to α-tubulin and the microtubule morphology with the treatment of 20 μM SFN-Cys. Red: stained α-tubulin; green: stained Claudin-5; blue: DAPI-stained DNA; scale bar = 25 μm. j Cells were treated with 20 μM SFN-Cys for 24 h. The interplay between Claudin-5 and α-tubulin was detected by co-immunoprecipitation (Co-IP). β-actin was used to be the loading control. At least three independent experiments were performed. *p < 0.05; NS no significance. Data were shown as means ± SD (n ≥ 3).
Fig. 5
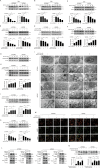
Fig. 5. SFN-Cys inhibited mitochondrial autophagy by downregulating Bnip3 and Nix and microtubule disruption.
The expression of Bnip3 in mitochondria (a) or Nix in mitochondria (b) and in cytosol (c) was detected by western blot with the treatment of 0, 10, 20, and 30 μM SFN-Cys for 24 h. The expression of Bnip3 (d) or Nix (e) was detected by western blot after knockdown of α-tubulin with/without the treatment of 20 μM SFN-Cys for 24 h. The expressions of LC3I and LC3II (f) and SQSTM1/p62 (g) were detected by western blot with the treatment of 0, 10, 20, and 30 μM SFN-Cys for 24 h. h The expressions of LC3I and LC3II were detected by western blot after knockdown of α-tubulin with/without the treatment of 20 μM SFN-Cys for 24 h. i The expressions of LC3I and LC3II were detected by western blot with the treatment of 20 μM SFN-Cys and/or 50 nM Bafilomycin A1 for 24 h. j Subcellular structures in U373MG and U87MG cells were viewed by TEM with 20 μM SFN-Cys and/or 10 μM CCCP treatment. Scale bar = 1 and 0.2 μm of magnification; “i” and “ii” in the lower panels matched the two local amplifications of the upper panel in each treated group. k The expression of OPA1 was detected by western blot with the treatment of 0, 10, 20, and 30 μM SFN-Cys for 24 h. The interaction of LC3 to LAMP1 was determined by co-IP both in cytosol and mitochondria treated with 20 μM SFN-Cys (l) or by confocal microcopy with the treatment of 20 μM SFN-Cys and/or 10 μM CCCP (m). Red: LC3, green: LAMP1, blue: nuclei. Scale bar = 75 μm. The local amplification was framed in each image. The colocalization was evaluated by Pearson’s_Rr recorded on the merged images. n The expression of LC3I and LC3II was detected by western blot with the treatment of 20 μM SFN-Cys and/or 25 μM chloroquine for 24 h. β-actin and VDAC1 were used to be the loading control of cytosolic/total and mitochondrial proteins. At least three independent experiments were performed. *p < 0.05; NS no significance. Data were shown as means ± SD (n ≥ 3).
Fig. 6
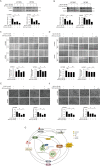
Fig. 6. SFN-Cys inhibited migration and invasion by inhibiting mitophagy.
The expression of Claudin-5 (a) or S100A4 (b) was detected by western blot with the treatment of 20 μM SFN-Cys and/or 50 nM Baf-A1 for 24 h. Scratch assay was done to evaluate the migration ability with the treatment with 20 μM SFN-Cys and/or 10 μM CCCP for 24 h (c) or with the treatment of 20 μM SFN-Cys and/or 50 nM Baf-A1 for 24 h (d). The invasion assay was done to evaluate the invasion ability with the treatment of 20 μM SFN-Cys and/or 10 μM CCCP for 24 h (e) or with the treatment of 20 μM SFN-Cys and/or 50 nM Baf-A1 for 24 h (f). g The proposed signaling map for SFN-Cys-inhibited migration and invasion in human glioblastoma. At least three independent experiments were performed. β-actin was used to be the loading control. *p < 0.05; NS no significance. Data were shown as means ± SD (n ≥ 3).

Similar articles

Cited by

References

    1. Velásquez, C. et al. Molecular and clinical insights into the invasive capacity of glioblastoma cells. J. Oncol.2019, 1740763 (2019). - PMC - PubMed
    1. Shankar S, Ganapathy S, Srivastava RK. Sulforaphane enhances the therapeutic potential of TRAIL in prostate cancer orthotopic model through regulation of apoptosis, metastasis, and angiogenesis. Clin. Cancer Res. 2008;14:6855–6866. doi: 10.1158/1078-0432.CCR-08-0903. - DOI - PubMed
    1. Geng Y, et al. Sulforaphane induced apoptosis via promotion of mitochondrial fusion and ERK1/2-mediated 26S proteasome degradation of novel pro-survival Bim and upregulation of Bax in human non-small cell lung cancer cells. J. Cancer. 2017;8:2456–2470. doi: 10.7150/jca.19383. - DOI - PMC - PubMed
    1. Li C, et al. Sulforaphane inhibits invasion via activating ERK1/2 signaling in human glioblastoma U87MG and U373MG cells. PLoS ONE. 2014;9:e90520. doi: 10.1371/journal.pone.0090520. - DOI - PMC - PubMed
    1. Peng X, et al. Sulforaphane inhibits invasion by phosphorylating ERK1/2 to regulate E-cadherin and CD44v6 in human prostate cancer DU145 cells. Oncol. Rep. 2015;34:1565–1572. doi: 10.3892/or.2015.4098. - DOI - PubMed

Publication types