. 2020 Oct 1;11(1):4917.
doi: 10.1038/s41467-020-18680-6.

Dynamics and clinical relevance of maternal mRNA clearance during the oocyte-to-embryo transition in humans

Affiliations

Dynamics and clinical relevance of maternal mRNA clearance during the oocyte-to-embryo transition in humans

Qian-Qian Sha et al. Nat Commun. .

Abstract

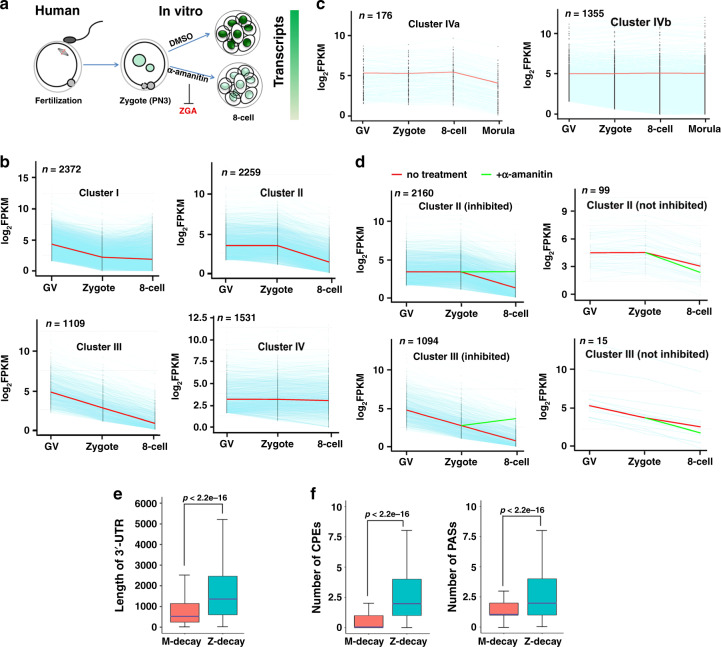
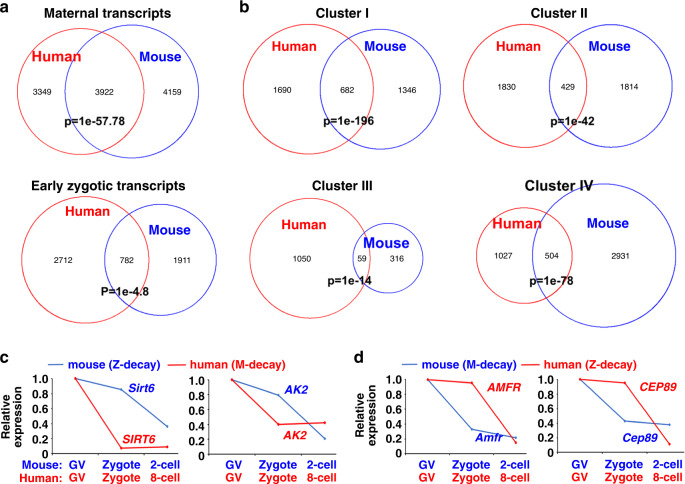
Maternal mRNA clearance is an essential process that occurs during maternal-to-zygotic transition (MZT). However, the dynamics, functional importance, and pathological relevance of maternal mRNA decay in human preimplantation embryos have not yet been analyzed. Here we report the zygotic genome activation (ZGA)-dependent and -independent maternal mRNA clearance processes during human MZT and demonstrate that subgroups of human maternal transcripts are sequentially removed by maternal (M)- and zygotic (Z)-decay pathways before and after ZGA. Key factors regulating M-decay and Z-decay pathways in mouse have similar expression pattern during human MZT, suggesting that YAP1-TEAD4 transcription activators, TUT4/7-mediated mRNA 3'-oligouridylation, and BTG4/CCR4-NOT-induced mRNA deadenylation may also be involved in the regulation of human maternal mRNA stability. Decreased expression of these factors and abnormal accumulation of maternal transcripts are observed in the development-arrested embryos of patients who seek assisted reproduction. Defects of M-decay and Z-decay are detected with high incidence in embryos that are arrested at the zygote and 8-cell stages, respectively. In addition, M-decay is not found to be affected by maternal TUBB8 mutations, although these mutations cause meiotic cell division defects and zygotic arrest, which indicates that mRNA decay is regulated independent of meiotic spindle assembly. Considering the correlations between maternal mRNA decay defects and early developmental arrest of in vitro fertilized human embryos, M-decay and Z-decay pathway activities may contribute to the developmental potential of human preimplantation embryos.


Conflict of interest statement

The authors declare no competing interests.

Figures

Fig. 1
Fig. 1. Dynamics of maternal mRNA clearance in human preimplantation embryos.
a This illustration shows the treatment of human oocytes and embryos for RNA-seq. Zygotes were treated with or without α-amanitin (25 ng/μl) and then cultured till they reached the 8-cell stage. b and c Degradation patterns of human maternal transcripts at the GV, zygote, 8-cell, and morula stages. Transcripts with FPKM > 2 at the GV stage were selected and further analyzed. Each light blue line represents the expression levels of one gene, and the middle red line represents the median expression levels of the cluster. d Degradation patterns of maternal transcripts in human embryos with or without α-amanitin treatment. Transcripts with FPKM (2-cell)/FPKM (zygote) < 0.5 were selected for analysis. Each light blue line represents the expression levels of one gene. The middle red line represents the median expression levels of the cluster. The green line represents the median expression levels of the cluster after α-amanitin treatment. e and f Average 3ʹ-UTR length e and numbers of CPEs and PASs f in the 3ʹ-UTR of the human M-decay and Z-decay transcripts. The box indicates the upper and lower quantiles, the purple thick line in the box indicates the median, and the whiskers represent the 2.5th and 97.5th percentiles. Data are presented as mean values ± SEM. P by a two-tailed Student’s t-test. n = 2372 genes for M-decay; n = 2259 genes for Z-decay.
Fig. 2
Fig. 2. Comparisons of the maternal mRNA degradation pattern between mouse and human.
a Venn diagram showing the overlap of maternal and zygotic transcripts in GV oocytes and early embryos (mouse: 2-cell; human: 8-cell) from mouse and human. b Overlap of human and mouse maternal transcripts in Clusters I–IV that are classified in Fig. 1b. c and d Relative expression levels of representative transcripts in human and mouse oocyte/embryos at the indicated stages.
Fig. 3
Fig. 3. mRNA dynamics of indicated genes during MZT in human.
a RT-qPCR results showing the mRNA levels of selected M-decay transcripts at the GV, MII, and zygote (3PN) stages. b and c RT-qPCR results showing the mRNA levels of selected Z-decay transcripts at the indicated stages. Data are presented as mean values ± SEM. P by a two-tailed Student’s t-test. n = 3 biological replicates. d and e The RNA-seq results showing the levels of transcripts encoding key factors of the M-decay d and Z-decay e pathways in human oocytes and early embryos. FPKM values were extracted from previously published data (GSE36552). f and g Immunofluorescence results showing the protein levels of BTG4, CNOT7, and YAP in human oocytes, zygotes containing three pronuclei (3PN), and 8-cell embryos. Scale bars = 40 µm. Immunostaining of each antibody was independently repeated for three times with similar results.
Fig. 4
Fig. 4. TUBB8 mutation did not affect M-decay in mouse oocytes.
a A diagram of spindle assembly disruption after microinjection of mRNAs encoding GFP-TUBB8V255M. b Confocal microscopy results showing spindle assembly of mouse oocytes at 16 h after meiotic resumption. GV oocytes were microinjected with mRNAs encoding either wild type or mutant (V255M) TUBB8 and then cultured, as shown in a. Endogenous α-tubulin was detected by immunofluorescence (red). DNA was labeled by 4’,6-diamidino-2-phenylindole (DAPI). Scale bars = 20 µm. The immunostainings were independently repeated for three times with similar results. c RT-qPCR results showing the relative levels of M-decay transcripts in mouse oocyte microinjected with mRNAs encoding wild type or mutant (V255M) TUBB8, as shown in a. Levels of these transcripts were also detected in normal zygotes as controls. n = 3 biological replicates. Data are presented as mean values ± SEM. P by two-tailed Student’s t-tests. n.s. non-significant, No PB no polar body.
Fig. 5
Fig. 5. TUBB8 mutation did not affect M-decay in human zygotes.
a A illustration of human embryo collection for RT-qPCR or RNA-seq. Oocytes that were derived from unidentified or TUBB8-mutated patients were in vitro fertilized and cultured for 3 days before RNA isolation. b Representative images showing morphologically normal and 1-cell stage-arrested embryos at 3 days after IVF. Scale bars = 40 µm. All observed normal (n = 4) and arrested embryos (n = 15) looked like this in three independently repeated observations. c RT-qPCR results showing the relative levels of M-decay transcripts in the 3PN zygotes 1 day after IVF and arrested zygotes of TUBB8-mutated patients 3 days after IVF. 1–4 represent embryos from different women. Data are presented as mean values ± SEM. n.s. non-significant by one-way ANOVA. n = 3 independent experiments.
Fig. 6
Fig. 6. Transcriptome analyses for developmental arrested human zygotes after IVF.
a The principal component analysis (PCA) results of developmental arrested zygotes 3 days after IVF. TUBB8mutant indicates zygotes of TUBB8-mutated patients; unid-patient indicates mutation-unidentified patients. b A scatter plot is shown, which compares transcripts in arrested zygotes that were derived from TUBB8-mutated and unid-patients. Transcripts decreased or increased more than 2 folds in unid-patient samples compared to TUBB8mutant samples, which are highlighted in blue and red, respectively. n gene number, FC fold change; 1–5, embryos from different unid-patients. c Heatmap of genes upregulated or downregulated more than 2 folds in zygotes from unid-patients compared to TUBB8mutant samples. The definition of Groups A and B is described in the text. d A scatter plot is shown, which compares transcripts in arrested zygotes that were derived from TUBB8-mutated and unid-patients. Transcripts decreased or increased more than 5 folds in zygotes of unid-patients compared to TUBB8mutant samples, which were highlighted in blue and red, respectively. n gene number; FC fold change; 1–5, represent embryos from different unid-patients. e Numbers of transcripts that were upregulated (red) or downregulated (blue) in arrested zygotes derived from unid-patients compared to those derived from TUBB8-mutated patients. f Venn diagram showing the overlap of upregulated transcripts in arrested zygotes of unid-patients and the degraded transcripts from the GV-to-zygote transition in normal oocytes. P = 1e−122 by a two-tailed Student’s t-test. g Heatmap showing the levels of M-decay transcripts (downregulated more than 2 folds from the GV stage to the zygote stage in normal samples (FPKM (GV) + 1/FPKM (zygote)+1) >2)) in arrested zygotes from TUBB8-mutated patients and unid-patients. h Gene ontology analysis of transcripts upregulated or downregulated more than 2 folds in arrested zygotes derived from unid-patients compared to those from TUBB8-mutated patients.
Fig. 7
Fig. 7. Levels of maternal transcripts in development-arrested human zygotes.
a and b RT-qPCR results showing the mRNA levels of selected M-decay transcripts in arrested zygotes derived from TUBB8-mutated and unid-patients 3 days after IVF. c and d RT-qPCR results showing the mRNA levels of BTG4, CNOT7, and CNOT6L in arrested zygotes that were derived from TUBB8-mutated and unid-patients. Data are presented as mean values ± SEM. P value by one-way ANOVA. n = 3 independent experiments.
Fig. 8
Fig. 8. Transcriptome changes in 8-cell stage-arrested human embryos.
a The illustration shows the collection of human embryos to perform RNA-seq. Zygotes obtained by IVF were cultured to the 8-cell or blastocyst stages. b Representative images of morphologically normal and 8-cell stage-arrested embryos. Scale bars = 50 µm. c The PCA results of embryos at the indicated stages. Arrested 8-cell embryos that were derived from unidentified patients were in vitro fertilized and cultured for 5 days before RNA isolation. 1–6, represent embryos from different unid-patients. All observed normal (n = 3) and arrested embryos (n = 14) looked like this in three independently repeated observations. d and e are derived from unid-patients (#1,4–6) to that of normal 8-cell embryos. Transcripts decreased or increased by more than 2 folds d or 5 folds e in arrested embryos compared to normal embryos, which were highlighted in blue or red, respectively. n, gene number; FC fold change. f Venn diagrams show the overlap of down-regulated transcripts in arrested embryos and ZGA transcripts in normal embryos. P = 1e−410 by a two-tailed Student’s t-test. g Venn diagrams show the overlap of up-regulated transcripts in arrested embryos, the degraded transcripts from the zygote stage to the 8-cell stage in normal embryos, and ZGA-dependent Z-decay transcripts during normal MZT. P = 1e−14 by a two-tailed Student’s t-test. h A heatmap illustration shows differentially expressed transcripts in normal and arrested embryos. Group A, transcripts that are degraded (fold change >2) during the zygote-to-8-cell transition in normal embryos, but that remained stable in the arrested 8-cell embryos. Group B, transcripts that significantly increased (fold change > 2) from the zygote stage to the 8-cell stage in normal embryos, though not in arrested 8-cell embryos. i and j Gene ontology analysis of the transcripts of Group A i and Group B j.
Fig. 9
Fig. 9. Levels of Z-decay-related transcripts in human embryos after IVF.
a and b The RT-qPCR results show the mRNA levels of key zygotic factors in normal and 8-cell stage-arrested embryos. 1–3, normal 8-cell embryos; 1–14, 8-cell stage-arrested embryos from different patients. c and d The RT-qPCR results show the mRNA levels of selected Z-decay transcripts in normal and 8-cell stage-arrested embryos. Data are presented as mean values ± SEM. P by one way ANOVA. n.s. non-significant. n = 3 independent experiments.
Fig. 10
Fig. 10. Effect of YAP inhibitor verteporfin on human early embryo development.
a Representative images of in vitro cultured human 8-cell embryos. Zygotes with 3PN were cultured with or without the presence of verteporfin and collected at the 8-cell stage. Scale bar = 50 µm. All embryos (n = 4 for each group) looked like this in three independently repeated experiments. b RT-qPCR results showing levels of TUT4 and TUT7 transcripts in the individual 8-cell embryos with or without verteporfin treatment. c One-way ANOVA test comparing TUT4/7 differences at the 8-cell stage between verteporfin-treated and none-treated embryos. d RT-qPCR results showing levels of indicated transcripts in the individual 8-cell embryos with or without verteporfin treatment. e One-way ANOVA test comparing differences of transcript levels at the 8-cell stage between verteporfin-treated and none-treated embryos. In be, n = 3 independent experiments. Data are presented as mean values ± SEM. P by one-way ANOVA.

References

    1. Sha QQ, Zhang J, Fan HY. A story of birth and death: mRNA translation and clearance at the onset of maternal-to-zygotic transition in mammalsdagger. Biol. Reprod. 2019;101:579–590. doi: 10.1093/biolre/ioz012. - DOI - PubMed
    1. Tadros W, Lipshitz HD. The maternal-to-zygotic transition: a play in two acts. Development. 2009;136:3033–3042. doi: 10.1242/dev.033183. - DOI - PubMed
    1. Walser CB, Lipshitz HD. Transcript clearance during the maternal-to-zygotic transition. Curr. Opin. Genet. Dev. 2011;21:431–443. doi: 10.1016/j.gde.2011.03.003. - DOI - PubMed
    1. Bashirullah A, et al. Joint action of two RNA degradation pathways controls the timing of maternal transcript elimination at the midblastula transition in Drosophila melanogaster. EMBO J. 1999;18:2610–2620. doi: 10.1093/emboj/18.9.2610. - DOI - PMC - PubMed
    1. Alizadeh Z, Kageyama S, Aoki F. Degradation of maternal mRNA in mouse embryos: selective degradation of specific mRNAs after fertilization. Mol. Reprod. Dev. 2005;72:281–290. doi: 10.1002/mrd.20340. - DOI - PubMed

Publication types

MeSH terms