. 2020 Oct 1;11(1):4916.
doi: 10.1038/s41467-020-18698-w.

Mechanism of self/nonself-discrimination in Brassica self-incompatibility

Affiliations

Mechanism of self/nonself-discrimination in Brassica self-incompatibility

Kohji Murase et al. Nat Commun. .

Abstract

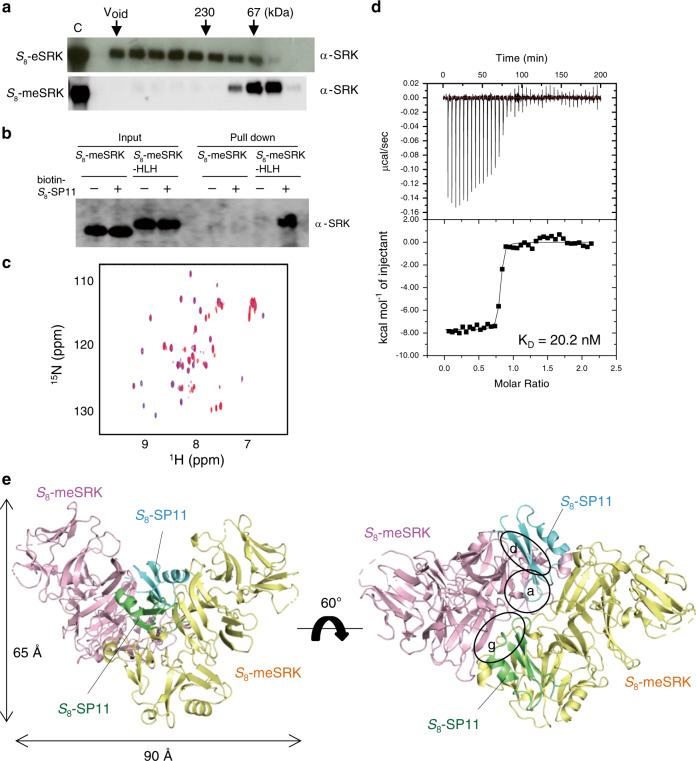
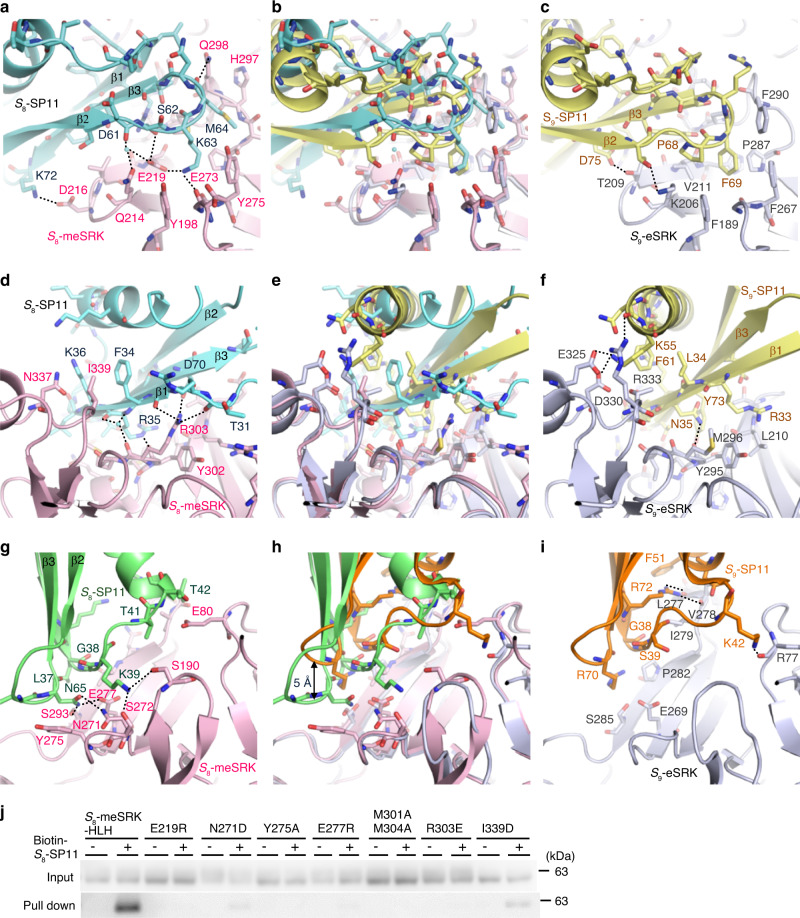
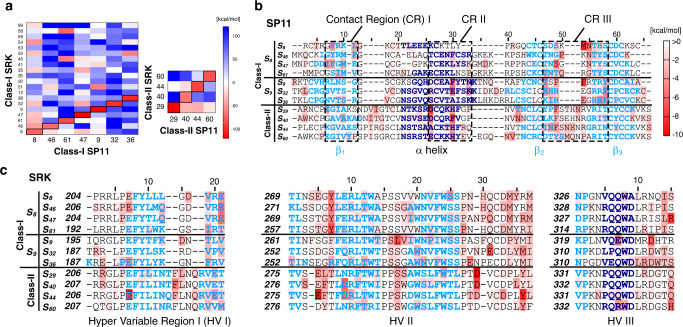
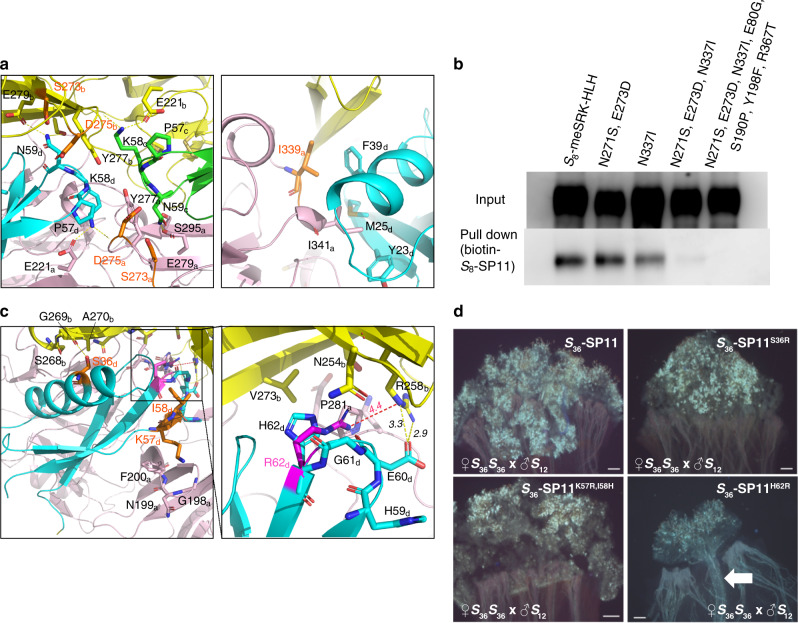
Self-incompatibility (SI) is a breeding system that promotes cross-fertilization. In Brassica, pollen rejection is induced by a haplotype-specific interaction between pistil determinant SRK (S receptor kinase) and pollen determinant SP11 (S-locus Protein 11, also named SCR) from the S-locus. Although the structure of the B. rapa S9-SRK ectodomain (eSRK) and S9-SP11 complex has been determined, it remains unclear how SRK discriminates self- and nonself-SP11. Here, we uncover the detailed mechanism of self/nonself-discrimination in Brassica SI by determining the S8-eSRK-S8-SP11 crystal structure and performing molecular dynamics (MD) simulations. Comprehensive binding analysis of eSRK and SP11 structures reveals that the binding free energies are most stable for cognate eSRK-SP11 combinations. Residue-based contribution analysis suggests that the modes of eSRK-SP11 interactions differ between intra- and inter-subgroup (a group of phylogenetically neighboring haplotypes) combinations. Our data establish a model of self/nonself-discrimination in Brassica SI.


Conflict of interest statement

The authors declare no competing interests.

Figures

Fig. 1
Fig. 1. Structure determination of S8-meSRK–S8-SP11 complex.
a Eleven amino acid mutations of S8-eSRK (S8-meSRK) suppress self-aggregation. The immunoblots show the fractions from size exclusion chromatography of S8-eSRK and S8-meSRK ectodomains expressed in insect cells. Arrows show the elution positions of molecular mass markers. C, control supernatants of insect cell culture expressing the recombinant proteins. b S8-meSRK possesses S8-SP11 recognition activity. The panel shows immunoblot analysis of pull-down eluates using biotin-S8-SP11 and insect culture media expressing S8-meSRK or S8-meSRK-HLH, which is an artificial fusion with the dimerization domain of a bHLH-ZIP protein. c Chemical shift perturbation analysis of S8-SP11. Overlay of the spectrum of 15N-labeled S8-SP11 (blue) with that of 15N-labeled S8-SP11 co-existing with unlabeled S8-meSRK (red). d ITC analysis of the S8-meSRK–S8-SP11 interaction. Upper panel, thermogram; lower panel, integrated titration curve. e Overall structure of S8-meSRK–S8-SP11 heterotetramer. Two S8-meSRK (pink and yellow) and two S8-SP11 (cyan and green) molecules are shown as cartoon models. Dotted lines indicate disordered regions. Details of the labeled circles are shown in Fig. 2a, d, g.
Fig. 2
Fig. 2. Interface between S8-meSRK and S8-SP11.
a, d Close-up views of SP11-binding site 1 on S8-meSRK (pink) with S8-SP11 (cyan). g Close-up view of SP11-binding site 2 on S8-meSRK with another molecule of S8-SP11 (green). b, e, h Comparison of SP11-binding sites of eSRK between the S8-meSRK–S8-SP11 and S9-eSRK–S9-SP11 complexes. The eSRK molecules were superimposed using Cα atoms and show the same views as in a, d, and g, respectively. S9-eSRK is shown in silver, and S9-SP11 in yellow (interacting with SP11-binding site 1) and orange (site 2). c, f, i Close-up views of S9-eSRK–S9-SP11 complex in the same orientation as in (b), (e), and (h). ai, Dotted lines represent hydrogen bonds. Water molecules are shown as small cyan spheres. j Pull-down of S8-meSRK-HLH mutants with biotin-S8-SP11 as in Fig. 1b.
Fig. 3
Fig. 3. MM–GBSA analysis using our modeled eSRK–SP11 complexes.
a Calculated ΔG values for modeled SP11s against eSRKs. Red rectangles represent tightly bound eSRK–SP11 pairs, and white to blue rectangles represent pairs with weak affinity. These values were calculated by the MM–GBSA method. b, c Sequence alignments of SP11 (b) and the hypervariable regions (HVs) of SRK (c) haplotypes with heat maps indicating energy contributions from each residue. Residues consisting of an α-helix and β-strands are shown in dark and light blue, respectively. These alignments were generated using PROMALS3D.
Fig. 4
Fig. 4. Identifying important residues for self/nonself-discrimination between similar eSRK–SP11 pairs.
a Model structure of S46-eSRK–S46-SP11 complex. Green and cyan represent two S46-SP11 molecules in the heterotetramer, and pink and yellow represent two S46-eSRK molecules. Residues mutated in the pull-down assay are shown in orange. Left and right panels show close-up views of interfaces around CR III and around CR I–II, respectively. a, c Subscripts to the right of residue numbers indicate chain ID in the complex (a, b, eSRK; c, d, SP11). b Pull-down of S8-meSRK-HLH and its derivatives with biotin-S8-SP11 was performed as in Fig. 1b. S8-meSRK-HLHN271S,E273D,N337I and S8-meSRK-HLHN271S,E273D,N337I,E80G,S190P,Y198F,R367T proteins lost the ability to bind S8-SP11. c Model structure of the S36-eSRK–S36-SP11 complex. An overview of S36-SP11 docked with S36-eSRK dimer is shown in the left panel. Cyan represents S36-SP11 molecule, and pink and yellow represent two S36-eSRK molecules. Residues mutated in the bioassay are shown in orange. A close-up view of the CR III of S36-SP11 is shown in the right panel. The H62R mutation is shown in pink. Distances are shown in angstroms. d Pollination bioassay. S36-SP11- or mutant-treated (50 pmol) S36S36 pistils were pollinated with S12 pollen grains. Pollen tubes were observed by UV fluorescence microscopy after aniline blue staining. Arrow shows pollen tubes. Scale bars, 100 μm.

Similar articles

Cited by

References

    1. Takayama S, Isogai A. Self-incompatibility in plants. Annu. Rev. Plant Biol. 2005;56:467–489. doi: 10.1146/annurev.arplant.56.032604.144249. - DOI - PubMed
    1. Bateman AJ. Self-incompatibility systems in angiosperms: III. Cruciferae. Heredity. 1955;9:53–68. doi: 10.1038/hdy.1955.2. - DOI
    1. Nou IS, Watanabe M, Isogai A, Hinata K. Comparison of S-alleles and S-glyeoproteins between two wild populations of Brassica campestris in Turkey and Japan. Sex. Plant Reprod. 1993;6:79–86. doi: 10.1007/BF00227652. - DOI
    1. Ruffio-Chable V, Gaude T. S-haplotype polymorphism in Brassica oleracea. Acta Hortic. 2001;546:257–261. doi: 10.17660/ActaHortic.2001.546.31. - DOI
    1. Takayama S, et al. Sequences of S-glycoproteins, products of the Brassica campestris self-incompatibility locus. Nature. 1987;326:102–105. doi: 10.1038/326102a0. - DOI

Publication types

MeSH terms