. 2020 Oct 1;11(1):4924.
doi: 10.1038/s41467-020-18551-0.

Frequent new particle formation over the high Arctic pack ice by enhanced iodine emissions

Affiliations

Frequent new particle formation over the high Arctic pack ice by enhanced iodine emissions

Andrea Baccarini et al. Nat Commun. .

Erratum in

Abstract

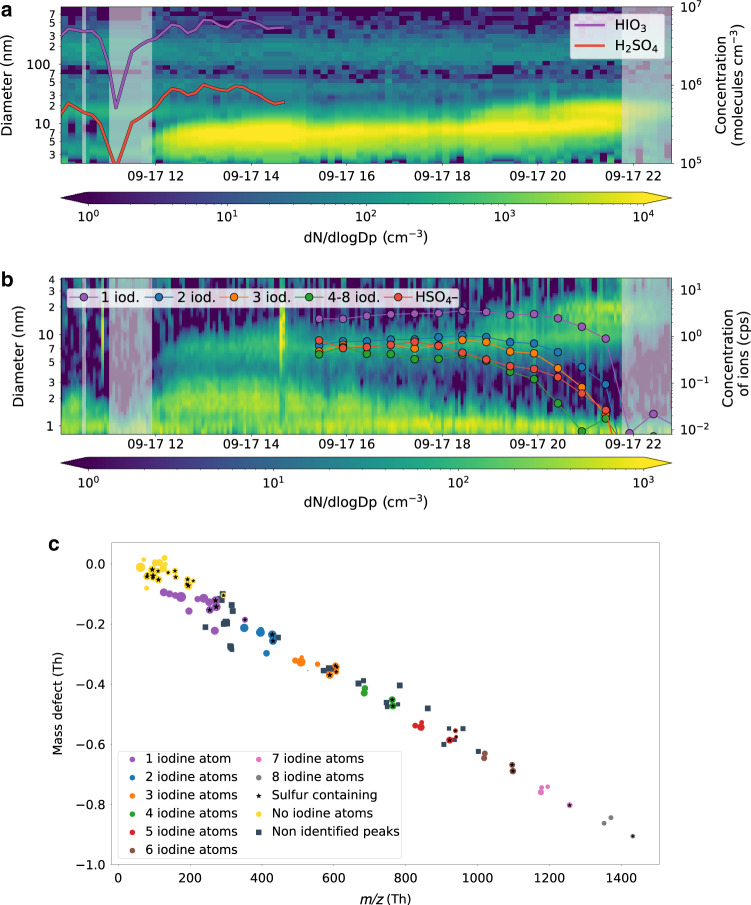
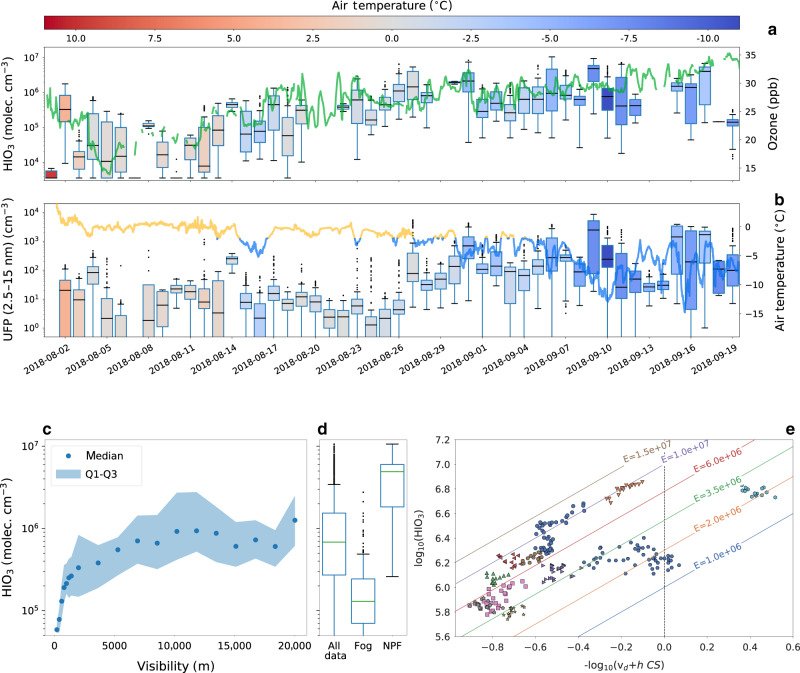
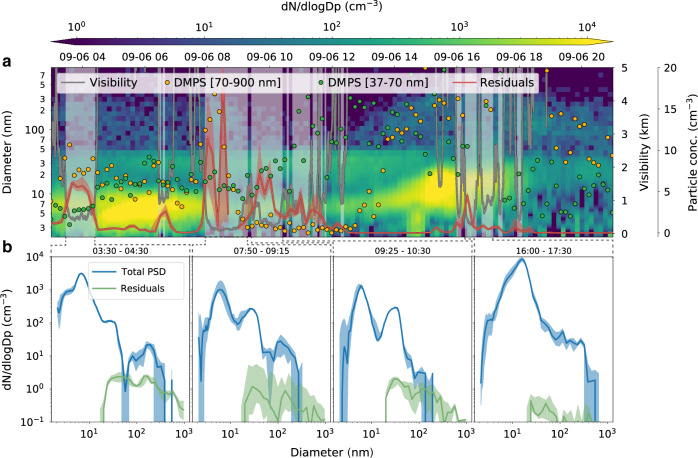
In the central Arctic Ocean the formation of clouds and their properties are sensitive to the availability of cloud condensation nuclei (CCN). The vapors responsible for new particle formation (NPF), potentially leading to CCN, have remained unidentified since the first aerosol measurements in 1991. Here, we report that all the observed NPF events from the Arctic Ocean 2018 expedition are driven by iodic acid with little contribution from sulfuric acid. Iodic acid largely explains the growth of ultrafine particles (UFP) in most events. The iodic acid concentration increases significantly from summer towards autumn, possibly linked to the ocean freeze-up and a seasonal rise in ozone. This leads to a one order of magnitude higher UFP concentration in autumn. Measurements of cloud residuals suggest that particles smaller than 30 nm in diameter can activate as CCN. Therefore, iodine NPF has the potential to influence cloud properties over the Arctic Ocean.


Conflict of interest statement

The authors declare no competing interests.

Figures

Fig. 1
Fig. 1. New particle formation mechanisms over the pack ice shown for 17 September 2018.
a Evolution of particle size distribution; also shown are the iodic and sulfuric acid monomer concentration measured with a nitrate chemical ionization mass spectrometer. b Negative-ion size distribution from neutral cluster and air ion spectrometer measurements and naturally charged sulfuric acid and iodine clusters measured with the negative atmospheric pressure interface time of flight (APi-TOF) mass spectrometer. The legend indicates the number of iodine atoms per cluster where clusters with the same number of iodine atoms were summed up. The concentration is given in counts per second (cps). Grey shaded areas indicate periods with fog (here associated to a visibility below 2 km). c Mass defect plot of the negatively charged ions measured with the APi-TOF. The size of the markers is proportional to the logarithm of the concentration. The iodine clusters reported in the mass defect plot are the same as shown in the bottom panel of Fig. 1b. Squares indicate peaks for which it has not been possible to unambiguously identify their chemical composition, however their mass defect is compatible with iodine containing species.
Fig. 2
Fig. 2. Factors controlling iodic acid concentration and NPF over the pack ice in the central Arctic Ocean.
a Daily box and whiskers plot of iodic acid, where the box extends from the first quartile (Q1) to the third quartile (Q3) with a line indicating the median. The whiskers are set to 1.5*[Q3–Q1]. The boxes are color-coded with the daily mean air temperature measured from the upper deck of the ship (roughly 25 m above sea level). The continuous green line shows the ozone concentration (axis on the right). b Daily box and whiskers plot of the ultrafine particle concentration (UFP), particles with a diameter between 2.5 and 15 nm. The continuous line shows the near-surface air temperature, with values lower than −2 °C colored in blue and above in yellow (axis on the right). c Iodic acid concentration during autumn as a function of visibility, dots indicate the median and the shaded area the interquartile range [Q3–Q1]. d Iodic acid concentration box and whiskers plot for different conditions during the autumn period. In particular, we report values for the entire autumn period, during fog (visibility below 2 km) and during NPF events. e Iodic acid data as a function of dry deposition velocity (vd), boundary layer height (h) and condensation sink (CS). Iodic acid data correspond only to clear conditions (visibility > 4 km) and periods when steady-state conditions could be assumed. Eleven steady-state periods are given by differently colored symbols. The colored lines represent different emission rates (E) based on our model.
Fig. 3
Fig. 3. Ultrafine particle growth and losses.
a Particle size distribution (PSD) measured with a neutral cluster and air ion spectrometer (NAIS) with the indication of the fitted mode diameter used for growth rate calculation. The black hatched region indicates a period influenced by pollution from the ship. b Concentrations of iodic and sulfuric acid together with visibility. Grey shaded areas indicate fog periods. c Growth rate (GR) measurements for the entire campaign as a function of the mean diameter mode during the event. The blue marker shows the measured growth rate obtained by fitting the mode diameter (the error bars represent the 95% confidence intervals from the fitted slope). The bar plot shows the estimated growth rate based on the mean mode diameter and the concentration of sulfuric and iodic acid. The black lines are the error bars due to the uncertainty of sulfuric and iodic acid concentration. The red dashed bars show the predicted growth rate when considering also the charge enhancement factor (EF) derived from Stolzenburg et al. Since for the last three events iodic and sulfuric acid measurements are not available, we report only the measured growth rates.
Fig. 4
Fig. 4. Activation of Aitken mode particles in fog.
a Particle size distribution, visibility, particle concentrations in two different size ranges (37–70 and 70–900 nm, representing the larger tail of the Aitken mode and the accumulation mode, respectively) and the total droplet residual concentration (the solid line is the 10-min median and the shaded area the interquartile range, IQR). Grey shaded areas indicate fog periods. b Median (solid line) and IQR (shaded area) particle and residual size distribution for the four different fog periods during the event. The cloud residuals distribution is based on measurements with a differential mobility particle sizer (DMPS) behind a counter flow virtual impactor inlet.

References

    1. Masson-Delmotte, et al. Global Warming of 1.5°C. An IPCC Special Report. Report of the Intergovernmental Panel on Climate Change (2018).
    1. Manabe S, Wetherald RT. The effects of doubling the CO2 concentration on the climate of a General Circulation Model. J. Atmos. Sci. 1975;32:3–15. doi: 10.1175/1520-0469(1975)032<0003:TEODTC>2.0.CO;2. - DOI
    1. Kay JE, et al. Recent advances in Arctic cloud and climate research. Curr. Clim. Chang. Rep. 2016;2:159–169. doi: 10.1007/s40641-016-0051-9. - DOI
    1. Stevens RG, et al. A model intercomparison of CCN-limited tenuous clouds in the high Arctic. Atmos. Chem. Phys. 2018;18:11041–11071. doi: 10.5194/acp-18-11041-2018. - DOI
    1. Kapsch ML, Graversen RG, Tjernström M, Bintanja R. The effect of downwelling longwave and shortwave radiation on Arctic summer sea ice. J. Clim. 2016;29:1143–1159. doi: 10.1175/JCLI-D-15-0238.1. - DOI

Publication types