

A myofibre model for the study of uterine excitation-contraction dynamics
- PMID: 33004882
- PMCID: PMC7530703
- DOI: 10.1038/s41598-020-72562-x
A myofibre model for the study of uterine excitation-contraction dynamics
Abstract
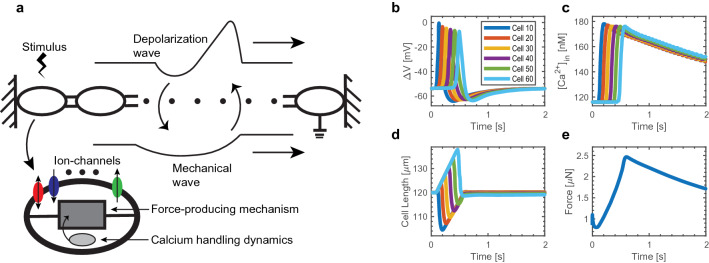
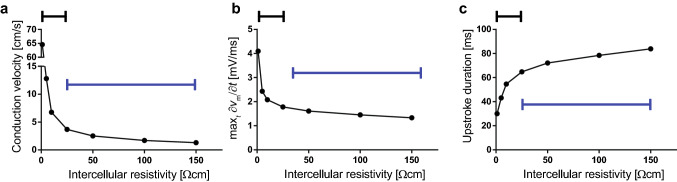
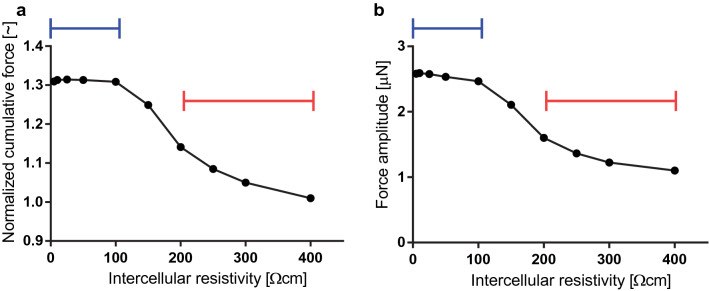
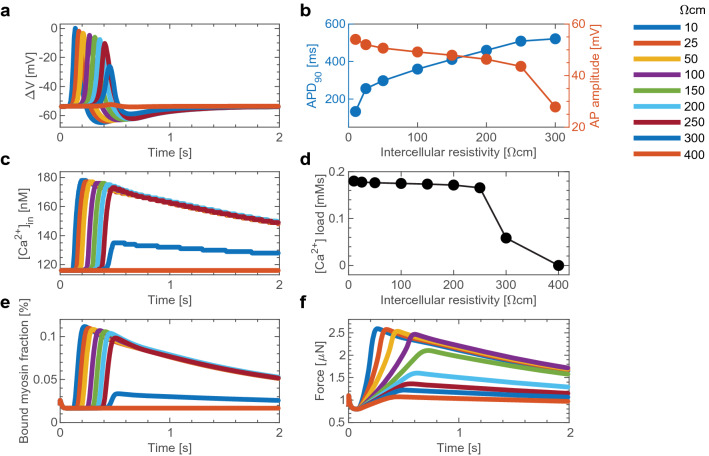
As the uterus remodels in preparation for delivery, the excitability and contractility of the uterine smooth muscle layer, the myometrium, increase drastically. But when remodelling proceeds abnormally it can contribute to preterm birth, slow progress of labour, and failure to initiate labour. Remodelling increases intercellular coupling and cellular excitability, which are the main targets of pharmaceutical treatments for uterine contraction disorders. However, the way in which electrical propagation and force development depend on intercellular coupling and cellular excitability is not fully understood. Using a computational myofibre model we study the dependency of electrical propagation and force development on intercellular coupling and cellular excitability. This model reveals that intercellular coupling determines the conduction velocity. Moreover, our model shows that intercellular coupling alone does not regulate force development. Further, cellular excitability controls whether conduction across the cells is blocked. Lastly, our model describes how cellular excitability regulates force development. Our results bridge cellular factors, targeted by drugs to regulate uterine contractions, and tissue level electromechanical properties, which are responsible for delivery. They are a step forward towards understanding uterine excitation-contraction dynamics and developing safer and more efficient pharmaceutical treatments for uterine contraction disorders.
Conflict of interest statement
The authors declare no competing interests.
Figures
Similar articles
-
Propagation of electrical activity in uterine muscle during pregnancy: a review.Acta Physiol (Oxf). 2015 Feb;213(2):406-16. doi: 10.1111/apha.12424. Epub 2014 Dec 5. Acta Physiol (Oxf). 2015. PMID: 25393600 Review.
-
Myocytes, myometrium, and uterine contractions.Ann N Y Acad Sci. 2007 Apr;1101:72-84. doi: 10.1196/annals.1389.038. Epub 2007 Apr 18. Ann N Y Acad Sci. 2007. PMID: 17442780 Review.
-
Progress in understanding electro-mechanical signalling in the myometrium.Acta Physiol (Oxf). 2015 Feb;213(2):417-31. doi: 10.1111/apha.12431. Epub 2014 Dec 23. Acta Physiol (Oxf). 2015. PMID: 25439280 Review.
-
Integration of endocrine and mechanical signals in the regulation of myometrial functions during pregnancy and labour.Eur J Obstet Gynecol Reprod Biol. 2009 May;144 Suppl 1:S2-10. doi: 10.1016/j.ejogrb.2009.02.044. Epub 2009 Mar 18. Eur J Obstet Gynecol Reprod Biol. 2009. PMID: 19299064 Review.
-
Oxytocin can regulate myometrial smooth muscle excitability by inhibiting the Na+ -activated K+ channel, Slo2.1.J Physiol. 2019 Jan;597(1):137-149. doi: 10.1113/JP276806. Epub 2018 Nov 22. J Physiol. 2019. PMID: 30334255 Free PMC article.
Cited by
-
Physiology and Pathology of Contractility of the Myometrium.In Vivo. 2021 May-Jun;35(3):1401-1408. doi: 10.21873/invivo.12392. Epub 2021 Apr 28. In Vivo. 2021. PMID: 33910817 Free PMC article. Review.
-
Modeling and experimental approaches for elucidating multi-scale uterine smooth muscle electro- and mechano-physiology: A review.Front Physiol. 2022 Oct 7;13:1017649. doi: 10.3389/fphys.2022.1017649. eCollection 2022. Front Physiol. 2022. PMID: 36277190 Free PMC article. Review.
References
-
- Osterman MJ, Martin JA. Recent declines in induction of labor by gestational age. NCHS Data Brief. 2014;155:1–7. - PubMed
-
- March of Dimes, S. t. C. W., PMNCH. Born too soon: The global action report on preterm birth. WHO (2012).
MeSH terms
LinkOut - more resources
Full Text Sources
Research Materials
