. 2020 Oct 1;10(1):16336.
doi: 10.1038/s41598-020-73269-9.

Analyzing synchronized clusters in neuron networks

Affiliations

Analyzing synchronized clusters in neuron networks

Matteo Lodi et al. Sci Rep. .

Abstract

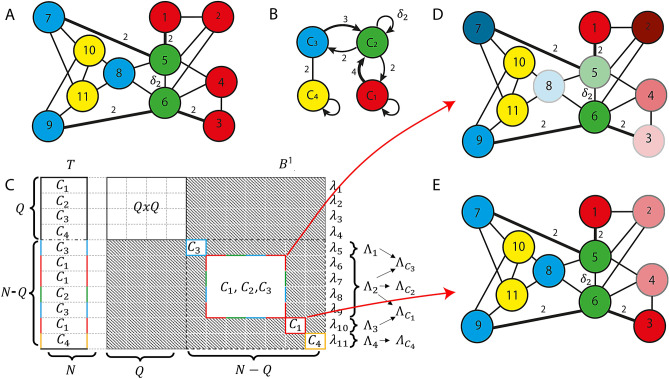
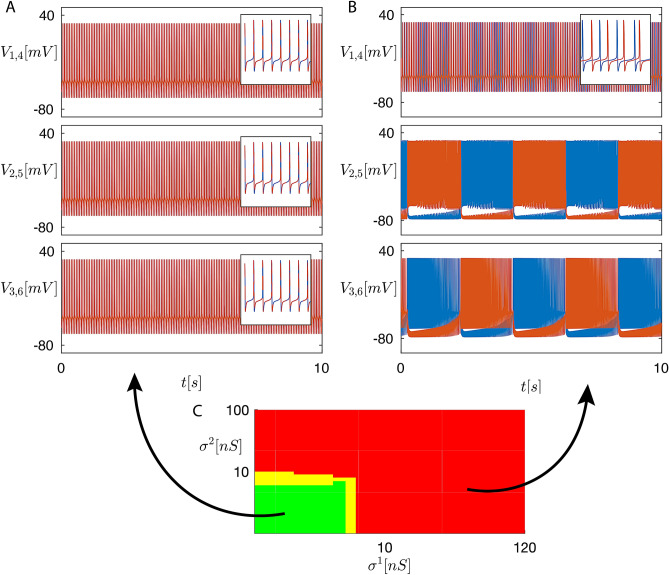
The presence of synchronized clusters in neuron networks is a hallmark of information transmission and processing. Common approaches to study cluster synchronization in networks of coupled oscillators ground on simplifying assumptions, which often neglect key biological features of neuron networks. Here we propose a general framework to study presence and stability of synchronous clusters in more realistic models of neuron networks, characterized by the presence of delays, different kinds of neurons and synapses. Application of this framework to two examples with different size and features (the directed network of the macaque cerebral cortex and the swim central pattern generator of a mollusc) provides an interpretation key to explain known functional mechanisms emerging from the combination of anatomy and neuron dynamics. The cluster synchronization analysis is carried out also by changing parameters and studying bifurcations. Despite some modeling simplifications in one of the examples, the obtained results are in good agreement with previously reported biological data.


Conflict of interest statement

The authors declare no competing interests.

Figures

Figure 1
Figure 1
Example. (A) Network with N=11 nodes, L=2 kinds of connection, undelayed (k=1) or with delay δ2 (k=2), and Q=4 clusters (C1={1,2,3,4},C2={5,6},C3={7,8,9},C4={10,11}). All connections are bi-directional and with weight 1, with the exception of the thick connections (between nodes 5-7, 1-5, 6-9, 3-6), which have weight 2. The connection between nodes 5 and 6 has the delay δ2. (B) Quotient network corresponding to (A). (C) Structure of the corresponding matrices T and B1, illustrating their relation with the clusters. Network coloring (with a larger number of clusters) after the breaking of the red cluster if its loss of stability is due to the MLEs corresponding to either (D) the multi-color sub-block or (E) the red sub-block of matrix B1.
Figure 2
Figure 2
(A) Swim CPG of the Dendronotus iris nudibranch mollusc. Lines terminating in filled circles indicate inhibitory chemical synapses (k=1). Triangles indicate fast excitatory chemical synapses (k=2). Resistor symbols indicate electrical (gap junction) connections (k=3). Neurons 1-3 are located in the left half of the mollusc brain, neurons 4-6 in the right half of the brain. (B) Structure of the matrices T, B1, B2, and B3 for the swim CPG network. The gray blocks correspond to 0 entries.
Figure 3
Figure 3
Time plots of the membrane voltages Vi(t) for the swim CPG in normal conditions (A) and in conditions emulating (by setting σ1=0 and σ2=0) a bath application of curare (B). Cluster C1 (top panel), C2 (middle panel), C3 (bottom panel). Blue lines: Vi(t) for i=1,2,3. Red lines: Vi(t) for i=4,5,6. (C) Two-parameter map of the stable clusters for the swim CPG. Green region: all clusters (C1,C2,C3) are stable (A). Red region: C1,C2,C3 lose their stability (B). Yellow region: bi-stability transition zone.
Figure 4
Figure 4
(A) Macaque cortical connectivity network: N=29 nodes, M=2 node models, L=2 synapse models. Trivial clusters are black. Nodes of the same (non-black) color belong to the same cluster: C1 (green), C2 (red), C3 (blue). (B) ECs of the macaque cortical network.
Figure 5
Figure 5
Time plots Vi(t) for different values of δ2 (5 ms (A), 15 ms (B)) for cluster C3. (C) MLE ΛCq of each cluster Cq (q=2,3) vs. coupling delay δ2, for the macaque cortical connectivity network. Horizontal dashed lines: edge of stability. Vertical dotted lines: δ2 values corresponding to the time plots in panels A and B.
Figure 6
Figure 6
Time responses (firing rates) to a pulse-shaped input to area V1.

References

    1. Bassett DS, Zurn P, Gold JI. On the nature and use of models in network neuroscience. Nat. Rev. Neurosci. 2018;20:353–364. doi: 10.1038/nn.4502. - DOI - PMC - PubMed
    1. Herz AV, Gollisch T, Machens CK, Jaeger D. Modeling single-neuron dynamics and computations: a balance of detail and abstraction. Science. 2006;314:80–85. doi: 10.1126/science.1127240. - DOI - PubMed
    1. Kreiter AK, Singer W. Stimulus-dependent synchronization of neuronal responses in the visual cortex of the awake macaque monkey. J. Neurosci. 1996;16:2381–2396. doi: 10.1523/JNEUROSCI.16-07-02381.1996. - DOI - PMC - PubMed
    1. Maldonado PE, Friedman-Hill S, Gray CM. Dynamics of striate cortical activity in the alert macaque: II. Fast time scale synchronization. Cereb. Cortex. 2000;10:1117–1131. doi: 10.1093/cercor/10.11.1117. - DOI - PubMed
    1. Glennon M, Keane MA, Elliott MA, Sauseng P. Distributed cortical phase synchronization in the EEG reveals parallel attention and working memory processes involved in the attentional blink. Cereb. Cortex. 2016;26:2035–2045. doi: 10.1093/cercor/bhv023. - DOI - PubMed

Publication types