. 2020 Oct 1;10(1):16290.
doi: 10.1038/s41598-020-73288-6.

Exploring celiac disease candidate pathways by global gene expression profiling and gene network cluster analysis

Affiliations

Exploring celiac disease candidate pathways by global gene expression profiling and gene network cluster analysis

Babajan Banaganapalli et al. Sci Rep. .

Abstract

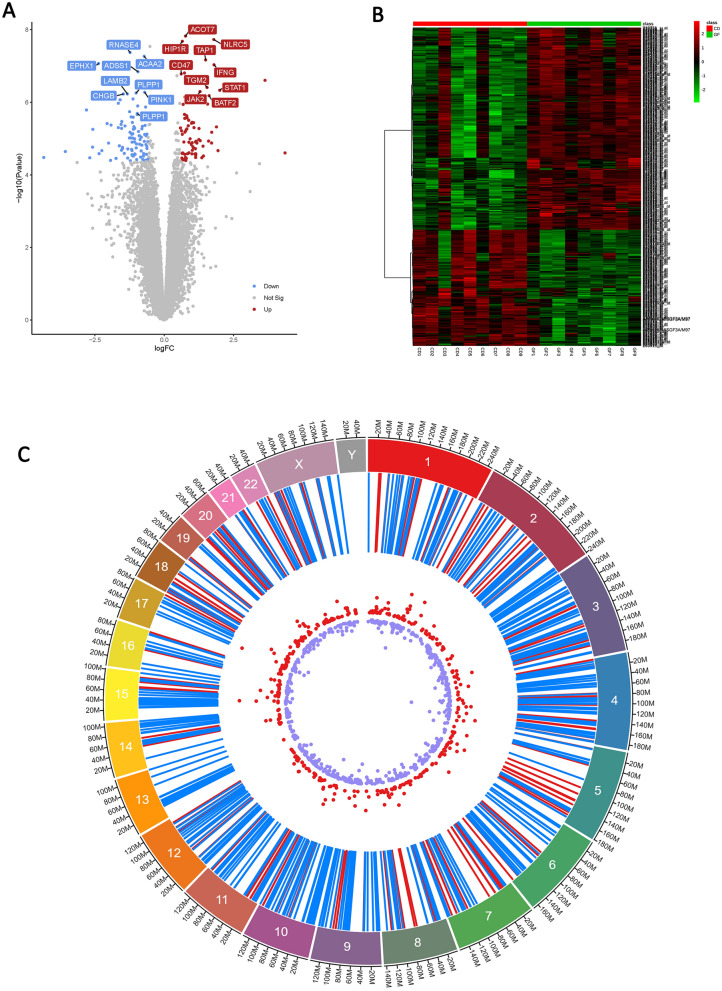
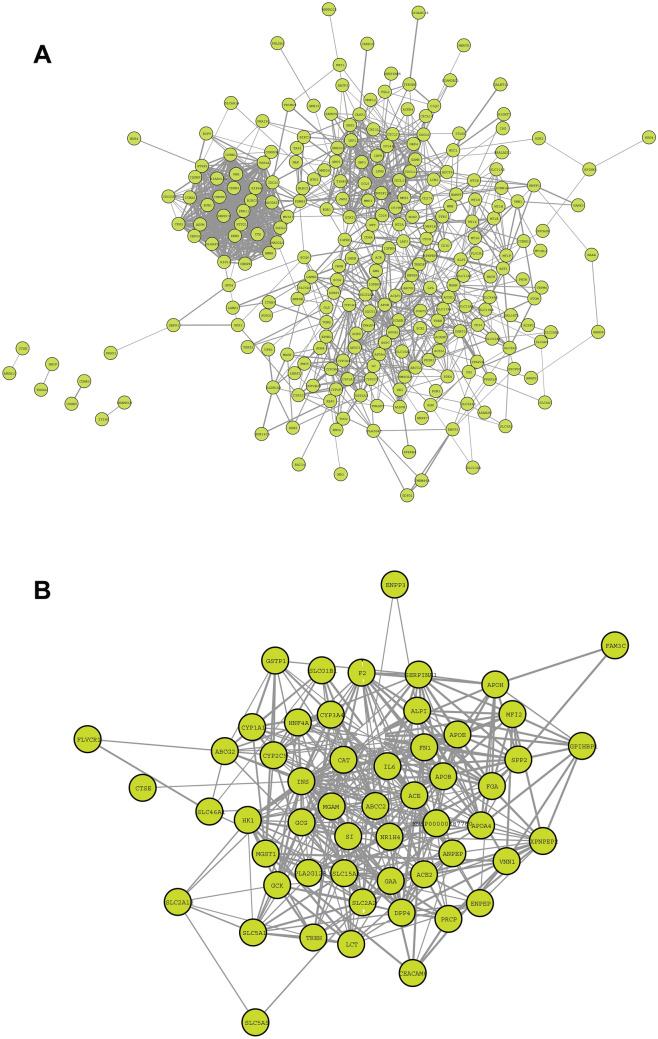
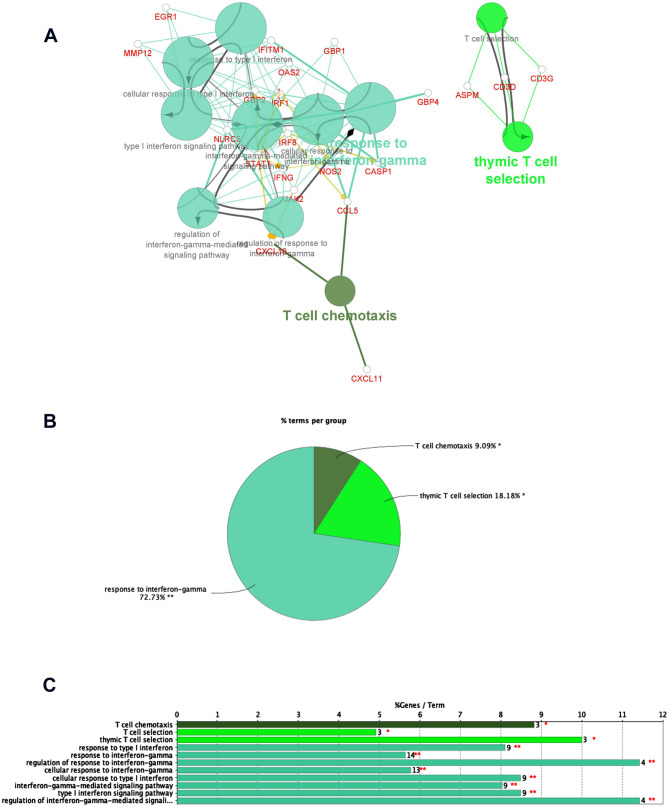
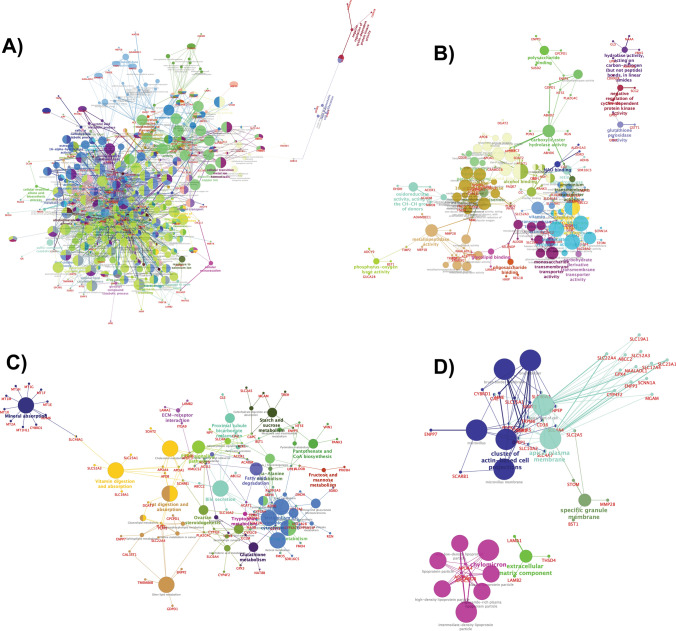
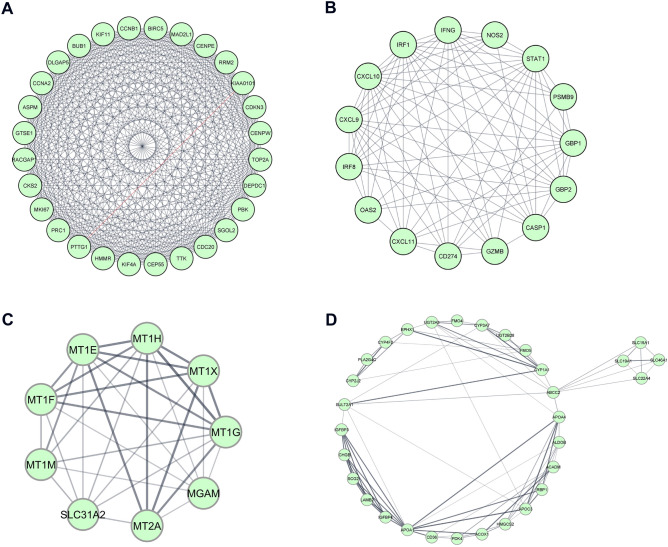
Celiac disease (CeD) is a gastrointestinal autoimmune disorder, whose specific molecular basis is not yet fully interpreted. Therefore, in this study, we compared the global gene expression profile of duodenum tissues from CeD patients, both at the time of disease diagnosis and after two years of the gluten-free diet. A series of advanced systems biology approaches like differential gene expression, protein-protein interactions, gene network-cluster analysis were deployed to annotate the candidate pathways relevant to CeD pathogenesis. The duodenum tissues from CeD patients revealed the differential expression of 106 up- and 193 down-regulated genes. The pathway enrichment of differentially expressed genes (DEGs) highlights the involvement of biological pathways related to loss of cell division regulation (cell cycle, p53 signalling pathway), immune system processes (NOD-like receptor signalling pathway, Th1, and Th2 cell differentiation, IL-17 signalling pathway) and impaired metabolism and absorption (mineral and vitamin absorptions and drug metabolism) in celiac disease. The molecular dysfunctions of these 3 biological events tend to increase the number of intraepithelial lymphocytes (IELs) and villous atrophy of the duodenal mucosa promoting the development of CeD. For the first time, this study highlights the involvement of aberrant cell division, immune system, absorption, and metabolism pathways in CeD pathophysiology and presents potential novel therapeutic opportunities.


Conflict of interest statement

The authors declare no competing interests.

Figures

Figure 1
Figure 1
The differentially expressed genes (DEGs) analysis of duodenum tissue at the time of CeD diagnosis in comparison to gluten restricted dietary managament. (A) Volcano plots of Log fold change of gene expression. (B) Heatmap of the DEGs with a LogFC > 1.5. Red: up-regulation; green: down-regulation. (C) Circos view of localization of DEGs on chromosomes (first track-chromosome number, second track- DEGs, Third track Up (Red) and Down (Blue) genes) (Circos figure generated using: https://marianattestad.com/chordial).
Figure 2
Figure 2
Overview of PPI network constructed using Cytoscape STRING database. (A) upregulated (B) down regulated PPI network, the density of the network nodes is based on string confidence score > 0.7 (Network Figures generated using https://cytoscape.org/).
Figure 3
Figure 3
Enriched Immune system groups using the ClueGo and CluePedia plugins of Cytoscape. (A) GO/immune pathwy terms specific for upregulated genes. (B) An overview pie chart with functional groups, including specific terms for the upregulated proteins in the immune pathways. (C) The bars represent the number of genes associated with the immune pathway (AD Figures generated using https://cytoscape.org/).
Figure 4
Figure 4
ClueGO analysis of the predicted Go Annotations. Functionally grouped network of enriched categories was generated for the target genes. GO terms are represented as nodes, and the node size represents the term enrichment significance. (A) Representative Biological Process (B) Molecular Function (C) KEGG Pathways (D) Cellular components interactions among predicted targets. (AD Figures generated using https://cytoscape.org/).
Figure 5
Figure 5
The MCODE clusters and hub genes identified from DEGs in duodenum tissue of celiac patients. Upregulated (A) Cluster-1. (B) Cluster-2, and Downregulated (C) Cluster-1. (D) Cluster-2 classified based on MCC score > 5. (A-D Figures generated using https://cytoscape.org/).

Similar articles

Cited by

References

    1. Al-Bawardy B, et al. Celiac disease: a clinical review. Abdom. Radiol. (NY) 2017;42:351–360. doi: 10.1007/s00261-016-1034-y. - DOI - PubMed
    1. Choung RS, et al. Prevalence and morbidity of undiagnosed celiac disease from a community-based study. Gastroenterology. 2017;152:830–839.e835. doi: 10.1053/j.gastro.2016.11.043. - DOI - PMC - PubMed
    1. Lebwohl B, Sanders DS, Green PHR. Coeliac disease. Lancet (London, England) 2018;391:70–81. doi: 10.1016/s0140-6736(17)31796-8. - DOI - PubMed
    1. Mahadev S, et al. Factors associated with villus atrophy in symptomatic coeliac disease patients on a gluten-free diet. Aliment. Pharmacol. Ther. 2017;45:1084–1093. doi: 10.1111/apt.13988. - DOI - PubMed
    1. Lebwohl B, Murray JA, Rubio-Tapia A, Green PH, Ludvigsson JF. Predictors of persistent villous atrophy in coeliac disease: a population-based study. Aliment. Pharmacol. Ther. 2014;39:488–495. doi: 10.1111/apt.12621. - DOI - PMC - PubMed

Publication types

MeSH terms