. 2020 Oct 1;10(1):16326.
doi: 10.1038/s41598-020-73353-0.

Progressive optic atrophy in a retinal ganglion cell-specific mouse model of complex I deficiency

Affiliations

Progressive optic atrophy in a retinal ganglion cell-specific mouse model of complex I deficiency

Luyu Wang et al. Sci Rep. .

Abstract

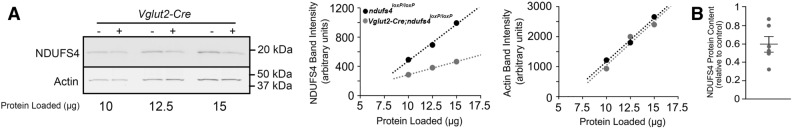
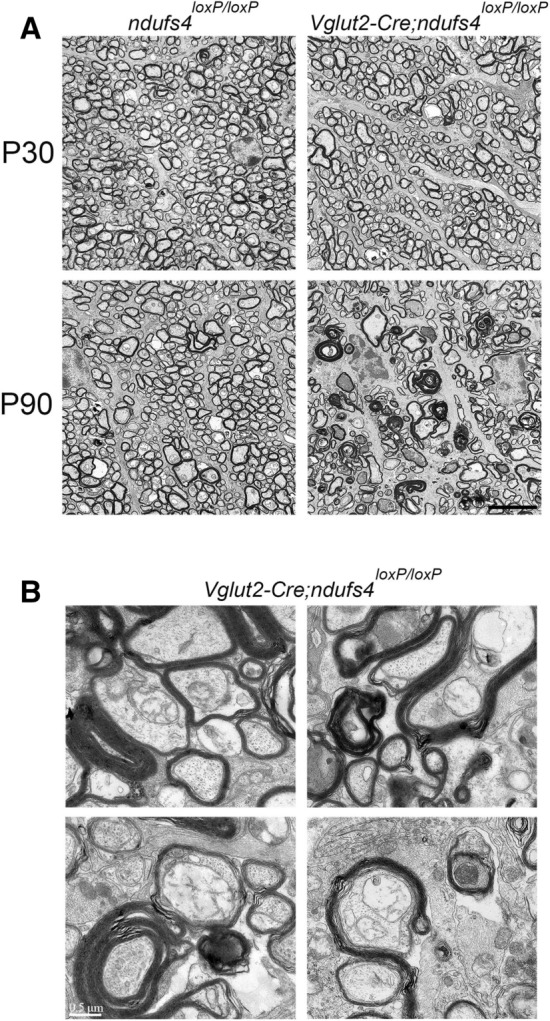
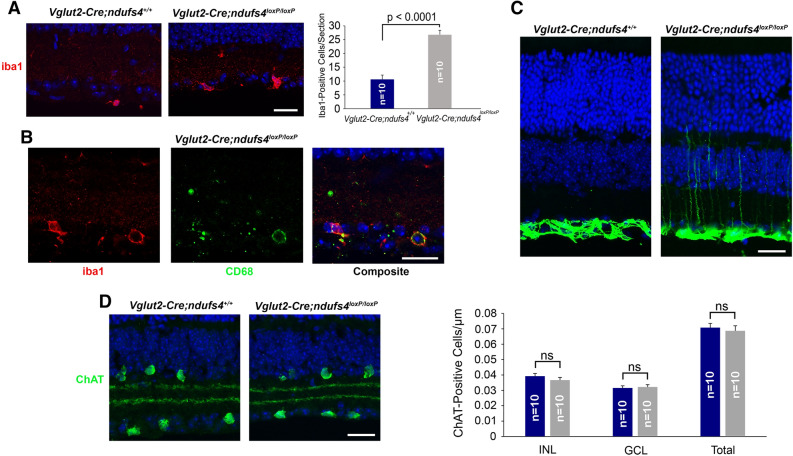
Optic atrophy resulting from retinal ganglion cell (RGC) degeneration is a prominent ocular manifestation of mitochondrial dysfunction. Although transgenic mice lacking the mitochondrial complex I accessory subunit NDUFS4 develop early-onset optic atrophy, severe systemic mitochondrial dysfunction leads to very early death and makes this mouse line impractical for studying the pathobiology of mitochondrial optic neuropathies. Theoretically, RGC-specific inactivation of ndufs4 would allow characterization of RGC degeneration over a longer time course, provided that RGC death from mitochondrial dysfunction is a cell-autonomous process. We demonstrate that the vesicular glutamate transporter VGLUT2 may be exploited to drive robust Cre recombinase expression in RGCs without any expression observed in directly neighboring retinal cell types. Deletion of ndufs4 in RGCs resulted in reduced expression of NDUFS4 protein within the optic nerves of Vglut2-Cre;ndufs4loxP/loxP mice. RGC degeneration in Vglut2-Cre;ndufs4loxP/loxP retinas commenced around postnatal day 45 (P45) and progressed to loss of two-thirds of RGCs by P90, confirming that intrinsic complex I dysfunction is sufficient to induce RGC death. The rapidly-developing optic atrophy makes the Vglut2-Cre;ndufs4loxP/loxP mouse line a promising preclinical model for testing therapies for currently untreatable mitochondrial optic neuropathies such as Leber Hereditary Optic Neuropathy.


Conflict of interest statement

The authors declare no competing interests.

Figures

Figure 1
Figure 1
Vglut2-driven Cre expression is present in the vast majority of RGCs and a minority of non-RGC retinal neurons. (A) Immunolabeling of RGCs with RNA-Binding Protein 1 (RBPMS1) in Vglut2-Cre;Ai9 retinal flat mounts. Approximately 96% of RBPMS1-positive cells (green) show co-expression of tdTomato (red). (B) Two representative images of tdTomato reporter expression in Vglut2-Cre;Ai9 retinal cross-sections, demonstrating tdTomato expression in cells in the GCL (and their dendritic projections in the IPL), cells in the OPL, and rare photoreceptors with nuclei at the top of the ONL. The right panel shows an example of a solitary tdTomato-positive cell at the base of the INL. (C) Co-localization of tdTomato and RBPMS1 identifies the Cre-expressing cell in the INL as a displaced RGC. (D,E) Co-localization of tdTomato with cone arrestin (D) and calbindin (E) confirms the identities of tdTomato-positive cells in the ONL and OPL as cones and horizontal cells, respectively. (F,G) tdTomato is not expressed in rod bipolar cells labeled with PKC-α (F) or in starburst amacrine cells labeled with ChAT (G). IS inner segment, ONL outer nuclear layer, OPL outer plexiform layer, INL inner nuclear layer, IPL inner plexiform layer, GCL ganglion cell layer. All scale bars, 20 μm.
Figure 2
Figure 2
Retinal ganglion cell soma density declines rapidly after P30 in Vglut2-Cre;ndufs4loxP/loxP retinas. (A) Retinal flat mounts from ndufs4loxP/loxP, Vglut2-Cre;ndufs4+/+, and Vglut2-Cre;ndufs4loxP/loxP mice were immunolabeled with RBPMS1 at P30, P60, and P90. (B) Bar graphs comparing RGC density between the indicated genotypes at distances of 0.5, 1.0, and 1.5 mm from the optic nerve head. (C) Retinal cross section from a P60 Vglut2-Cre;ndufs4loxP/loxP mouse stained with DAPI and labeled for cleaved caspase 3. A cell with a pyknotic nucleus (arrowhead, left panel) exhibited positive cleaved caspase 3 signal (green, right panel). (D) Retinal flat mounts from P45 Vglut2-Cre;ndufs4+/+, Vglut2-Cre;ndufs4loxP/loxP and germline ndufs4−/− mice labeled for RBMPS1. (E) Bar graphs comparing RGC density between Vglut2-Cre;ndufs4+/+, Vglut2-Cre;ndufs4loxP/loxP and germline ndufs4−/− retinal flat mounts at P30 and P45. The bars for Vglut2-Cre;ndufs4+/+ and Vglut2-Cre;ndufs4loxP/loxP at P30 are reproduced from panel B. All scale bars, 20 µm. Quantitative data depicted as mean ± SEM. (*p < 0.05; **p < 0.01; ***p < 0.0001; ns, not significant; n = number of retinas analyzed).
Figure 3
Figure 3
Assessment of NDUFS4 protein expression in mouse optic nerves. (A) Representative Western blot comparing the expression of NDUFS4 and actin in optic nerve lysates from ndufs4loxP/loxP and Vglut2-Cre; ndufs4loxP/loxP mice at P30. Total protein content of lysate loaded into each lane is indicated below, and the presence or absence of the Vglut2-Cre transgene is indicated above each lane. The graphs to the right depict NDUFS4 and actin band intensities plotted as a function of total protein loaded, demonstrating that the intensities are within a linear range for both proteins. (B) Quantification of NDUFS4 protein content in Vglut2-Cre;ndufs4loxP/loxP optic nerve lysates relative to ndufs4loxP/loxP littermates. NDUFS4 band intensity was normalized to actin band intensity for each sample, with 12.5 µg of total protein loaded per sample. n = 6 mice per genotype. Data are presented as mean ± SEM. See Supplementary Fig. S2 online for the uncropped blot from panel A.
Figure 4
Figure 4
Optic nerve axon density declines in Vglut2-Cre;ndufs4loxP/loxP mice by P60. (A) Representative light microscopy images of ndufs4loxP/loxP, Vglut2-Cre;ndufs4+/+, and Vglut2-Cre;ndufs4loxP/loxP optic nerve cross-sections stained with methylene blue at P30 and P90. Scale bar, 20 μm. (B) Bar graphs comparing axon density between the indicated genotypes at the proximal portion of the optic nerve. Bars depict mean ± SEM; n = number of optic nerves per genotype; ** p < 0.001; ***, p < 0.0001; ns, not significant. Image acquisition and axon quantification performed with AxioVision SE64 Rel. 4.9.1 software.
Figure 5
Figure 5
Electron microscopy of proximal optic nerve cross-sections. (A) Representative electron micrographs of ndufs4loxP/loxP and Vglut2-Cre;ndufs4loxP/loxP optic nerve cross-sections at P30 and P90, demonstrating axon loss and abnormal myelin figures at the latter time point in the Vglut2-Cre;ndufs4loxP/loxP optic nerve. Magnification 5000×; scale bar, 5 μm. (B) Abnormal myelination patterns observed in P90 Vglut2-Cre; ndufs4loxP/loxP optic nerve cross-sections, such as thickened myelin sheaths (upper left panel), redundant myelination (upper right, lower left) and incomplete axon enclosure (lower left and right). Magnification 40,000×; scale bar, 0.5 μm.
Figure 6
Figure 6
Flash electroretinography recordings in Vglut2-Cre;ndufs4loxP/loxP mice. (A) Representative traces from ERG recordings of dark-adapted P45 Vglut2-Cre;ndufs4+/+ (black) and Vglut2-Cre;ndufs4loxP/loxP mice (red) with stimulus intensities ranging from 0.0001 to 500 cd*s/m2. (B) Representative photopic light responses from the same mice, recorded at stimulus intensities of 1, 10, and 100 cd*s/m2 (from top to bottom) under rod-saturating background illumination of 30 cd/m2. (C) ERG responses of the Vglut2-Cre;ndufs4+/+ (black) and Vglut2-Cre;ndufs4loxP/loxP mice (red) are plotted as a function of flash intensity and fit using a double or single hyperbolic function. Depicted from left to right are scotopic a-wave amplitude; scotopic b-wave amplitude; oscillatory potential total power; and photopic b-wave amplitude. Ten eyes of 5 Vglut2-Cre;ndufs4+/+ (black) and 12 eyes of 6 Vglut2-Cre;ndufs4loxP/loxP mice were analyzed. Data are presented as mean ± SEM. Two-tailed t-tests comparing responses for each genotype did not reach a significance level of p = 0.05 for any flash intensity, except for oscillatory potentials obtained at the seven highest flash intensities; *, p < 0.05; **, p < 0.01.
Figure 7
Figure 7
Neuroinflammation in Vglut2-Cre;ndufs4loxP/loxP retinas. (A) Iba1 immunolabeling of mononuclear cells in cross sections of P60 Vglut2-Cre;ndufs4+/+ and Vglut2-Cre;ndufs4loxP/loxP retinas. Bar graph to the right depicts mean number of iba1-positive nuclei per retinal section. (B) Representative image of Vglut2-Cre;ndufs4loxP/loxP retina with activated myeloid cells co-labeled for iba1 and CD68. (C) GFAP immunolabeling of Vglut2-Cre;ndufs4+/+ and Vglut2-Cre;ndufs4loxP/loxP retinal cross sections. (D) Immunolabeling of starburst amacrine cells with ChAT. Bar graph to the right compares the mean number of ChAT-positive cells in the INL, GCL, and combined for Vglut2-Cre;ndufs4+/+ (blue) and Vglut2-Cre;ndufs4loxP/loxP retinas (gray). For both bar graphs, n = number of retinas analyzed, with 3 sections averaged per retina. Data are presented as mean ± SEM. ns not significant, INL inner nuclear layer, GCL ganglion cell layer. All scale bars, 20 μm.

References

    1. Fisher CR, Ferrington DA. Perspective on amd pathobiology: A bioenergetic crisis in the RPE. Invest. Ophthalmol. Vis. Sci. 2018;59:41–47. doi: 10.1167/iovs.18-24289. - DOI - PMC - PubMed
    1. Eells JT. Mitochondrial dysfunction in the aging retina. Biology. 2019;8:31. doi: 10.3390/biology8020031. - DOI - PMC - PubMed
    1. Kamel K, Farrell M, O'Brien C. Mitochondrial dysfunction in ocular disease: Focus on glaucoma. Mitochondrion. 2017;35:44–53. doi: 10.1016/j.mito.2017.05.004. - DOI - PubMed
    1. Yu-Wai-Man P, Newman NJ. Inherited eye-related disorders due to mitochondrial dysfunction. Hum. Mol. Genet. 2017;26:R12–R20. doi: 10.1093/hmg/ddx182. - DOI - PMC - PubMed
    1. Wallace DC, Lott MT. Leber hereditary optic neuropathy: Exemplar of an mtDNA disease. Handb. Exp. Pharmacol. 2017;240:339–376. doi: 10.1007/164_2017_2. - DOI - PubMed

Publication types

Substances

Supplementary concepts