Comparative Study
. 2020 Oct 1;10(1):16274.
doi: 10.1038/s41598-020-73516-z.

Detection rate of diabetic macular microaneurysms comparing dye-based angiography and optical coherence tomography angiography

Affiliations
Comparative Study

Detection rate of diabetic macular microaneurysms comparing dye-based angiography and optical coherence tomography angiography

Martin Stattin et al. Sci Rep. .

Abstract

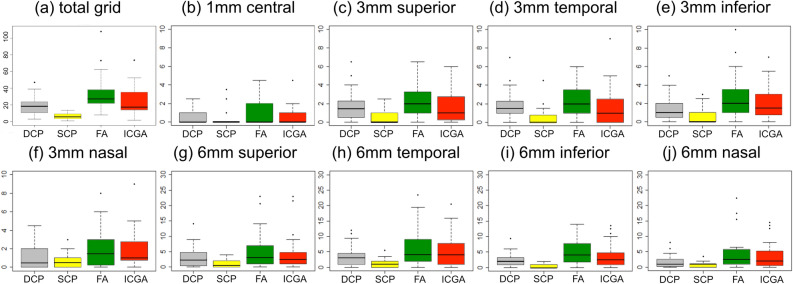
Diabetic maculopathy (DM) is a microvascular dysfunction clinically characterized by microaneurysms (MA) leading to edema and central visual deprivation. This prospective explorative study investigated 27 eyes of 17 patients with DM by fluorescein/indocyanine green angiography (FA/ICGA; SPECTRALIS HRA-OCT, Heidelberg Engineering) and by swept source-optical coherence tomography angiography (SS-OCTA; DRI-OCT Triton Plus, Topcon) to identify clinically relevant MAs. The SS-OCTA cubes were split into the superficial capillary plexus (SCP) and the deep capillary plexus (DCP) according to the automated segmentation. The images of all modalities were superimposed for alignment by an Early Treatment Diabetic Retinopathy Study grid overlay and compared to each other. In total, the mean number of MAs in FA was 33.4 ± 22 (standard deviation) (median 27.5 [q1:21.75;q3:38.25]), in ICGA 24.9 ± 16.9 (17.5 [14;35]), in the SCP 6.5 ± 3.7 (5.5 [3.75;9.25]) and in the DCP 18.1 ± 10.5 (18.5 [10.75;23.5]). Mixed effects models between ICGA and the DCP were borderline significant (p = 0.048; 95% confidence interval 0.21 to 13.49), whereas all other imaging methods differed significantly. Quantitative analysis of MAs in DM showed a plausible agreement between ICGA and the DCP in SS-OCTA. These findings contribute to the imaging methodology in DM.


Conflict of interest statement

The authors declare no competing interests.

Figures

Figure 1
Figure 1
Right eye of a 55-years old woman with mild non-proliferative diabetic retinopathy and diabetic maculopathy. (a) Early fluorescein angiography (FA) counting 24 microaneurysms (MA) of different intensity in the total Early Treatment Diabetes Retinopathy Study (ETDRS) grid (b) Early indocyanine green angiography presenting 14 macular MAs with similar localization as in FA (c) A 6 × 6 mm swept source-optical coherence tomography angiography (SS-OCTA) illustration of the deep capillary plexus (DCP) with 9 definite MAs in the total ETDRS grid (d) Five MAs visible in the superficial capillary plexus of the same SS-OCTA cube with 1 MA in the upper left corner of the 6 mm superior sector also visible in the DCP.
Figure 2
Figure 2
Numbers and location of diabetic macular microaneurysms (MA). For each color box-and-whisker plot, the horizontal bar within the box represents median; top and bottom of box, interquartile range. Upper whisker extends from the upper quartile to the closest observed data point below the upper quartile plus 1.5 times the interquartile range; lower whisker extends from the lower quartile to the closest observed data point above the lower quartile minus 1.5 times the interquartile range. Outlying values are plotted as dots. (a) The total Early Treatment Diabetes Retinopathy Study grid and for (b–j) every sector independently. The deep capillary plexus (DCP = grey) of the swept source-optical coherence tomography angiography (SS-OCTA) and indocyanine green angiography (ICGA = red) showed similar medians in the total as well as in most sectors. The superficial capillary plexus (SCP = yellow) of SS-OCTA counted least MAs, while fluorescein angiography (FA = green) demonstrated the highest numbers overall independent of the sector.
Figure 3
Figure 3
Color map of significance levels (p < 0.05 = yellow, p ≥ 0.05 = green) in the total Early Treatment Diabetes Retinopathy Study grid and for each sector comparing (a) fluorescein angiography (FA) to indocyanine green angiography (ICGA), (b) FA to the deep capillary plexus (DCP), (c) FA to the superficial capillary plexus (SCP) (d) the SCP to ICGA, (e) ICGA to the DCP and (f) the SCP to the DCP. All eyes were displayed as right eyes representative for both lateralities (86% right and 14% left eyes).

References

    1. Antonetti DA, Klein R, Gardner TA. Diabetic retinopathy. N. Engl. J. Med. 2012;366:1227–1239. doi: 10.1056/NEJMra1005073. - DOI - PubMed
    1. Cheung N, Mitchell P, Wong TY. Diabetic retinopathy. Lancet. 2010;376:124–136. doi: 10.1016/S0140-6736(09)62124-3. - DOI - PubMed
    1. Congdon NG, Friedman DS, Lietman T. Important causes of visual impairment in the world today. JAMA. 2003;290:2057–2060. doi: 10.1001/jama.290.15.2057. - DOI - PubMed
    1. Ferris FL, Patz A. Macular edema. A complication of diabetic retinopathy. Surv. Ophthalmol. 1984;28(Suppl):452–461. doi: 10.1016/0039-6257(84)90227-3. - DOI - PubMed
    1. Early Treatment Diabetic Retinopathy Study research group Photocoagulation for diabetic macular edema. Early treatment diabetic retinopathy study report number 1. Arch. Ophthalmol. 1985;103:1796–1806. doi: 10.1001/archopht.1985.01050120030015. - DOI - PubMed

Publication types