. 2020 Oct 1;3(1):545.
doi: 10.1038/s42003-020-01264-x.

FUBP1 and FUBP2 enforce distinct epigenetic setpoints for MYC expression in primary single murine cells

Affiliations

FUBP1 and FUBP2 enforce distinct epigenetic setpoints for MYC expression in primary single murine cells

Ying Zheng et al. Commun Biol. .

Abstract

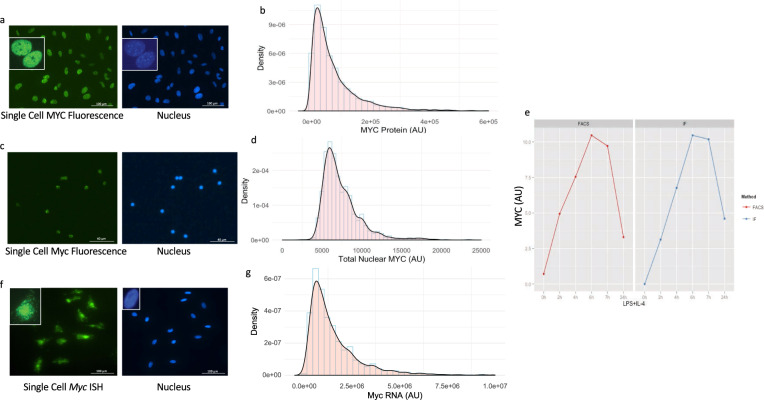
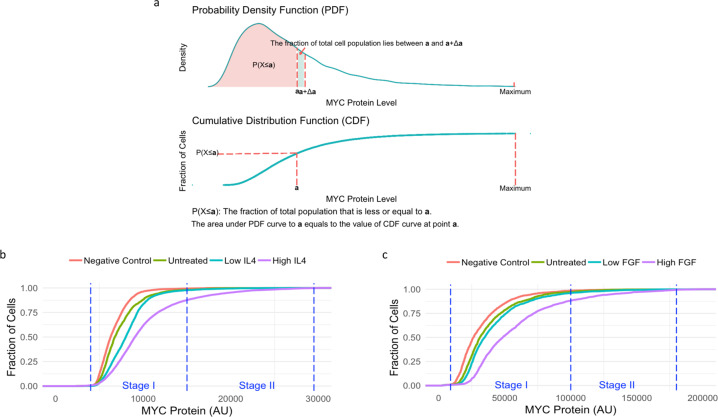
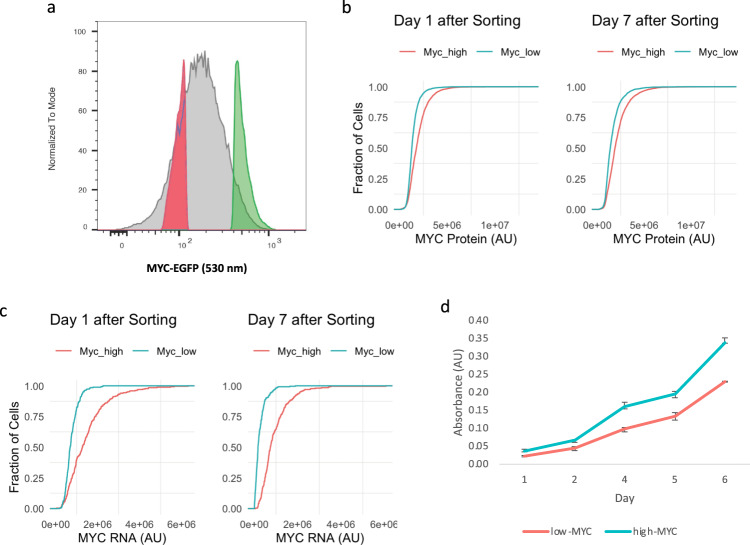
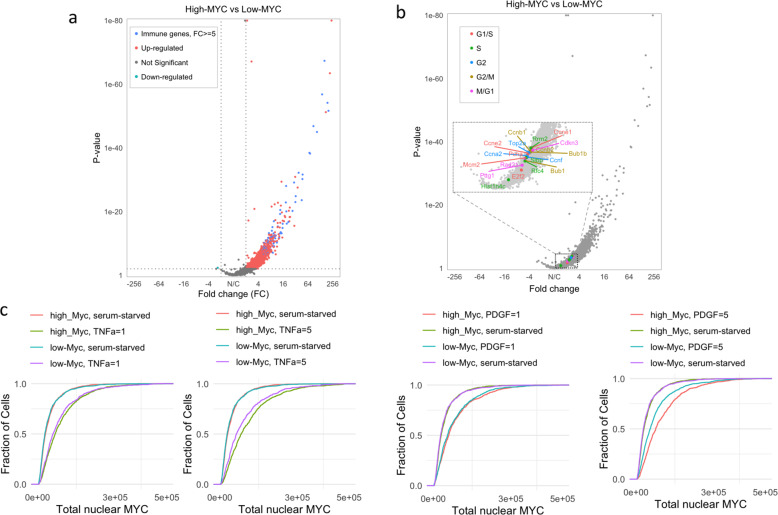
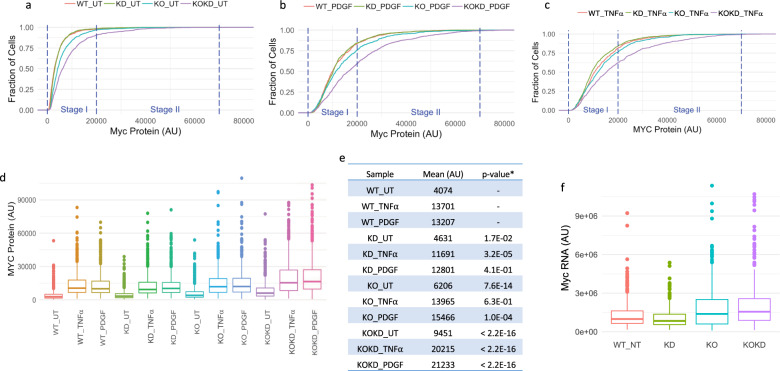
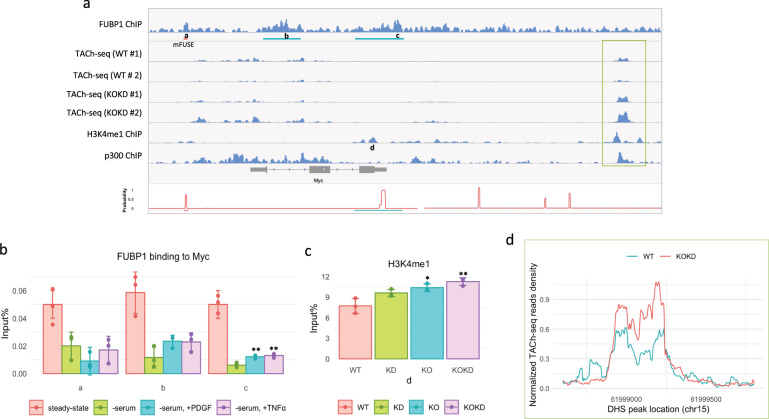
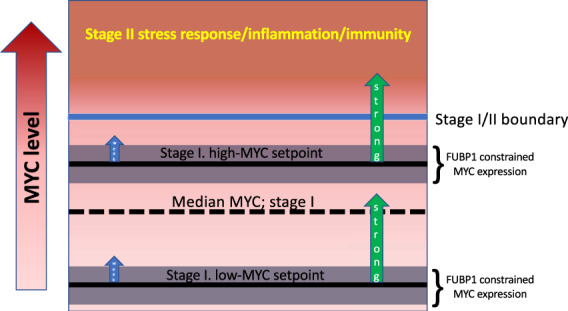
Physiologically, MYC levels must be precisely set to faithfully amplify the transcriptome, but in cancer MYC is quantitatively misregulated. Here, we study the variation of MYC amongst single primary cells (B-cells and murine embryonic fibroblasts, MEFs) for the repercussions of variable cellular MYC-levels and setpoints. Because FUBPs have been proposed to be molecular "cruise controls" that constrain MYC expression, their role in determining basal or activated MYC-levels was also examined. Growing cells remember low and high-MYC setpoints through multiple cell divisions and are limited by the same expression ceiling even after modest MYC-activation. High MYC MEFs are enriched for mRNAs regulating inflammation and immunity. After strong stimulation, many cells break through the ceiling and intensify MYC expression. Lacking FUBPs, unstimulated MEFs express levels otherwise attained only with stimulation and sponsor MYC chromatin changes, revealed by chromatin marks. Thus, the FUBPs enforce epigenetic setpoints that restrict MYC expression.


Conflict of interest statement

The authors declare no competing interests.

Figures

Fig. 1
Fig. 1. Distribution of MYC expression in single cells.
a, b MYC protein expression in single MEF by immunostaining. a An immunostaining image of MYC protein in single MEFs, showing that MYC is primarily localized in the nucleus of MEFs. b Histogram (light blue) and density plot (black) of MYC total nuclear protein level determined by immunofluorescence. c, d MYC protein expression in single B-cells by immunostaining. c An immunostaining image of MYC protein in single B-cells, showing that MYC is primarily localized in the nucleus. d Histogram (light blue) and density plot (black) of MYC total nuclear protein level in single naive B-cells are shown. AU: arbitrary unit. e Validation of quantitative immunofluorescence. Primary naive B-cells were stimulated with 25 µg/ml of LPS and 2.5 ng/ml of IL-4, and split into two parts for flow cytometry analysis (FACS) and quantitative immunofluorescence analysis (IF). Comparable results were obtained. f, g MYC mRNA expression in single MEF by in situ hybridization. f An in situ hybridization image of MYC mRNA in single MEFs. g Histogram (light blue) and density plot (black) of Myc RNA level determined by RNA in situ hybridization. AU: arbitrary unit.
Fig. 2
Fig. 2. MYC expression has two stages: low (I) and high (II) stages.
a A diagram illustrating the principles and biological implications of the PDF and the CDF plots used in this study. A random log-normal distribution data set were used as an example. b, c The empirical CDF plot of MYC protein level in naive and IL-4-stimulated B-cells (b), and in steady-state and FGF-stimulated MEFs (c) are shown. Low IL-4: 5 ng/ml; high IL-4: 50 ng/ml. Low FGF: 1 ng/ml; high FGF: 4 ng/ml. AU: arbitrary unit. Negative control: nonspecific IgG isotype control. Experiments were repeated with similar results (n = 3 independent experiments).
Fig. 3
Fig. 3. MYC setpoints are precisely set and fixed in individual cells.
a Sorting scheme for low- and high-MYC cells by MYC-GFP intensity. b, c The empirical CDF plot of MYC protein (b) and mRNA (c) expression in cells at day 1 (left) or 7 (right) after sorting. d The proliferation of low- and high-MYC cells determined by WST-1 assay. Experiments were performed in triplicate.
Fig. 4
Fig. 4. High-MYC cells are enriched for immune genes and are primed to express even higher MYC.
a The volcano plot of mRNA expression in high-MYC cells vs. low-MYC cells. In high-MYC cells, genes with the highest fold increase (FC ≥ 5) compared to low-MYC cells were enriched for inflammatory and immune response genes (GSEA analysis, FDR < 0.01), which are highlighted in blue. Each of the low-MYC and high-MYC RNA-seq samples has two technical replicates. b Compared with low-MYC cells, high-MYC cells are not enriched for well-defined cell cycle genes at specific stages. In the volcano plots of high-MYC and low-MYC cells, well-defined cell cycle genes at different stages are highlighted in different colors. c Effects of different doses of TNF-α or PDGF on the expression of MYC in low- or high-MYC cells. Unit of TNF-α or PDGF: ng/ml. AU: arbitrary unit. Experiments were repeated with similar results (n = 3 independent experiments).
Fig. 5
Fig. 5. Loss of FUBP1 and FUBP2 breaks the boundaries between Stage I and II, and erases MYC setpoints in individual cells.
The empirical CDF plot of MYC protein level in untreated (UT) (a), PDGF-stimulated (b), or TNFα-stimulated (c) MEFs are shown. d Loss of FUBP1 and FUBP2 causes increased MYC protein levels and variation in untreated and stimulated cells. e The mean of MYC protein level of samples in d. *T-test assuming unequal variance, compared with the wild-type sample subjected to the same treatment. f Loss of FUBP1 and FUBP2 causes increased Myc mRNA levels and variation. TNFα or PDGF (2 ng/ml) was used for treatment. AU: arbitrary unit. Experiments were repeated with similar results (n = 3 independent experiments).
Fig. 6
Fig. 6. FUBP1 binds broadly to the Myc gene in parallel to the expression of MYC and loss of FUBPs causes changes in the chromatin at the Myc locus.
a First panel: the FUBP1 ChIP-seq at Myc locus in MEFs. Peaks called by the SICER algorithm against input control are marked with green lines, FDR < 0.01. A mouse FUSE (mFUSE) with a high possibility of melting is marked by a pink line. The positions of the primers used in each panel of b and c were marked with the corresponding letters in this figure. The DNase hypersensitivity sites (DHS) downstream of Myc that were flanked by H3K4me1 peaks and overlapped with p300 peaks are marked by a light green rectangle and analyzed in d. Second to the fifth lines: the DHS peaks identified by TACh-seq in WT and KOKD MEFs, biological duplicates. Sixth panel: ENCODE data (ENCFF592HMA) of H3K4me1 ChIP-seq in MEFs. Seventh panel: p300 ChIP-seq in MEFs from published literature. Bottom panel: the transition probabilities calculated by SIDD algorithm as functions of base pair at the Myc locus and regions susceptible to melting are shown. The sequences of 3.7 kb upstream of the transcription start site (TSS) to the 1.2 kb downstream of TTS was analyzed as a superhelical domain, whereas 1.2 to 10 kb downstream of TTS was analyzed as another superhelical domain. Superhelical density = −0.06. The positions of the primers used in each panel of b and c were marked with the corresponding letters. b FUBP1 ChIP-qPCR results of the Myc locus in steady-state and PDGF- or TNFα-stimulated MEFs are shown. The positions of the primers used in each panel are marked with the corresponding letters in a. Experiments were performed in triplicate. **p < 0.01, T-test assuming unequal variance, two-tailed, compared to the serum-starved sample. c The results of H3K4me1 ChIP-qPCR on the Myc gene in WT, KD, KO, and KOKD MEFs are shown. The position of the primers used in this figure is marked with the corresponding letters in Figure a. Experiments were performed in triplicate. *p < 0.05, **p < 0.01, T-test assuming unequal variance, two-tailed, compared to the WT. d The average of the normalized TACh-seq reads density of two biological replicates of WT and KOKD MEFs were plotted on the DHS peak downstream of Myc (the region marked by a light green rectangle in a). DESeq2 analysis showed the signal of this DHS peak in KOKD is significantly higher in KOKD than that in WT (FDR < 0.05), with an average fold increase of 1.6.
Fig. 7
Fig. 7. The basal levels of MYC determines the strength of the response to the stimulus.
In response to a weak stimulus (left), the cells in Stage I shift upwards while adhering to the upper limit. In response to a strong stimulus (right), the basal MYC levels determine the number of cells entering into Stage II. The cells with a high-MYC setpoint are more likely to enter Stage II. FUBP1 and FUBP2 play an essential role in limiting the expression of MYC in Stage I.

Similar articles

Cited by

References

    1. Conacci-Sorrell M, McFerrin L, Eisenman RN. An overview of MYC and its interactome. Cold Spring Harb. Perspect. Med. 2014;4:a014357. doi: 10.1101/cshperspect.a014357. - DOI - PMC - PubMed
    1. Dang CV. MYC on the path to cancer. Cell. 2012;149:22–35. doi: 10.1016/j.cell.2012.03.003. - DOI - PMC - PubMed
    1. Hanahan D, Weinberg RA. Hallmarks of cancer: the next generation. Cell. 2011;144:646–674. doi: 10.1016/j.cell.2011.02.013. - DOI - PubMed
    1. Wasylishen AR, Penn LZ. Myc: the beauty and the beast. Genes cancer. 2010;1:532–541. doi: 10.1177/1947601910378024. - DOI - PMC - PubMed
    1. Kim J, Chu J, Shen X, Wang J, Orkin SH. An extended transcriptional network for pluripotency of embryonic stem cells. Cell. 2008;132:1049–1061. doi: 10.1016/j.cell.2008.02.039. - DOI - PMC - PubMed

Publication types