. 2020 Nov;15(11):3595-3614.
doi: 10.1038/s41596-020-0387-4. Epub 2020 Sep 30.

A generalized workflow for conducting electric field-optimized, fMRI-guided, transcranial magnetic stimulation

Affiliations

A generalized workflow for conducting electric field-optimized, fMRI-guided, transcranial magnetic stimulation

Nicholas L Balderston et al. Nat Protoc. 2020 Nov.

Abstract

Transcranial magnetic stimulation (TMS) is a noninvasive method to stimulate the cerebral cortex that has applications in psychiatry, such as in the treatment of depression and anxiety. Although many TMS targeting methods that use figure-8 coils exist, many do not account for individual differences in anatomy or are not generalizable across target sites. This protocol combines functional magnetic resonance imaging (fMRI) and iterative electric-field (E-field) modeling in a generalized approach to subject-specific TMS targeting that is capable of optimizing the stimulation site and TMS coil orientation. To apply this protocol, the user should (i) operationally define a region of interest (ROI), (ii) generate the head model from the structural MRI data, (iii) preprocess the functional MRI data, (iv) identify the single-subject stimulation site within the ROI, and (iv) conduct E-field modeling to identify the optimal coil orientation. In comparison with standard targeting methods, this approach demonstrates (i) reduced variability in the stimulation site across subjects, (ii) reduced scalp-to-cortical-target distance, and (iii) reduced variability in optimal coil orientation. Execution of this protocol requires intermediate-level skills in structural and functional MRI processing. This protocol takes ~24 h to complete and demonstrates how constrained fMRI targeting combined with iterative E-field modeling can be used as a general method to optimize both the TMS coil site and its orientation.

Trial registration: ClinicalTrials.gov NCT03027414.


Figures

Fig. 1 ∣
Fig. 1 ∣. Schematic of the steps described in the Procedure.
a, Example of a group-level target mask from functional data collected during the Sternberg WM task. b, BOLD data from a single subject collected during the Sternberg WM task. c, Surface mesh created by the mri2mesh algorithm. d, Peak activation within target mask from BOLD image in b. e, E-field simulation targeting coordinates depicted in d. f, Polar plot for a single subject representing E-field magnitude as a function of coil orientation visualized on the scalp for use in neuronavigation software. g, Mark for TMS coil placement from a session targeting coordinates in d. Labels on figure correspond to section headings in protocol.
Fig. 2 ∣
Fig. 2 ∣. Schematic demonstrating the use of the task throughout the targeting and stimulation steps.
a, We recommend using a task (Sternberg WM paradigm in our case) to derive a functional ROI centered on the target region (see ‘Target definition’ section of the Procedure). Each trial of the Sternberg task consists of encoding, maintenance, and retrieval periods separated by a variable intertrial interval (ITI). During the encoding period, subjects are presented with a series of letters. During the maintenance period, the subjects are required to retain the series of letters in WM. During the retrieval period, subjects indicate whether the position of the letter in the series matches the number. b, We recommend using the same task to generate the BOLD data to guide the TMS targeting (see ‘Data collection’ section of the Procedure). c, We recommend using the same task during stimulation to capitalize on paired associative stimulation processes (see ‘Neuronavigation’ section of the Procedure). During online stimulation, the TMS train can be delivered during the maintenance interval.
Fig. 3 ∣
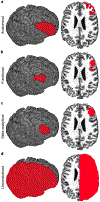
Fig. 3 ∣. Example masks obtained using anatomical, functional, meta-analytical, and unconstrained methodologies plotted for a single subject’s T1 scan.
a, Single-subject gray matter mask of the right middle frontal gyrus from the Desikan-Killiany atlas. b, Group mask obtained from subjects performing the Sternberg WM task. c, Mask obtained from the NeuroSynth database from a search on the term ‘Working Memory’. d, Mask of the right hemisphere intended to represent a ‘no mask’ condition. All participants gave written informed consent and were compensated for their time; the study was approved by the National Institute of Mental Health (NIMH) Combined Neuroscience Institutional Review Board.
Fig. 4 ∣
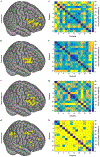
Fig. 4 ∣. Peak activations and intersubject distance matrices from Sternberg WM BOLD maps using different masks as input.
a–d, Peak activations from Sternberg WM BOLD maps using anatomical (a), functional (b), meta-analytical (c), and unconstrained (d) masks as input. Peak activations for each subject are pseudo-colored (individual peaks = yellow; overlap = red). e–h, Pairwise intersubject distance matrices (i.e., Euclidean distance between the activation peaks for each pair of subjects) based on coordinates derived using anatomical (e), functional (f), meta-analytical (g), and unconstrained (h) masks as input. All participants gave written informed consent and were compensated for their time; the study was approved by the National Institute of Mental Health (NIMH) Combined Neuroscience Institutional Review Board.
Fig. 5 ∣
Fig. 5 ∣. Distance metrics of the peak activations from Sternberg WM BOLD maps using different masks as input.
a, Scalp-to-cortex distance of the peak BOLD activation coordinates plotted in Fig. 4. b) Intersubject distance of the peak BOLD activation coordinates plotted in Fig. 4. All participants (N = 14) gave written informed consent and were compensated for their time; the study was approved by the National Institute of Mental Health (NIMH) Combined Neuroscience Institutional Review Board. Bars represent means; error bars represent standard error of the mean.
Fig. 6 ∣
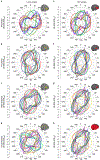
Fig. 6 ∣. Changes in the normalized E-field simulated for each target, plotted as a function of coil handle orientation.
a–d, Polar E-field plots for targets derived from anatomical (a), functional (b), meta-analytical (c), and unconstrained (d) masks sampled using a local 5-mm radius sphere. e–h, Polar E-field plots for targets derived from anatomical (e), functional (f), meta-analytical (g), and unconstrained (h) masks sampled using the corresponding ROI mask. Each line represents data from a single subject. Lines are pseudo-colored to enable visual discrimination. Larger distances from the center indicate larger current estimates in the target region at that orientation. All participants gave written informed consent and were compensated for their time; the study was approved by the National Institute of Mental Health (NIMH) Combined Neuroscience Institutional Review Board.
Fig. 7 ∣
Fig. 7 ∣. Metrics used to assess E-field models based on input masks and evaluation strategy.
a, Chi-square values representing consistency of coil handle orientation across subjects given distinct input masks (anatomical, functional, meta-analytical, unconstrained) and E-field sampling metrics (local versus ROI). Bars represent chi-square values showing consistency across subjects. b, E-field magnitude given peaks obtained from distinct input masks (anatomical, functional, meta-analytical, unconstrained) based on sample type (local versus ROI). Bars represent means; error bars represent standard error of the mean. All participants (N = 14) gave written informed consent and were compensated for their time; the study was approved by the National Institute of Mental Health (NIMH) Combined Neuroscience Institutional Review Board.

References

    1. Laakso I, Murakami T, Hirata A & Ugawa Y Where and what TMS activates: experiments and modeling. Brain Stimul. 11, 166–174 (2017). - PubMed
    1. Terao Y & Ugawa Y Basic mechanisms of TMS. J. Clin. Neurophysiol 19, 322–343 (2002). - PubMed
    1. Thielscher A & Kammer T Electric field properties of two commercial figure-8 coils in TMS: calculation of focality and efficiency. Clin. Neurophysiol 115, 1697–1708 (2004). - PubMed
    1. Roth Y, Amir A, Levkovitz Y & Zangen A Three-dimensional distribution of the electric field induced in the brain by transcranial magnetic stimulation using figure-8 and deep H-coils. J. Clin. Neurophysiol 24, 31–38 (2007). - PubMed
    1. Deng Z-D, Lisanby SH & Peterchev AV Electric field depth-focality tradeoff in transcranial magnetic stimulation: simulation comparison of 50 coil designs. Brain Stimul. 6, 1–13 (2013). - PMC - PubMed

Publication types

Associated data