. 2019 Mar 15:321:705-714.
doi: 10.1016/j.icarus.2018.12.018. Epub 2018 Dec 6.

Maps of Tethys' Thermophysical Properties

Affiliations

Maps of Tethys' Thermophysical Properties

C J A Howett et al. Icarus. .

Abstract

On 11th April 2015 Cassini's Composite Infrared Spectrometer (CIRS) made a series of observations of Tethys' daytime anti-Saturn hemisphere over a nine-hour time period. During this time the sub-spacecraft position was remarkably stable (0.3° S to 3.9° S; 153.2° W to 221.8° W), and so these observations provide unprecedented coverage of diurnal temperature variations on Tethys' anti-Saturn hemisphere. In 2012 a thermal anomaly was discovered at low latitudes on Tethys' leading hemisphere; it appears cooler during the day and warmer at night than its surroundings (Howett et al., 2012) and is spatially correlated with a decrease in the IR3/UV3 visible color ratio (Schenk et al., 2011). The cause of this anomaly is believed to be surface alteration by high-energy electrons, which preferentially bombard low-latitudes of Tethys' leading hemisphere (Schenk et al., 2011; Howett et al., 2012; Paranicas et al. 2014; Schaible et al., 2017). The thermal anomaly was quickly dubbed "Pac-Man" due to its resemblance to the 1980s video game icon. We use these daytime 2015 CIRS data, along with two sets of nighttime CIRS observations of Tethys (from 27 June 2007 and 17 August 2015) to make maps of bolometric Bond albedo and thermal inertia variations across the anti-Saturn hemisphere of Tethys (including the edge of its Pac-Man region). These maps confirm the presence of the Pac-Man thermal anomaly and show that while Tethys' bolometric Bond albedo varies negligibly outside and inside the anomaly (0.69±0.02 inside, compared to 0.71±0.04 outside) the thermal inertia varies dramatically (29±10 J m-2 K-1 s-1/2 inside, compared to 9±4 J m-2 K-1 s-1/2 outside). These thermal inertias are in keeping with previously published values: 25±3 J m-2 K-1 s-1/2 inside, and 5±1 J m-2 K-1 s-1/2 outside the anomaly (Howett et al., 2012). A detailed analysis shows that on smaller spatial-scales the bolometric Bond albedo does vary: increasing to a peak value at 180° W. For longitudes between ~100° W and ~160° W the thermal inertia increases from northern to southern latitudes, while the reverse is true for bolometric Bond albedo. The thermal inertia on Tethys generally increases towards the center of its leading hemisphere but also displays other notable small-scale variations. These thermal inertia and bolometric Bond albedo variations are perhaps due to differences in competing surface modification by E ring grains and high-energy electrons which both bombard Tethys' leading hemisphere (but in different ways). A comparison between the observed temperatures and our best thermal model fits shows notable discrepancies in the morning warming curve, which may provide evidence of regional variations in surface roughness effects, perhaps again due to variations in surface alteration mechanisms.


Figures

Figure 1 –
Figure 1 –
The mass influx map for Tethys from Kempf et al. (2018).
Figure 2 –
Figure 2 –
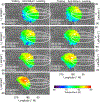
Daytime surface temperature maps of Tethys derived from Cassini Rev 214 FP3 scans taken on 11th April 2015. Times of each scan are shown in the subfigures. The contours describe the predicted electron energy flux onto Tethys’ surface, in units of log10(MeV cm−2 s−1). The white spots in the center of the image show the location of the sub-solar position during the time of the scan. The background map is Planetary Image Atlas (PIA) 14931, white-dotted horizontal line indicates the position of 0° N.
Figure 3 –
Figure 3 –
Nighttime surface temperatures of Tethys derived from CIRS FP1 observations taken during Cassini Revs 47 and 220. The contours are the same as described in Figure 1, and the white cross shows the location of the sub-solar point at the time of the scan. The background map is Planetary Image Atlas (PIA) 14931, white-dotted horizontal line indicates the position of 0° N.
Figure 3 –
Figure 3 –
Nighttime surface temperatures of Tethys derived from CIRS FP1 observations taken during Cassini Revs 47 and 220. The contours are the same as described in Figure 1, and the white cross shows the location of the sub-solar point at the time of the scan. The background map is Planetary Image Atlas (PIA) 14931, white-dotted horizontal line indicates the position of 0° N.
Figure 4 –
Figure 4 –
Maps of Tethys’ thermal inertia and bolometric Bond albedo, with their standard deviations. The darker grey areas indicate where CIRS had coverage, but not enough to provide adequate constraints on the surface’s thermophysical properties. The contours describe the predicted electron energy flux onto Tethys’ surface. They show the predicted electron energy flux onto Tethys’ surface, in units of log10(MeV cm−2 s−1). The basemap on all images is PIA 14931, with the exception of the bottom maps, which show the IR3/UV3 color ratio (930 nm / 338 nm) map for Tethys from Schenk et al. (2011). The white-dotted horizontal line on sub-figures indicates the position of 0° N. Note, the bottom two maps are identical except the right-hand one has the equator and electron flux contours overlaid, the left-hand one is kept clear so the details of the map can be seen.
Figure 5 –
Figure 5 –
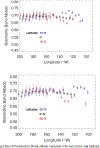
Bolometric Bond albedo and thermal inertia variations with local time and latitude. In both subfigures values are given at: 20° S, 0° and 20° N latitudes, and the error bars show ±1σ uncertainty. For reference the ±10° latitude lies just inside of the inner contour shown on the maps in Figures 1 to 3, and ±20° latitude lies just outside of it.
Figure 5 –
Figure 5 –
Bolometric Bond albedo and thermal inertia variations with local time and latitude. In both subfigures values are given at: 20° S, 0° and 20° N latitudes, and the error bars show ±1σ uncertainty. For reference the ±10° latitude lies just inside of the inner contour shown on the maps in Figures 1 to 3, and ±20° latitude lies just outside of it.
Figure 6 –
Figure 6 –
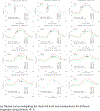
Best fit diurnal temperature curves compared to observed local time temperatures for different longitudes along latitudes 10° S, 0° N and 10° N. Observations and modeled temperatures for different epochs are given by different colors, and the symbol of the observed temperatures describes its emission angle (see key in figure for details). The best fitting thermal inertia and bolometric Bond albedo for each longitude and latitude location is given in the figure. In the event an acceptable fit wasn’t found the diurnal curves produced by the best fit to 200° W, 10° S (thermal inertia of 10 MKS and a bolometric Bond albedo of 0.69) are shown to guide the eye (given by the dotted lines). Since Rev 214 and 220 occur closer together than Rev 47 their modeled diurnal temperature curves are almost the same.
Figure 6 –
Figure 6 –
Best fit diurnal temperature curves compared to observed local time temperatures for different longitudes along latitudes 10° S, 0° N and 10° N. Observations and modeled temperatures for different epochs are given by different colors, and the symbol of the observed temperatures describes its emission angle (see key in figure for details). The best fitting thermal inertia and bolometric Bond albedo for each longitude and latitude location is given in the figure. In the event an acceptable fit wasn’t found the diurnal curves produced by the best fit to 200° W, 10° S (thermal inertia of 10 MKS and a bolometric Bond albedo of 0.69) are shown to guide the eye (given by the dotted lines). Since Rev 214 and 220 occur closer together than Rev 47 their modeled diurnal temperature curves are almost the same.
Figure 7
Figure 7
Bolometric bond albedo variation with thermal inertia for different surface regions and the ±1σ uncertainty. In all subfigures the previously published thermal inertia inside the thermal anomalies of Mimas, Tethys and Dione are indicated by the grey lines, and their uncertainties by the grey shading (c.f. Howett et al., 2011, and 2014)
Figure 7
Figure 7
Bolometric bond albedo variation with thermal inertia for different surface regions and the ±1σ uncertainty. In all subfigures the previously published thermal inertia inside the thermal anomalies of Mimas, Tethys and Dione are indicated by the grey lines, and their uncertainties by the grey shading (c.f. Howett et al., 2011, and 2014)

References

    1. Abramov O, A Rathbun J, Schmidt BE and Spencer JR, Detectability of thermal signatures associated with active formation of ‘chaos terrain’ on Europa, Earth and Planetary Science Letters 384, 37–41, 2013.
    1. Buratti B and Veverka J, Voyager Photometry of Rhea, Dione, Tethys, Enceladus and Mimas, Icarus 58, 254–264, 1984.
    1. Elder C, Helfenstein P, Thomas P, Veverka J, Burns JA, Denk T and Porco C. Tethys’ Mysterious Equatorial Band, Bulletin of the American Astronomical Society 39, 429, 2007.
    1. Filacchione G, D’Aversa E, Capaccioni F, Clark RN, Cruikshank DP, Ciarniello M, Cerroni P, Bellucci G, Brown RH, Buratti BJ, Nicholson PD, Jaumann R, McCord TB, Sotin C, Stephan K, Dalle Ore CM, Saturn’s icy satellites investigated by Cassini-VIMS. IV. Daytime temperature maps, Icarus 271, 292–313, 2016.
    1. Flasar FM, Kunde VG, Abbas MM, Achterberg RK, Ade P, Barucci A, Bézard B, Bjoraker GL, Brasunas JC, Calcutt SB, Carlson R, Césarsky CJ, Conrath BJ, Coradini A, Courtin R, Coustenis A, Edberg S, Edgington S, Ferrari C, Fouchet T, Gautier D, Gierasch PJ, Grossman K, Irwin P, Jennings DE, Lellouch E, Mamoutkine AA, Marten A, Meyer JP, Nixon CA, Orton GS, Owen TC, Pearl JC, Prangé R, Raulin F, Read PL, Romani PN, Samuelson RE, Segura ME, Showalter MR, Simon-Miller AA, Smith MD, Spencer JR, Spilker LJ and Taylor FW. Exploring the Saturn System in the Thermal Infrared: The Composite Infrared Spectrometer, Space Science Review 115, 169–297, doi: 10.1007/s11214-004-1454-9, 2004. - DOI

LinkOut - more resources