. 2020 Aug 28:14:233.
doi: 10.3389/fncel.2020.00233. eCollection 2020.

Immune Factor, TNFα, Disrupts Human Brain Organoid Development Similar to Schizophrenia-Schizophrenia Increases Developmental Vulnerability to TNFα

Affiliations

Immune Factor, TNFα, Disrupts Human Brain Organoid Development Similar to Schizophrenia-Schizophrenia Increases Developmental Vulnerability to TNFα

Courtney A Benson et al. Front Cell Neurosci. .

Abstract

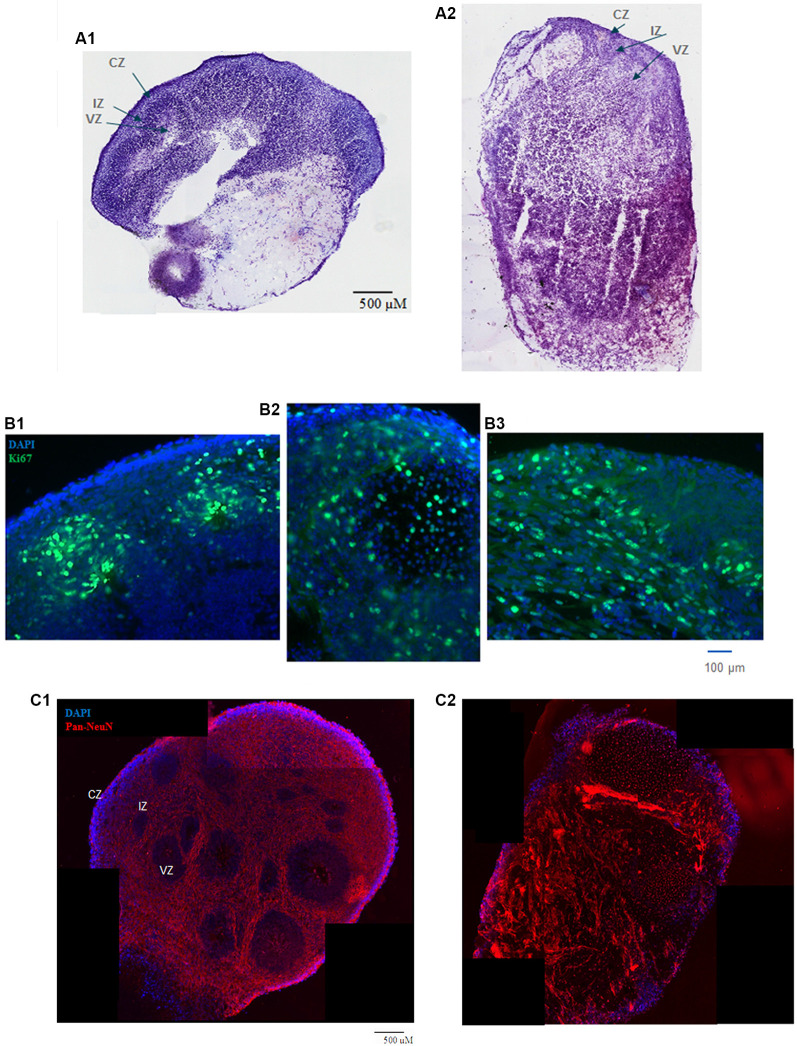
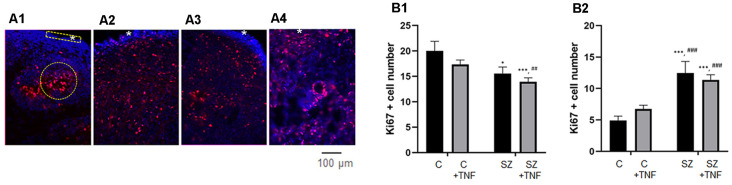
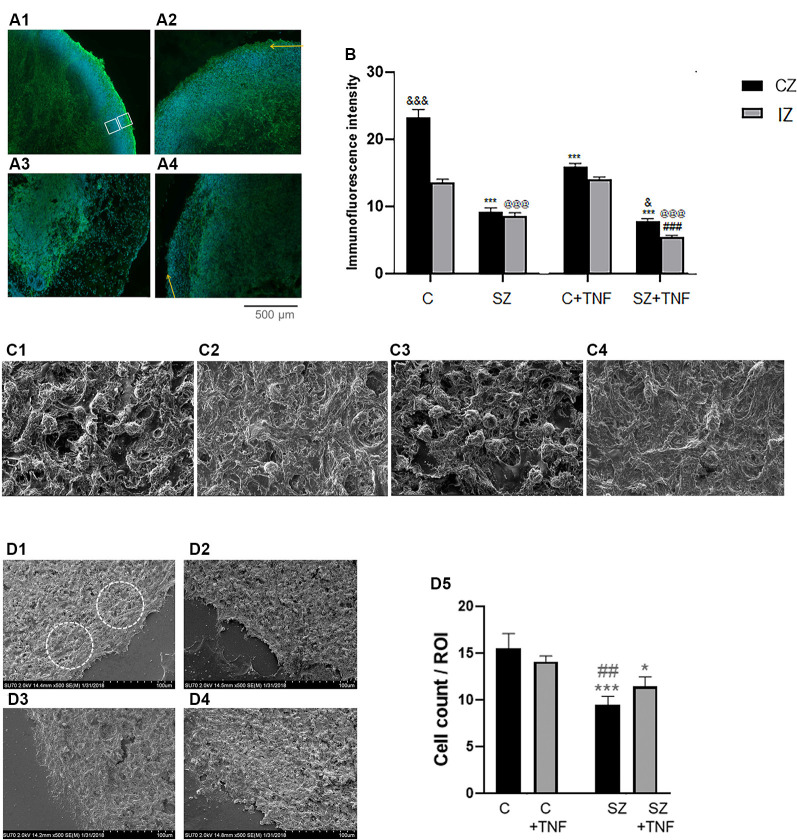
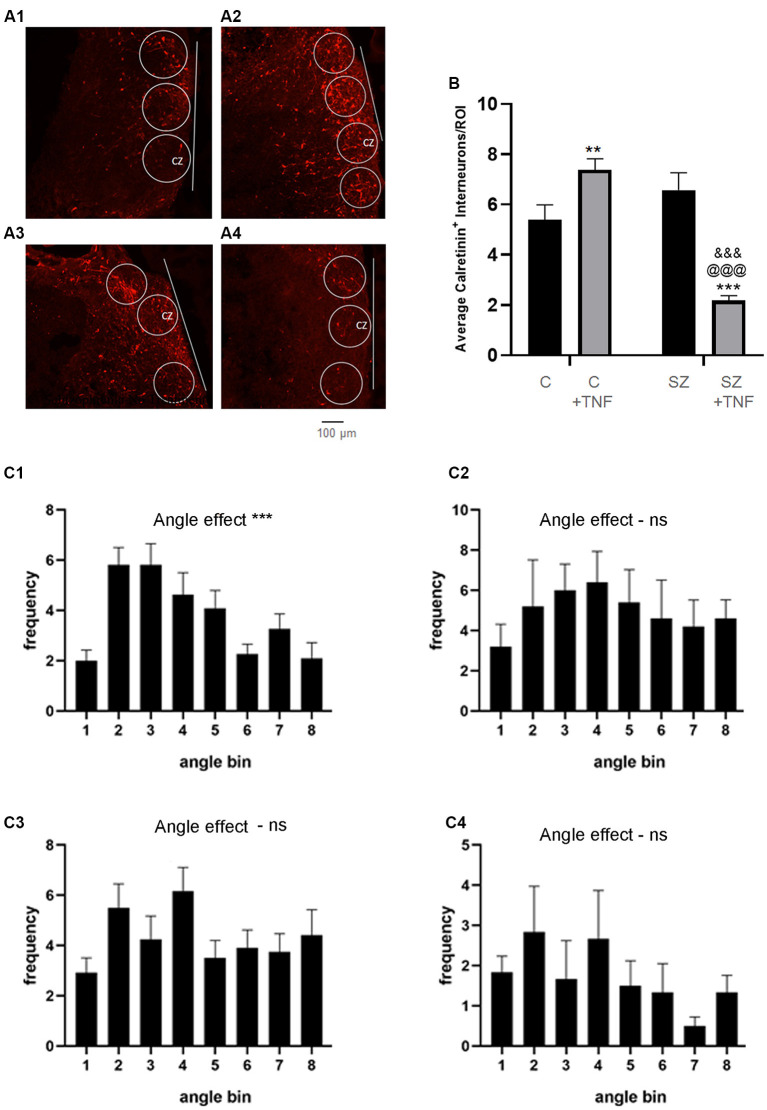
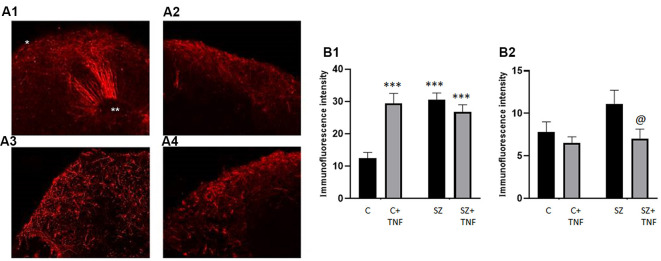
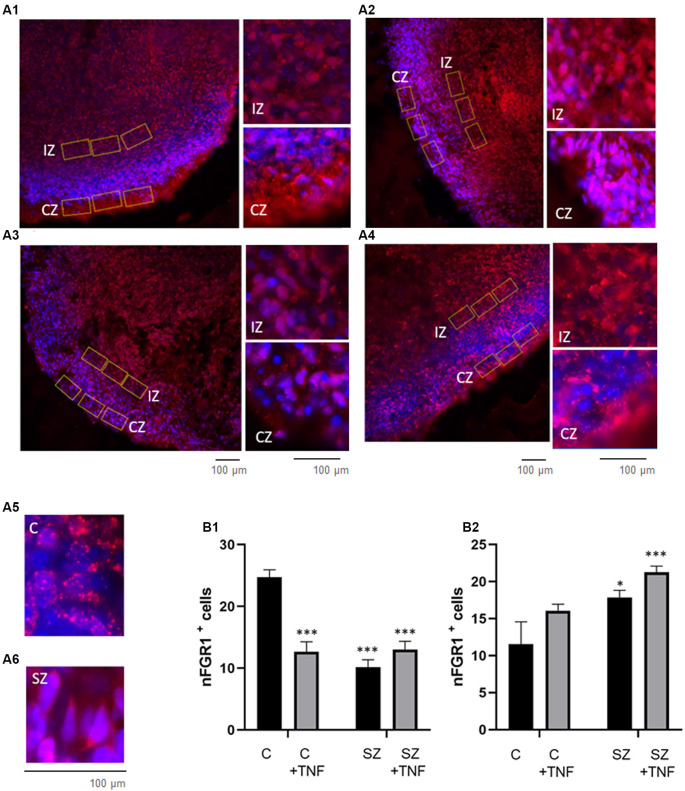
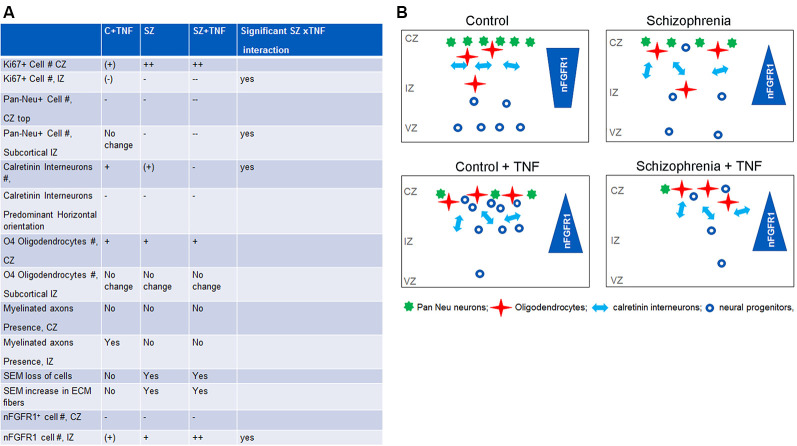
Schizophrenia (SZ) is a neurodevelopmental genetic disorder in which maternal immune activation (MIA) and increased tumor necrosis factor-α (TNF-α) may contribute. Previous studies using iPSC-derived cerebral organoids and neuronal cells demonstrated developmental malformation and transcriptional dysregulations, including TNF receptors and their signaling genes, common to SZ patients with diverse genetic backgrounds. In the present study, we examined the significance of the common TNF receptor dysregulations by transiently exposing cerebral organoids from embryonic stem cells (ESC) and from representative control and SZ patient iPSCs to TNF. In control iPSC organoids, TNF produced malformations qualitatively similar in, but generally less pronounced than, the malformations of the SZ iPSC-derived organoids. TNF and SZ alone disrupted subcortical rosettes and dispersed proliferating Ki67+ neural progenitor cells (NPC) from the organoid ventricular zone (VZ) into the cortical zone (CZ). In the CZ, the absence of large ramified pan-Neu+ neurons coincided with loss of myelinated neurites despite increased cortical accumulation of O4+ oligodendrocytes. The number of calretinin+ interneurons increased; however, they lacked the preferential parallel orientation to the organoid surface. SZ and SZ+TNF affected fine cortical and subcortical organoid structure by replacing cells with extracellular matrix (ECM)-like fibers The SZ condition increased developmental vulnerability to TNF, leading to more pronounced changes in NPC, pan-Neu+ neurons, and interneurons. Both SZ- and TNF-induced malformations were associated with the loss of nuclear (n)FGFR1 form in the CZ and its upregulation in deep IZ regions, while in earlier studies blocking nFGFR1 reproduced cortical malformations observed in SZ. Computational analysis of ChiPseq and RNAseq datasets shows that nFGFR1 directly targets neurogenic, oligodendrogenic, cell migration, and ECM genes, and that the FGFR1-targeted TNF receptor and signaling genes are overexpressed in SZ NPC. Through these changes, the developing brain with the inherited SZ genome dysregulation may suffer increased vulnerability to TNF and thus, MIA.

Keywords: neural progenitor cell; nuclear fibroblast growth factor receptor-1; oligodendrocyte; organoids; schizophrenia; tumor necrosis factor.


Figures

Figure 1
Figure 1
(A) HUES8s organoid at 5 weeks—tile scanning of NISSL staining. Representative images are shown of (A1) control, non-treated organoid, and (A2) Tumor Necrosis Factor-α (TNF-α) (1 ng/ml) treated organoid. (B) Rosette formation in HUES8 organoids at 5 weeks—immunostaining of Ki67+ proliferating cells (green immunostaining) and DAPI stained nuclei (blue). (B1) Control HUES8 organoids not exposed to TNF formed cortical rosettes with Ki67+ proliferative cells. (B2) In HUES8, organoids exposed to 1 ng/ml TNF and (B3) in HUES8 organoids exposed to 10 ng/ml TNF Ki67 positive cells were dispersed throughout the organoids. (C) Neuronal development in HUES8 organoids at 5 weeks, pan-Neu immunostaining—red, DAPI—blue, tile scanning. (C1) In control organoids, pan-Neu+ neurons were located throughout the organoids outside of the ventricular zones (VZ), in the intermediate zone (IZ) and were concentrated in the cortical zone (CZ). (C2) HUES8 organoids exposed to 1 ng/ml TNF exhibited disorganized pan-Neu neuronal development, with clusters of pan-Neu+ cells dispersed throughout the tissue, and concentrated in the scar-like region. Note fewer pan-Neu+ neurons in the CZ of TNF-exposed organoids.
Figure 2
Figure 2
(A) Disorganized migration of proliferating cells in SZ and TNF exposed 5-week control (C) organoids; (A1)—C, (A2)—C+TNF, (A3)—SZ, (A4)—SZ+TNF. The images show organoids were immunostained for Ki67 (red) used to quantify cell densities in cortical regions of interest (ROIs; rectangle), *marks superficial cortical region. In organoids shown in (A2–A4), note the dispersion of proliferating (Ki67+) cells outside the VZ into IZ and CZ. Examples of ROIs—circular—IZ, rectangular—CZ. (B) Changes in ki67+ cell densities. (B1) IZ—Density of Ki67+ cells in IZ was analyzed in circular ROIs [four sections per organoid of each of the four iPSC organoid groups (C, C+TNF, SZ, SZ+TNF), 1–3 ROIs per section]. Bars represent average ROI cell numbers per section. Two-way ANOVA compared—main effect of SZ, F = 10.44, p < 0.005; TNF, F = 3.07, p = 0.08. LSD post hoc analysis: *,***Different from C, p < 0.05, p < 0.0001; ##,###different from C+TNF. (B2) CZ—Density of Ki67+ cells in CZ was analyzed in rectangular ROIs (two to four sections per organoid of each group, three to seven ROI per section). Bars represent average ROI cell numbers per section. Two-way ANOVA—main effects of SZ, F = 40.2, p < 0.0001; no effect of TNF F = 0.139, p = 0.7; no significant interaction F = 2.34. *,***Different from C, p < 0.05, p < 0.0001; ##,###different from C+TNF.
Figure 3
Figure 3
(A) Analysis of pan-Neu+ neuronal networks in 5-week iPSC organoids. Examples of the pan-Neu antibody stained images depicting the pan-Neu neuronal networks. In each image, pan-Neu immunofluorescence intensity was measured in five ROIs each in the cortical area (CZ), five in subcortical region of the IZ (examples on A1). Five additional ROIs placed outside the tissue were used for background subtraction (not shown), (A1)—C; (A2)—C + TNF, (A3)—SZ; (A4)—SZ + TNF. Yellow arrows point to cortical surface. (B) Quantitative analysis of pan-Neu intensity numbers in analyzed ROIs. Sixteen organoids, four from each condition and 10 sections from each organoid were analyzed for the pan-Neu immunofluorescence intensity as indicated on panel (A); black bars—CZ, gray bars—subcortical IZ. Bars represent average ROI fluorescence intensity per section. Three-way ANOVA: significant main effects of SZ, F = 531.8 (p < 0.0001), TNF F = 55.33 (p < 0.0001), and organoid region F = 86.57 (p < 0.0001), as well as significant interactions (p < 0.0001), disease × organoid region, F = 29.22, and TNF × organoid region F = 15.91. In C organoids, the pan-Neu+ neuronal density was significantly higher in CZ than subcortical zone region of the IZ (p < 0.0001). Post hoc LSD: CZ, ***different from C (p < 0.0001), and different from SZ (p < 0.05); IZ, @@@different from C (p < 0.0001), ###different from SZ (p < 0.0001). (C) Scanning electron microscopy (SEM) images of different organoid conditions: (C1)—C, (C2)—SZ, (C3)—C + TNF, (C4)—SZ + TNF; magnification 2,500×. Note reduced cell density and increased ECM fiber density in SZ and in SZ + TNF. (D) Cell densities were counted within circular ROIs (examples shown) in organoid images: (D1)—C, (D2)—SZ, (D3)—C + TNF and (D4)—SZ + TNF; magnification 500×. Panel (D5) shows results of cell counting. Two-way ANOVA: significant main effect of SZ, F = 15.73, p < 0.005. LSD: different from C (***p < 0.001; *p < 0.05); different from C + TNF (##p < 0.01).
Figure 4
Figure 4
(A) Density and orientation of cortical calretinin interneurons. (A) Images of organoids immunostained for calretinin (red): (A1)—C, (A2)—C+TNF, (A3)—SZ and (A4)—SZ+TNF). ROIs were outlined in which densities and orientation (angles) of the Calretinin+ interneurons long axis relative to the organoid surface (indicated by line) were measured. Sixteen organoids were analyzed, four from each condition. A total 117 ROIs were placed across the CZ of the four conditions (27–30/condition). (B) The average cell density of the calretinin+ interneurons/ROI is shown. Two-way ANOVA analysis, showed a main significant effect of SZ F(1,115) = 18.09, p < 0.001, main significant effect of TNF (p < 0.05) and a significant interaction between the disease and TNF exposure, F(1,115) = 45.05, p < 0.0001. Post hoc LSD: **,***different from C (p < 0.0001, p < 0.005), @@@different from C+TNF (p < 0.0001),&&&different from SZ (p < 0.0001). (C) Angles between the long axis of each calretinin+ cell and the cortical surface organoids were computed as described in the “Materials and Methods” section. Graph shows average frequency distribution of cells in ROIs in bins corresponding to the deviation angles from the cortical surface. Bin 1: 0–10°; 2: 10–20°; 3: 20–30°, etc. (C1)—C, c2—SZ, (C3)—C+TNF, (C4)—SZ+TNF. One-way ANOVA: main angle effect: (C1) F(8,90) = 6.635, ***p < 0.0001, (C2) F(8,36) = 0.97, p = 0.47, (C3) F(7,88) = 1.65, (C4) F(8,45) = 0.92, p = 0.5. ns = non-significant.
Figure 5
Figure 5
Distribution of O4 Oligodendrocytes is affected in SZ and by TNFα. Panel (A) shows the florescent microscopy images of O4 antibody stained organoids (red). (A1)—C, (A2)—C+TNF, (A3)—SZ, (A4)—SZ+TNF. The radial scaffolding of migrating O4 cells emanating from ventricular rosettes towards the cortex in the C organoids (A1) was largely lost in C+TNF, SZ, and SZ+TNF organoids (A2–A4). In TNF-treated and in SZ organoids, conditions O4 oligodendrocytes were largely restricted to the cortical region. *CZ, **VZ. (B) Changes in O4+ immunofluorescence intensity induced by TNF and in SZ. A total of 16 organoids were analyzed, four from each condition; CZ—cortical region, IZ—subcortical region. A total of 128 ROIs were analyzed, with eight ROIs/image, four in CZ—cortical region, four in IZ—subcortical region. In each image, four additional ROIs were placed outside and use for background subtraction, but were not part of the total count. (B1)—CZ, two-way ANOVA: significant main effect of SZ F = 11.04, p < 0.05, TNF F = 8.088, p < 0.05, SZ × TNF interaction F = 19.81, p < 0.0001. (B2)—IZ, two-way ANOVA: significant effect of TNF F = 5.054, p < 0.05. LSD: ***different from C (p < 0.0001); @different from SZ (p < 0.05). In addition a three-way ANOVA of combined CZ and IZ showed significant main effects of SZ F = 13.67 (p = 0.0003), and organoid region F = 163.4 (p < 0.0001) as well as significant interactions, disease × TNF F = 20.1 (p < 0.0001), disease × organoid region F = 4.915 (p = 0.0285), TNF × organoid region F = 12.65 (p = 0.0005) and disease × TNF × organoid region F = 11.74 (p = 0.0008).
Figure 6
Figure 6
Increases in nFGFR1 expression in subcortical cells and loss of nFGFR1 expression in cortical cells in SZ organoids and induced by TNF. (A) Immunostaining of FGFR1 (red) and co-staining with DAPI (blue). Organoids: (A1)—C, (A2)—C+TNF, (A3)—SZ, (A4)—SZ+TNF. In C organoids the nFGFR1 was highly expressed in the CZ cells and less expressed in the IZ cells. This pattern was reversed in SZ and TNF conditions, where nFGFR1 was depleted in the CZ and more highly concentrated in the IZ. Examples of different subcellular localization of FGFR1 staining: nuclear in C (A5) and cytoplasmic in C (A6), CZ organoid area. Red/pink speckles on a blue DAPI background represent nFGFR1, while cytoplasmic FGFR1 forms red cytoplasmic staining surrounding the blue DAPI stained nuclei. For each image, three of the same ROIs were placed in the CZ and three in the IZ. (B) Sixteen organoids, four from each condition and four images from each organoid were analyzed for the number of cells with nFGFR1 (colocalized FGFR1 and DAPI stains). For each image, the total number of cells with nFGFR1were counted in three ROIs in CZ (B1) and in three ROIs in the IZ (B2). Bars represent average total number of nFGFR1+ cells per image. (B1)—CZ—two-way ANOVA main effects of SZ F = 27.81 (p < 0.0001) and TNF F = 11.84 (p < 0.005); significant interaction between the SZ and TNF F = 30.48 (p < 0.0001). (B2)—IZ, main effect of SZ F = 10.71 (p < 0.005), TNF F = 0.641 (p < 0.05). LSD: *,***different from C p < 0.05, p < 0.0001.
Figure 7
Figure 7
Comparisons of the effects of TNF, SZ, and their combined effect on the organoid development. (A) Significant increase: +; significant decrease: −; significant differences: +/++,–/−−; non-significant trend (+), (−). The effects of TNF were either similar or less pronounced than of SZ. In some cellular changes, the effects of SZ+TNF were bigger than the individual factors. In one case, density of calretinin interneurons, the interaction between TNF and SZ reversed their individual effects (increases) to a marked loss of interneurons by SZ+TNF. (B) The relationship of INFS and altered neuronogenesis and oligodendrogenesis by TNF and in SZ. During brain development, the nuclear location of nFGFR1, which programs neuronal development, gradually increases as the proliferating neural progenitor cells (NPC) progress through neuroblasts to differentiating neurons that form cortical layers. The diverse SZ-linked mutations that disturb developmental signals and an increased TNF promote premature nuclear FGFR1 location leading to increased formation of neurons already within the VZ and IZ and reduced subcortical oligodendrocytic development. However, when cells reach the organoid surface, nFGFR1 is turned off, possibly by increased ECM signals (Stachowiak et al., 2017). The loss of nFGFR1 reduces formation of dense cortical neuronal networks, while increasing numbers of short calretinin interneurons, diminishing their preferred horizontal orientation, and promoting oligodendrocytes. The TNF-induced changes in C organoids are similar, although generally less pronounced than those occurring in SZ. On the other hand, the combined effect of SZ and TNF are often more pronounced or even opposite (loss of calretinin interneurons) from their individual effects, likely reflecting INFS dysregulation of TNF receptor signaling. Our findings suggest that the combined effects of the SZ genomic dysregulations and maternal immune activation (MIA) may increase the risk and/or severity of SZ.

Similar articles

Cited by

References

    1. Ajami A., Abedian F., Hamzeh Hosseini S., Akbarian E., Alizadeh-Navaei R., Taghipour M. (2014). Serum TNF-α, IL-10 and IL-2 in schizophrenic patients before and after treatment with risperidone and clozapine. Iran. J. Immunol. 11, 200–209. - PubMed
    1. Barinka F., Druga R., Marusic P., Krsek P., Zamecnik J. (2010). Calretinin immunoreactivity in focal cortical dysplasias and in non-malformed epileptic cortex. Epilepsy Res. 88, 76–86. 10.1016/j.eplepsyres.2009.09.021 - DOI - PubMed
    1. Brennand K., Savas J. N., Kim Y., Tran N., Simone A., Hashimoto-Torii K., et al. . (2015). Phenotypic differences in hiPSC NPCs derived from patients with schizophrenia. Mol. Psychiatry 20, 361–368. 10.1038/mp.2014.22 - DOI - PMC - PubMed
    1. Buka S. L., Tsuang M. T., Torrey E. F., Klebanoff M. A., Wagner R. L., Yolken R. H. (2001). Maternal cytokine levels during pregnancy and adult psychosis. Brain Behav. Immun. 15, 411–420. 10.1006/brbi.2001.0644 - DOI - PubMed
    1. Canetta S. E., Brown A. S. (2012). Prenatal infection, maternal immune activation, and risk for schizophrenia. Transl. Neurosci. 3, 320–327. 10.2478/s13380-012-0045-6 - DOI - PMC - PubMed