

Accelerating Onset of Puberty Through Modification of Early Life Nutrition Induces Modest but Persistent Changes in Bull Sperm DNA Methylation Profiles Post-puberty
- PMID: 33005172
- PMCID: PMC7479244
- DOI: 10.3389/fgene.2020.00945
Accelerating Onset of Puberty Through Modification of Early Life Nutrition Induces Modest but Persistent Changes in Bull Sperm DNA Methylation Profiles Post-puberty
Abstract
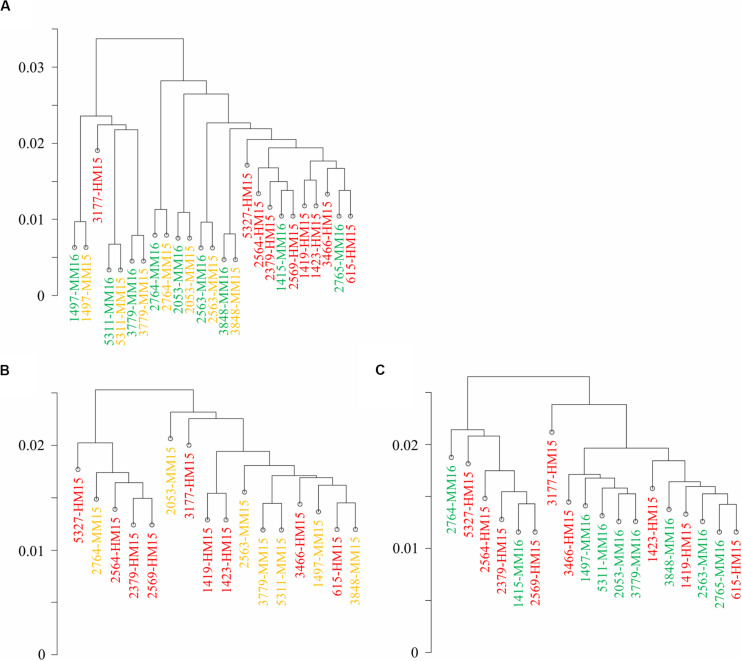
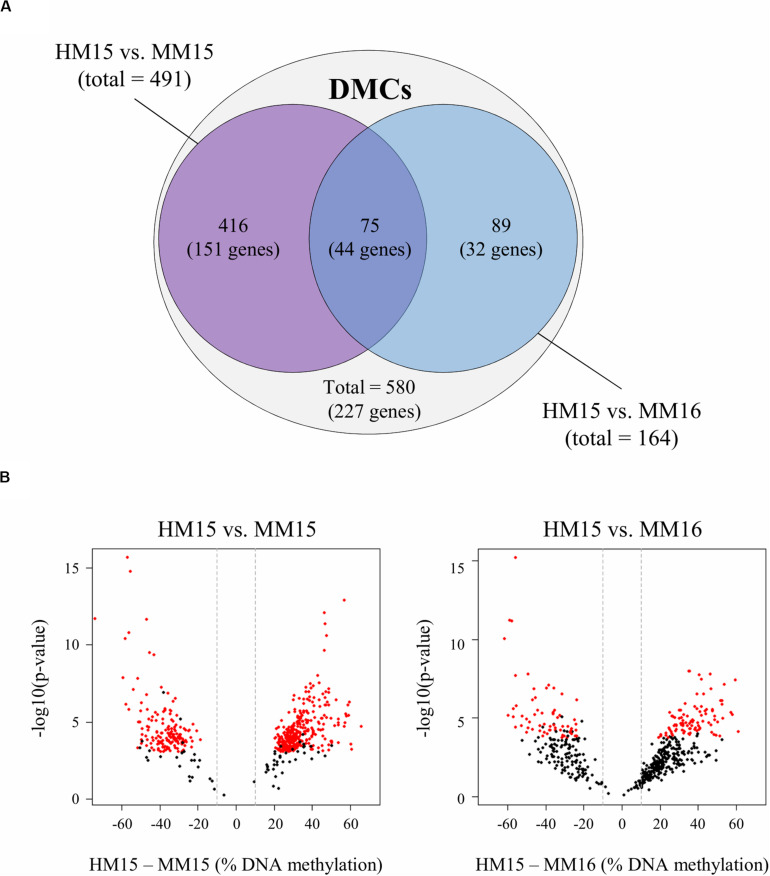
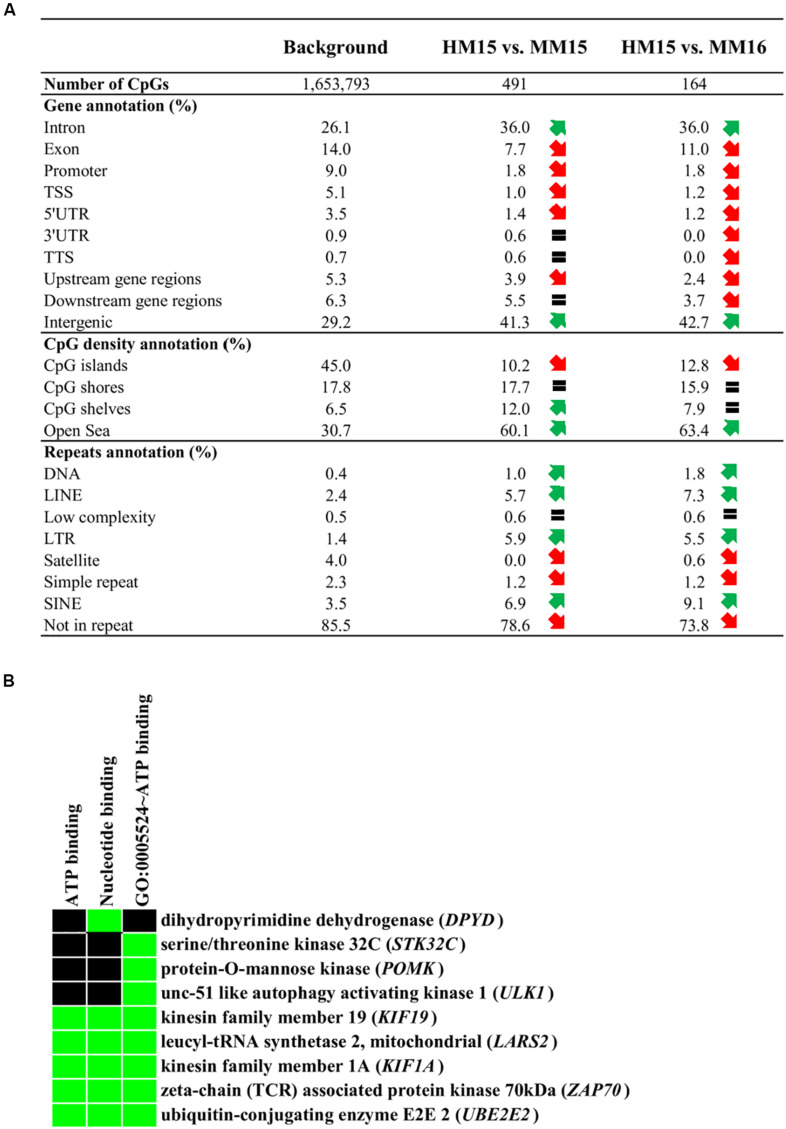
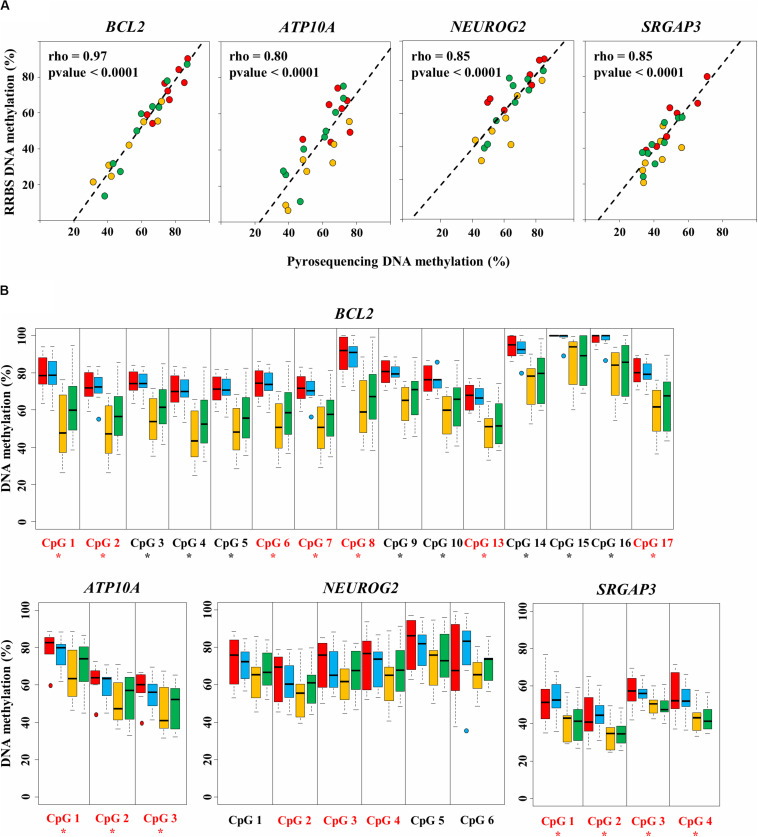
In humans and model species, alterations of sperm DNA methylation patterns have been reported in cases of spermatogenesis defects, male infertility and exposure to toxins or nutritional challenges, suggesting that a memory of environmental or physiological changes is recorded in the sperm methylome. The objective of this study was to ascertain if early life plane of nutrition could have a latent effect on DNA methylation patterns in sperm produced post-puberty. Holstein-Friesian calves were assigned to either a high (H) or moderate (M) plane of nutrition for the first 24 weeks of age, then reassigned to the M diet until puberty, resulting in HM and MM groups. Sperm DNA methylation patterns from contrasted subgroups of bulls in the HM (ejaculates recovered at 15 months of age; n = 9) and in the MM (15 and 16 months of age; n = 7 and 9, respectively) were obtained using Reduced Representation Bisulfite Sequencing. Both 15 and 16 months were selected in the MM treatment as these bulls reached puberty approximately 1 month after the HM bulls. Hierarchical clustering demonstrated that inter-individual variability unrelated to diet or age dominated DNA methylation profiles. While the comparison between 15 and 16 months of age revealed almost no change, 580 differentially methylated CpGs (DMCs) were identified between the HM and MM groups. Differentially methylated CpGs were mostly hypermethylated in the HM group, and enriched in endogenous retrotransposons, introns, intergenic regions, and shores and shelves of CpG islands. Furthermore, genes involved in spermatogenesis, Sertoli cell function, and the hypothalamic-pituitary-gonadal axis were targeted by differential methylation when HM and MM groups were compared at 15 months of age, reflecting the earlier timing of puberty onset in the HM bulls. In contrast, the genes still differentially methylated in MM bulls at 16 months of age were enriched for ATP-binding molecular function, suggesting that changes to the sperm methylome could persist even after the HM and MM bulls reached a similar level of sexual maturity. Together, results demonstrate that enhanced plane of nutrition in pre-pubertal calves associated with advanced puberty induced modest but persistent changes in sperm DNA methylation profiles after puberty.
Keywords: Bovine; DNA methylation; nutritional programming; puberty; spermatozoa.
Copyright © 2020 Perrier, Kenny, Chaulot-Talmon, Byrne, Sellem, Jouneau, Aubert-Frambourg, Schibler, Jammes, Lonergan, Fair and Kiefer.
Figures
Similar articles
-
Sperm DNA methylation patterns at discrete CpGs and genes involved in embryonic development are related to bull fertility.BMC Genomics. 2022 May 18;23(1):379. doi: 10.1186/s12864-022-08614-5. BMC Genomics. 2022. PMID: 35585482 Free PMC article.
-
Plane of nutrition before and after 6 months of age in Holstein-Friesian bulls: I. Effects on performance, body composition, age at puberty, and postpubertal semen production.J Dairy Sci. 2018 Apr;101(4):3447-3459. doi: 10.3168/jds.2017-13719. Epub 2018 Feb 7. J Dairy Sci. 2018. PMID: 29428748
-
Predicting male fertility from the sperm methylome: application to 120 bulls with hundreds of artificial insemination records.Clin Epigenetics. 2022 Apr 27;14(1):54. doi: 10.1186/s13148-022-01275-x. Clin Epigenetics. 2022. PMID: 35477426 Free PMC article.
-
Review: Ontology and endocrinology of the reproductive system of bulls from fetus to maturity.Animal. 2018 Jun;12(s1):s19-s26. doi: 10.1017/S1751731118000460. Epub 2018 Mar 19. Animal. 2018. PMID: 29551096 Review.
-
Review: The effect of nutrition on timing of pubertal onset and subsequent fertility in the bull.Animal. 2018 Jun;12(s1):s36-s44. doi: 10.1017/S1751731118000514. Epub 2018 Mar 20. Animal. 2018. PMID: 29554994 Review.
Cited by
-
Folate-mediated transgenerational inheritance of sperm DNA methylation patterns correlate with spinal axon regeneration.Epigenetics. 2024 Dec;19(1):2380930. doi: 10.1080/15592294.2024.2380930. Epub 2024 Jul 27. Epigenetics. 2024. PMID: 39066680 Free PMC article.
-
DNA methylation and gene expression changes in mouse mammary tissue during successive lactations: part I - the impact of inflammation.Epigenetics. 2023 Dec;18(1):2215633. doi: 10.1080/15592294.2023.2215633. Epigenetics. 2023. PMID: 37302099 Free PMC article.
-
Sperm DNA methylation patterns at discrete CpGs and genes involved in embryonic development are related to bull fertility.BMC Genomics. 2022 May 18;23(1):379. doi: 10.1186/s12864-022-08614-5. BMC Genomics. 2022. PMID: 35585482 Free PMC article.
-
DNA methylation and gene expression changes in mouse mammary tissue during successive lactations: part II - the impact of lactation rank.Epigenetics. 2023 Dec;18(1):2215620. doi: 10.1080/15592294.2023.2215620. Epigenetics. 2023. PMID: 37219968 Free PMC article.
-
The epigenome of male germ cells and the programming of phenotypes in cattle.Anim Front. 2021 Dec 17;11(6):28-38. doi: 10.1093/af/vfab062. eCollection 2021 Dec. Anim Front. 2021. PMID: 34934527 Free PMC article. No abstract available.
References
LinkOut - more resources
Full Text Sources