

Identification of KIAA0513 and Other Hub Genes Associated With Alzheimer Disease Using Weighted Gene Coexpression Network Analysis
- PMID: 33005179
- PMCID: PMC7483929
- DOI: 10.3389/fgene.2020.00981
Identification of KIAA0513 and Other Hub Genes Associated With Alzheimer Disease Using Weighted Gene Coexpression Network Analysis
Abstract
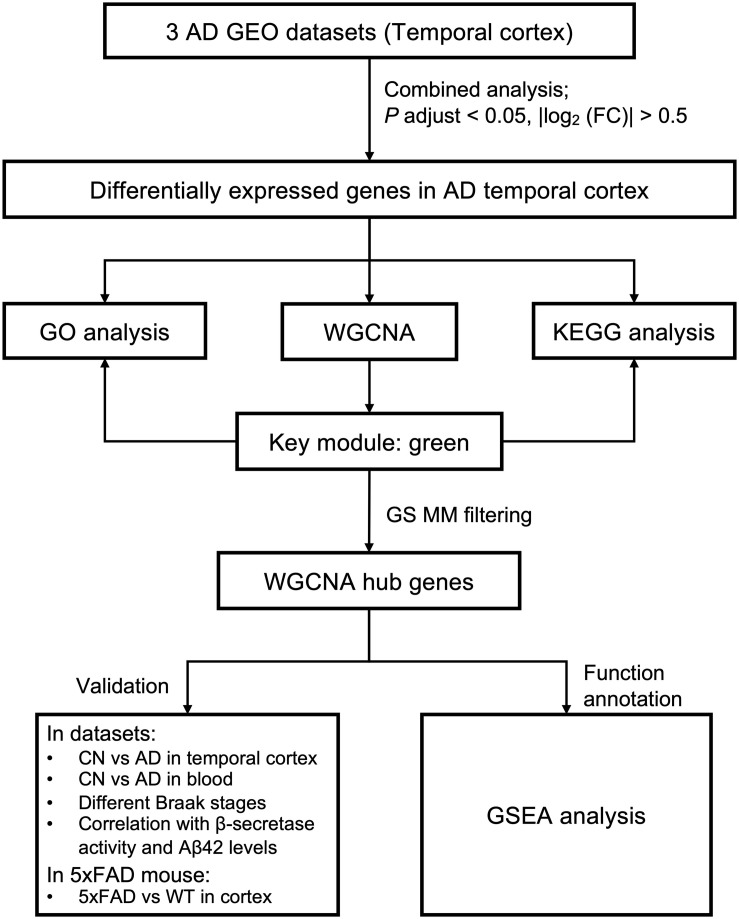
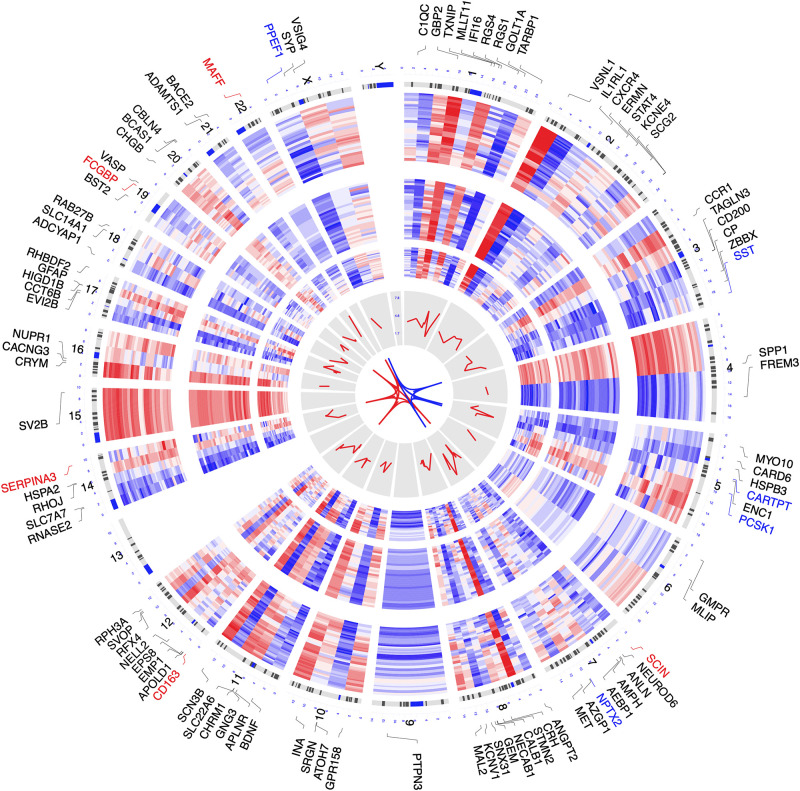
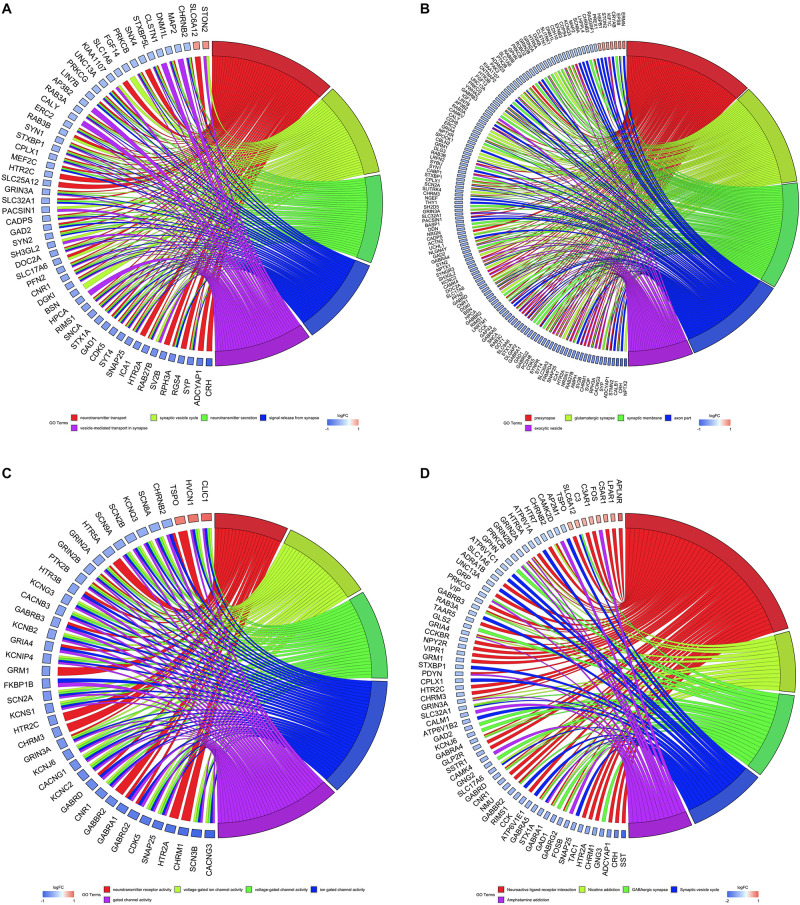
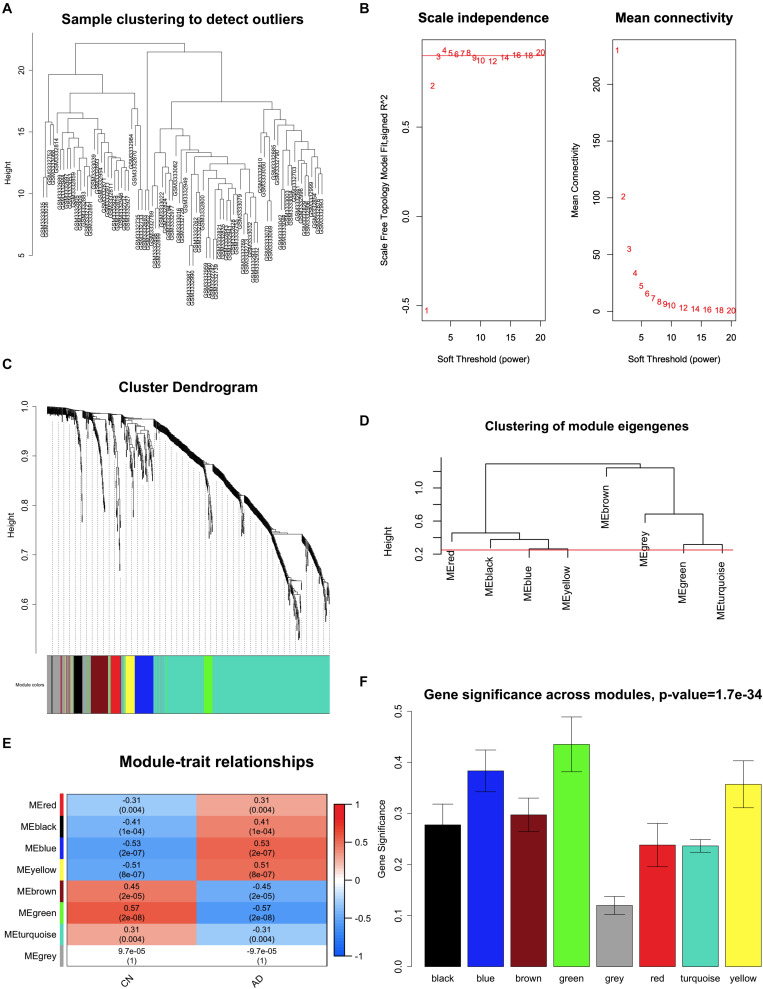
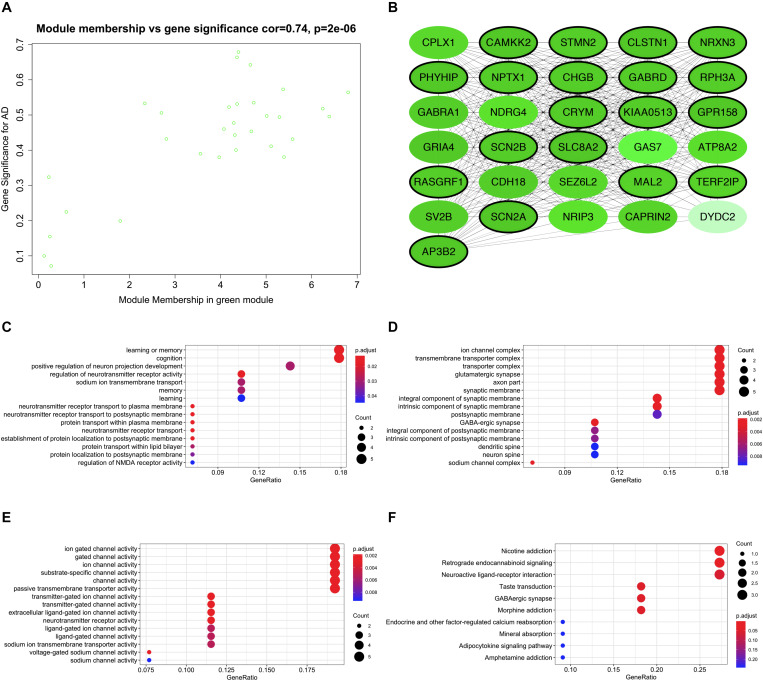
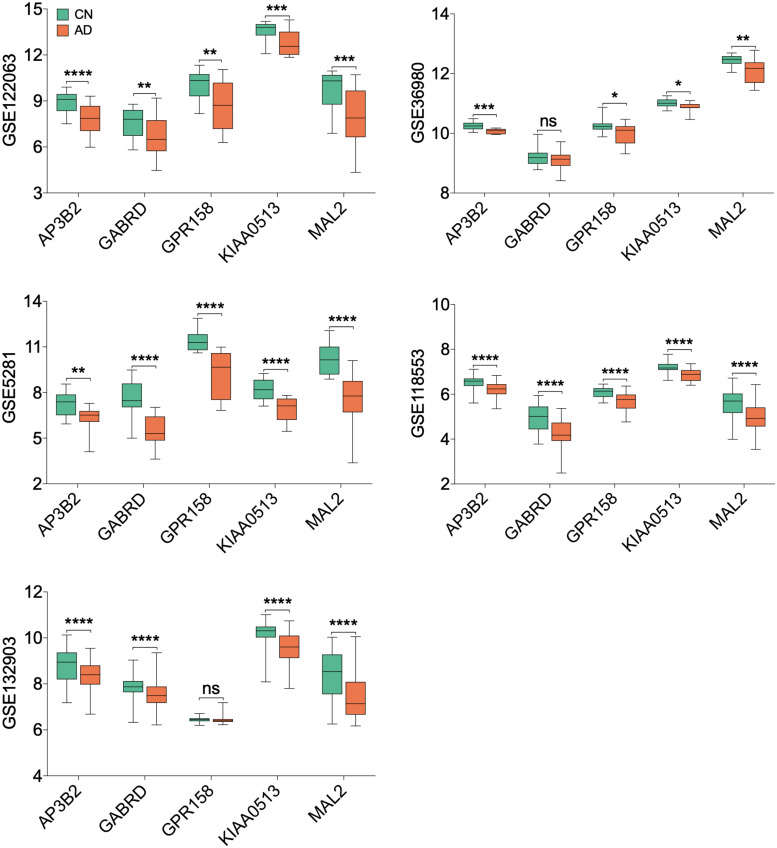
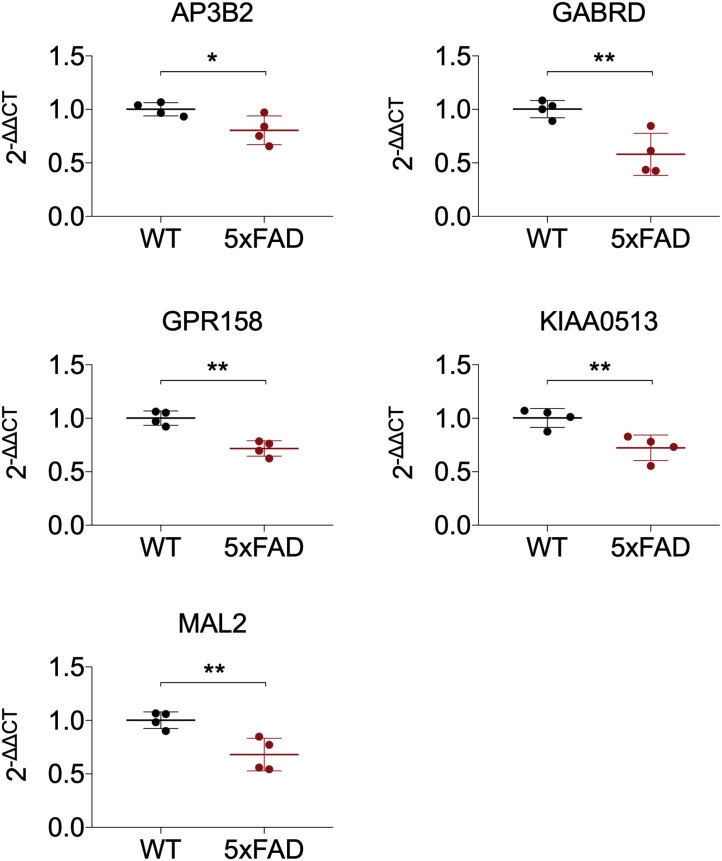
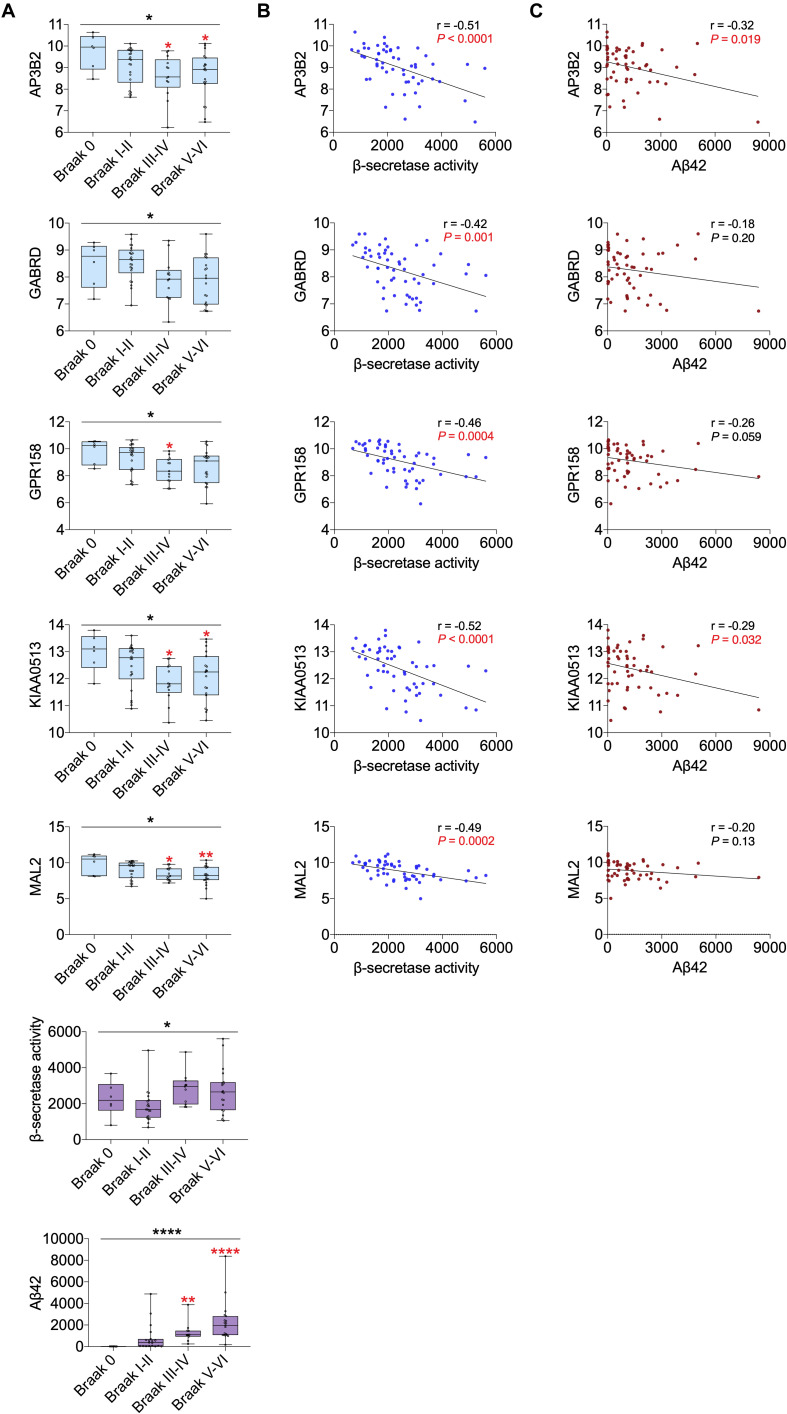
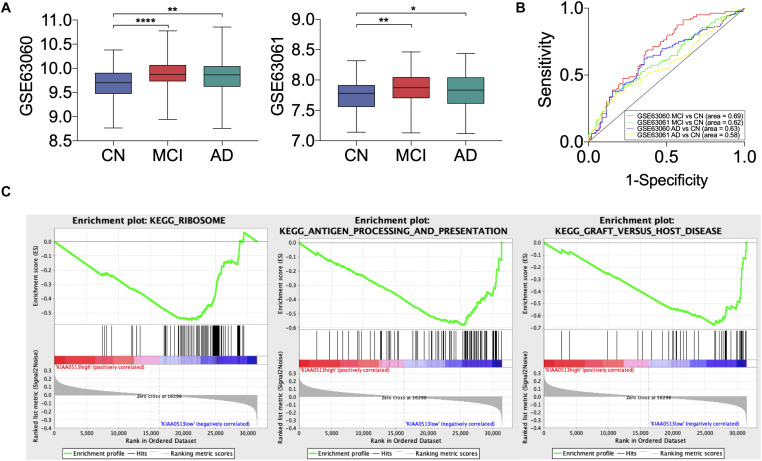
Alzheimer disease (AD) is the most common cause of dementia and creates a significant burden on society. As a result, the investigation of hub genes for the discovery of potential therapeutic targets and candidate biomarkers is warranted. In this study, we used the ComBat method to merge three gene expression datasets of AD from the Gene Expression Omnibus (GEO). During combined analysis, we identified 850 differentially expressed genes (DEGs) from the temporal cortex of AD and cognitively normal (CN) samples. We performed weighted gene coexpression network analysis to build gene coexpression networks incorporating these DEGs to identify key modules and hub genes. We found one module most strongly correlated with AD onset as the key module and 19 hub genes in the key module that were down-regulated in AD brains. According to Gene Ontology and Kyoto Encyclopedia of Genes and Genomes analyses, DEGs were mostly enriched in synapse function, and genes in the key module were mostly related to learning and memory. We selected five little-studied genes, AP3B2, GABRD, GPR158, KIAA0513, and MAL2, to validate their expression in AD mouse model by performing quantitative real-time polymerase chain reaction. We found that all of them were down-regulated in cortices of 8-month 5xFAD mice compared to those of wild-type mice. We then further investigated their correlations with β-secretase activity and Aβ42 levels in AD samples of different Braak stages. We found that all five hub genes had significant negative associations with β-secretase activity and that AP3B2 and KIAA0513 had significant negative associations with Aβ42 levels. We tested the differential expressions of the five hub genes in two AD GEO datasets from the blood and found that KIAA0513 was significantly up-regulated in patients with both mild cognitive impairment (MCI) and AD and was able to differentiate MCI and AD from CN in the two datasets. In conclusion, these five novel vulnerable genes were involved in AD progression, and KIAA0513 was a promising candidate biomarker for early diagnosis of AD.
Keywords: Alzheimer disease; dementia; gene expression; hub genes; weighted gene coexpression network analysis.
Copyright © 2020 Zhu, Jia, Li and Jia.
Figures
Similar articles
-
Identification of vital modules and genes associated with heart failure based on weighted gene coexpression network analysis.ESC Heart Fail. 2022 Apr;9(2):1370-1379. doi: 10.1002/ehf2.13827. Epub 2022 Feb 6. ESC Heart Fail. 2022. PMID: 35128826 Free PMC article.
-
Identification of four hub genes in venous thromboembolism via weighted gene coexpression network analysis.BMC Cardiovasc Disord. 2021 Dec 3;21(1):577. doi: 10.1186/s12872-021-02409-4. BMC Cardiovasc Disord. 2021. PMID: 34861826 Free PMC article.
-
Identification and validation of oxidative stress and immune-related hub genes in Alzheimer's disease through bioinformatics analysis.Sci Rep. 2023 Jan 12;13(1):657. doi: 10.1038/s41598-023-27977-7. Sci Rep. 2023. PMID: 36635346 Free PMC article.
-
Identification of Potential Diagnostic miRNAs Biomarkers for Alzheimer Disease Based on Weighted Gene Coexpression Network Analysis.World Neurosurg. 2021 Sep;153:e315-e328. doi: 10.1016/j.wneu.2021.06.118. Epub 2021 Jul 2. World Neurosurg. 2021. PMID: 34224891
-
Beyond modules and hubs: the potential of gene coexpression networks for investigating molecular mechanisms of complex brain disorders.Genes Brain Behav. 2014 Jan;13(1):13-24. doi: 10.1111/gbb.12106. Epub 2013 Dec 10. Genes Brain Behav. 2014. PMID: 24320616 Free PMC article. Review.
Cited by
-
A novel imprinted locus on bovine chromosome 18 homologous with human chromosome 16q24.1.Mol Genet Genomics. 2024 Mar 28;299(1):40. doi: 10.1007/s00438-024-02123-8. Mol Genet Genomics. 2024. PMID: 38546894
-
Posterior cingulate cortex reveals an expression profile of resilience in cognitively intact elders.Brain Commun. 2022 Jun 21;4(4):fcac162. doi: 10.1093/braincomms/fcac162. eCollection 2022. Brain Commun. 2022. PMID: 35813880 Free PMC article.
-
Identification of Diagnostic Markers Correlated With HIV+ Immune Non-response Based on Bioinformatics Analysis.Front Mol Biosci. 2021 Dec 22;8:809085. doi: 10.3389/fmolb.2021.809085. eCollection 2021. Front Mol Biosci. 2021. PMID: 35004856 Free PMC article.
-
Identification of metabolism-related subtypes and feature genes in Alzheimer's disease.J Transl Med. 2023 Sep 15;21(1):628. doi: 10.1186/s12967-023-04324-y. J Transl Med. 2023. PMID: 37715200 Free PMC article.
-
Maternal regulation of the vertebrate oocyte-to-embryo transition.PLoS Genet. 2024 Jul 25;20(7):e1011343. doi: 10.1371/journal.pgen.1011343. eCollection 2024 Jul. PLoS Genet. 2024. PMID: 39052672 Free PMC article.
References
LinkOut - more resources
Full Text Sources
Molecular Biology Databases
Research Materials