. 2020 Jun 2;13(9):2254-2263.
doi: 10.1111/eva.12998. eCollection 2020 Oct.

Gene flow as a simple cause for an excess of high-frequency-derived alleles

Affiliations

Gene flow as a simple cause for an excess of high-frequency-derived alleles

Nina Marchi et al. Evol Appl. .

Abstract

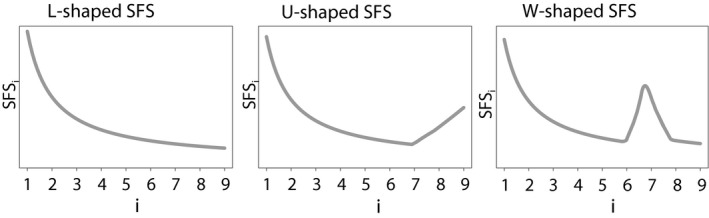
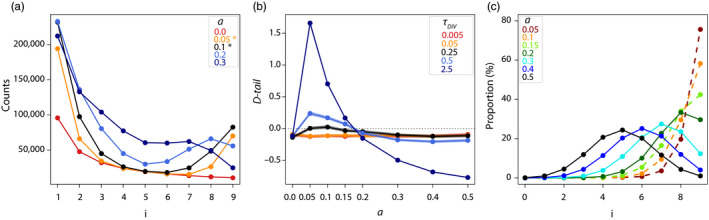
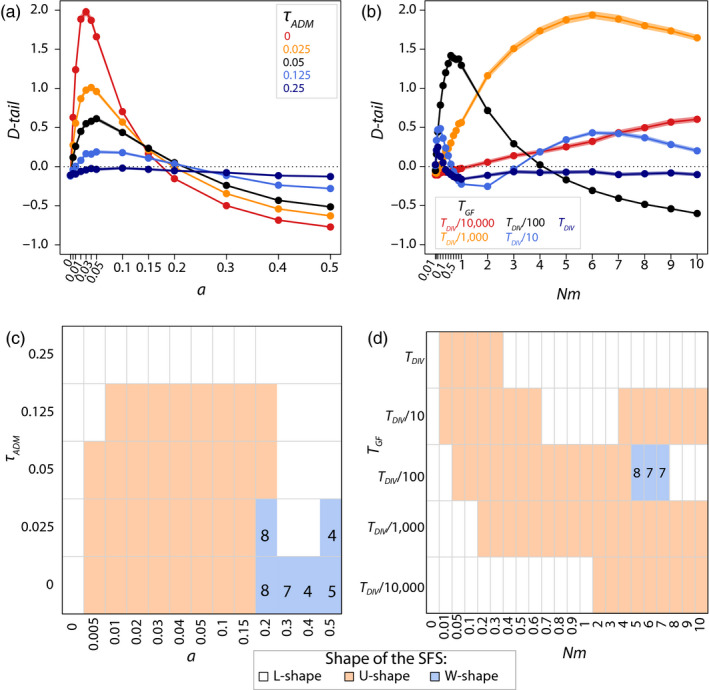
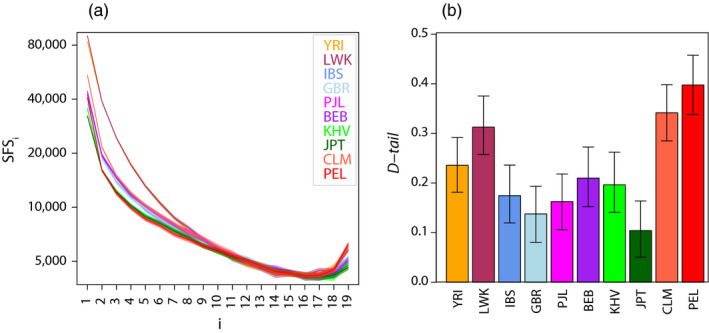
Most human populations exhibit an excess of high-frequency variants, leading to a U-shaped site-frequency spectrum (uSFS). This pattern has been generally interpreted as a signature of ongoing episodes of positive selection, or as evidence for a mis-assignment of ancestral/derived allelic states, but uSFS has also been observed in populations receiving gene flow from a ghost population, in structured populations, or after range expansions. In order to better explain the prevalence of high-frequency variants in humans and other populations, we describe here which patterns of gene flow and population demography can lead to uSFS by using extensive coalescent simulations. We find that uSFS can often be observed in a population if gene flow brings a few ancestral alleles from a well-differentiated population. Gene flow can either consist in single pulses of admixture or continuous immigration, but different demographic conditions are necessary to observe uSFS in these two scenarios. Indeed, an extremely low and recent gene flow is required in the case of single admixture events, while with continuous immigration, uSFS occurs only if gene flow started recently at a high rate or if it lasted for a long time at a low rate. Overall, we find that a neutral uSFS occurs under more restrictive conditions in populations having received single pulses of gene flow than in populations exposed to continuous gene flow. We also show that the uSFS observed in human populations from the 1000 Genomes Project can easily be explained by gene flow from surrounding populations without requiring past episodes of positive selection. These results imply that uSFS should be common in non-isolated populations, such as most wild or domesticated plants and animals.

Keywords: computer simulation; demographic analysis; gene flow; human genetics; human genome; natural selection; neutral evolution.


Conflict of interest statement

None declared.

Figures

FIGURE 1
FIGURE 1
Scenarios used to elucidate conditions under which gene flow leads to a uSFS. The populations have diverged T DIV generations ago from an ancestral population; their population sizes (N) are identical and constant over time. The results shown in the main text were obtained for a sampling size of 10 individuals and population sizes N = 4,000, but similar results were seen for a ten‐time larger size (N = 40,000) after appropriate rescaling of divergence time and migration rate (Supporting Information 1)
FIGURE 2
FIGURE 2
Schematic SFS shapes, for a sample of haploid size 10 where SFSi is the number of sites with a derived frequency i
FIGURE 3
FIGURE 3
Effect of the admixture rate and time of divergence on SFS properties, under an IA scenario for τADM=0 . (a) SFS, i.e. the number of sites with a derived frequency i, from = 10 haploid individuals for τDIV=2.5 and various admixture rates a; (b) D‐tail statistic for various divergence times τDIV ; (c) proportion of loci in the sampled population that were fixed for the derived allele before the admixture event and which show i derived alleles afterwards, when τDIV=2.5 . In panes a and b, dots and solid lines were obtained from simulated data sets, and semi‐transparent colours define 95% block‐bootstrap confidence intervals. Note that these confidence intervals are so small that they are barely visible on these figures. In pane c, dashed lines stand for uSFS and solid lines stand for W‐shaped SFS
FIGURE 4
FIGURE 4
Effect of rate and age of gene flow on SFS properties, for τDIV=2.5 and n = 10 under an IA model with different admixture times ( τADM ) and rates (a) (left panes) or under an II model with different gene flow onset (T GF) and number of migrants per generation (Nm) (right panes). D‐tail statistic (panes a and b) with dots and solid lines obtained from simulated data sets, and semi‐transparent colours defining the 95% confidence intervals calculated from the block‐bootstrap data sets (note that these confidence intervals are so small that they are barely visible on these figures); SFS shapes (panes c and d) with black numbers indicating the derived frequency i of the internal mode of W‐shaped SFS
FIGURE 5
FIGURE 5
Neutral SFS (a) and associated D‐tail statistics (b) observed in ten 1000G human samples. In pane a, SFSi is the number of sites with a derived frequency i. In pane b, the whiskers indicate limits of 95% block‐bootstrap confidence intervals

Similar articles

Cited by

References

    1. Akashi, H. , & Schaeffer, S. W. (1997). Natural selection and the frequency distributions of “silent” DNA polymorphism in Drosophila. Genetics, 146(1), 295–307. - PMC - PubMed
    1. Alcala, N. , Jensen, J. D. , Telenti, A. , & Vuilleumier, S. (2016). The genomic signature of population reconnection following isolation: From theory to HIV. G3: Genes, Genomes Genetics, 6(1), 107–120. 10.1534/g3.115.024208 - DOI - PMC - PubMed
    1. Alcala, N. , Vuilleumier, S. (2014). Turnover and accumulation of genetic diversity across large time‐scale cycles of isolation and connection of populations. Proceedings of the Royal Society B: Biological Sciences, 281, (1794), 20141369 10.1098/rspb.2014.1369 - DOI - PMC - PubMed
    1. Andolfatto, P. , & Przeworski, M. (2001). Regions of lower crossing over harbor more rare variants in African populations of Drosophila melanogaster. Genetics, 158(2), 657–665. - PMC - PubMed
    1. Árnason, E. , Halldórsdóttir, K. (2015). Nucleotide variation and balancing selection at the Ckma gene in Atlantic cod: analysis with multiple merger coalescent models. PeerJ, 3, e786 10.7717/peerj.786 - DOI - PMC - PubMed

LinkOut - more resources