. 2020 Jun 22;13(9):2333-2356.
doi: 10.1111/eva.13028. eCollection 2020 Oct.

Adaptive genetic potential and plasticity of trait variation in the foundation prairie grass Andropogon gerardii across the US Great Plains' climate gradient: Implications for climate change and restoration

Affiliations

Adaptive genetic potential and plasticity of trait variation in the foundation prairie grass Andropogon gerardii across the US Great Plains' climate gradient: Implications for climate change and restoration

Matthew Galliart et al. Evol Appl. .

Abstract

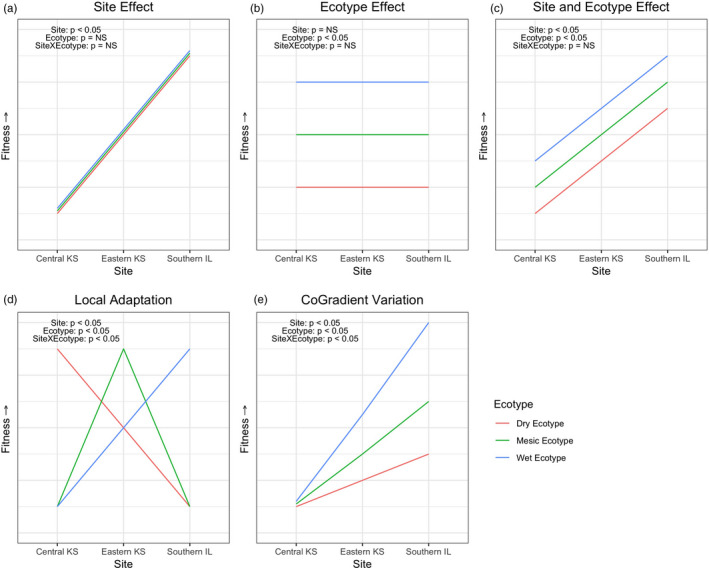
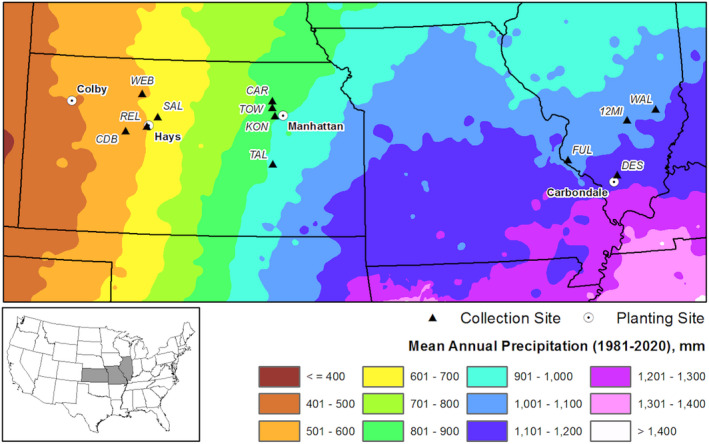
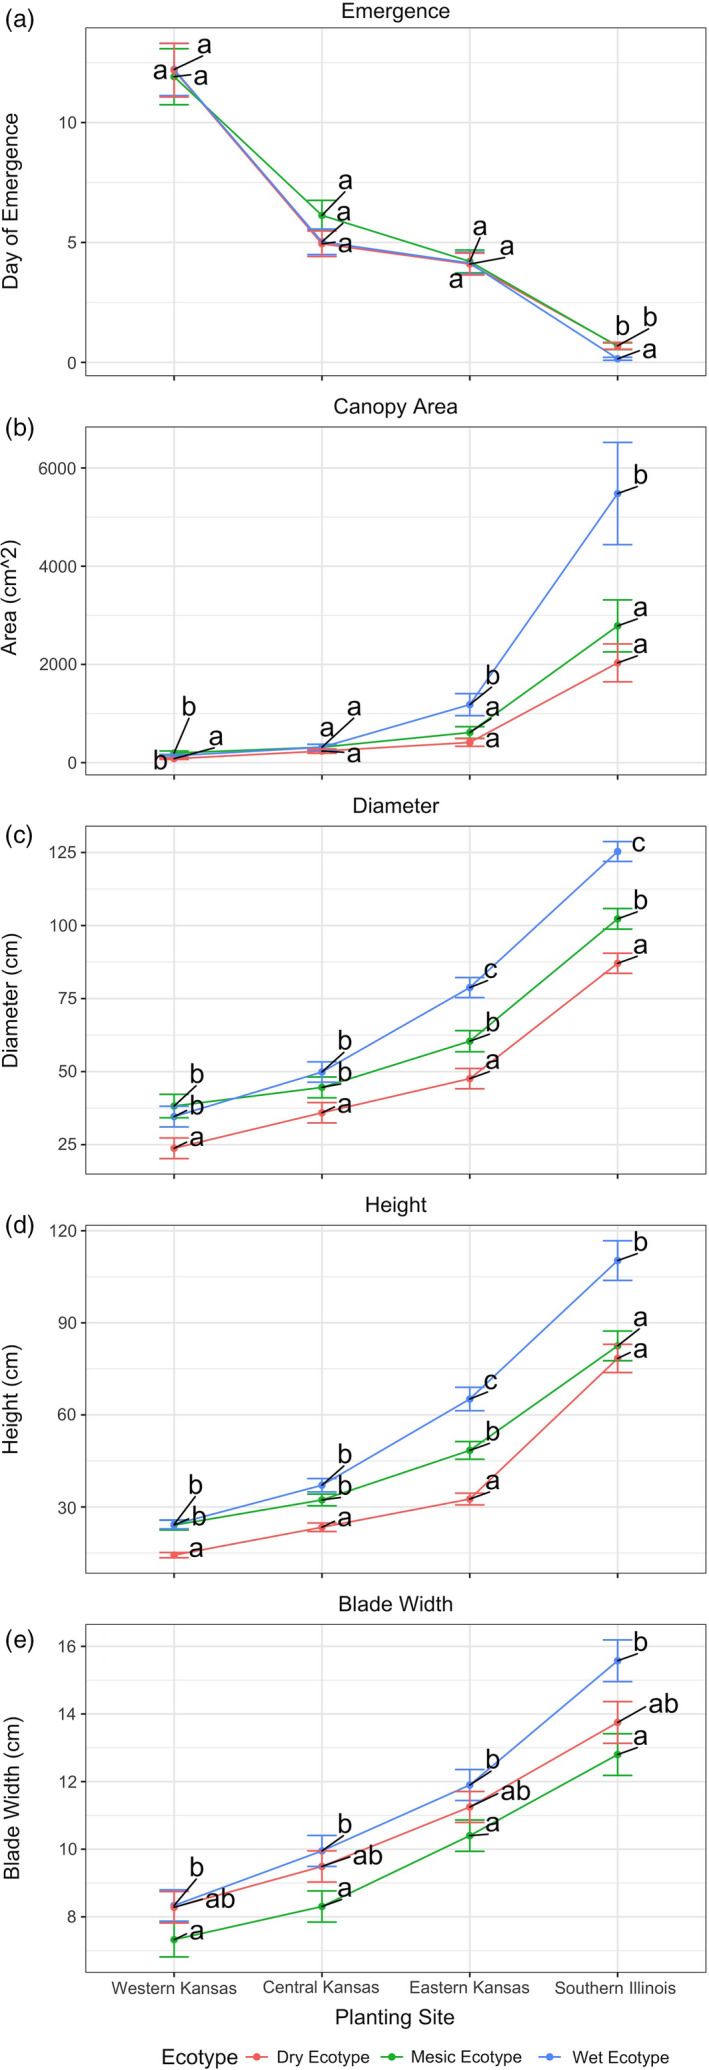
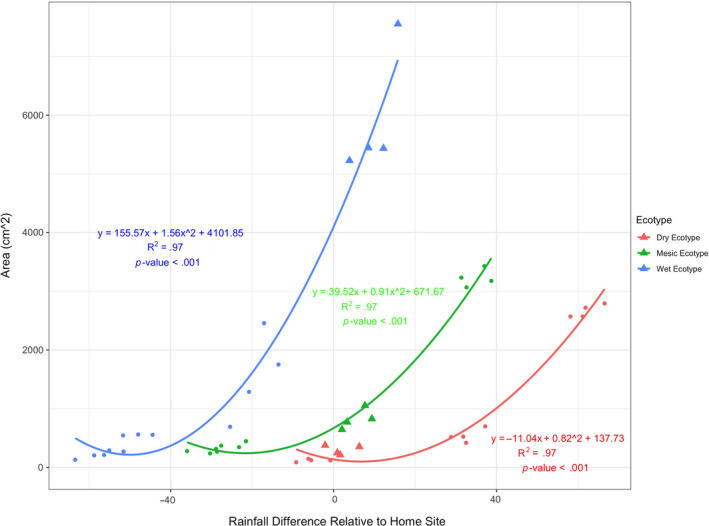
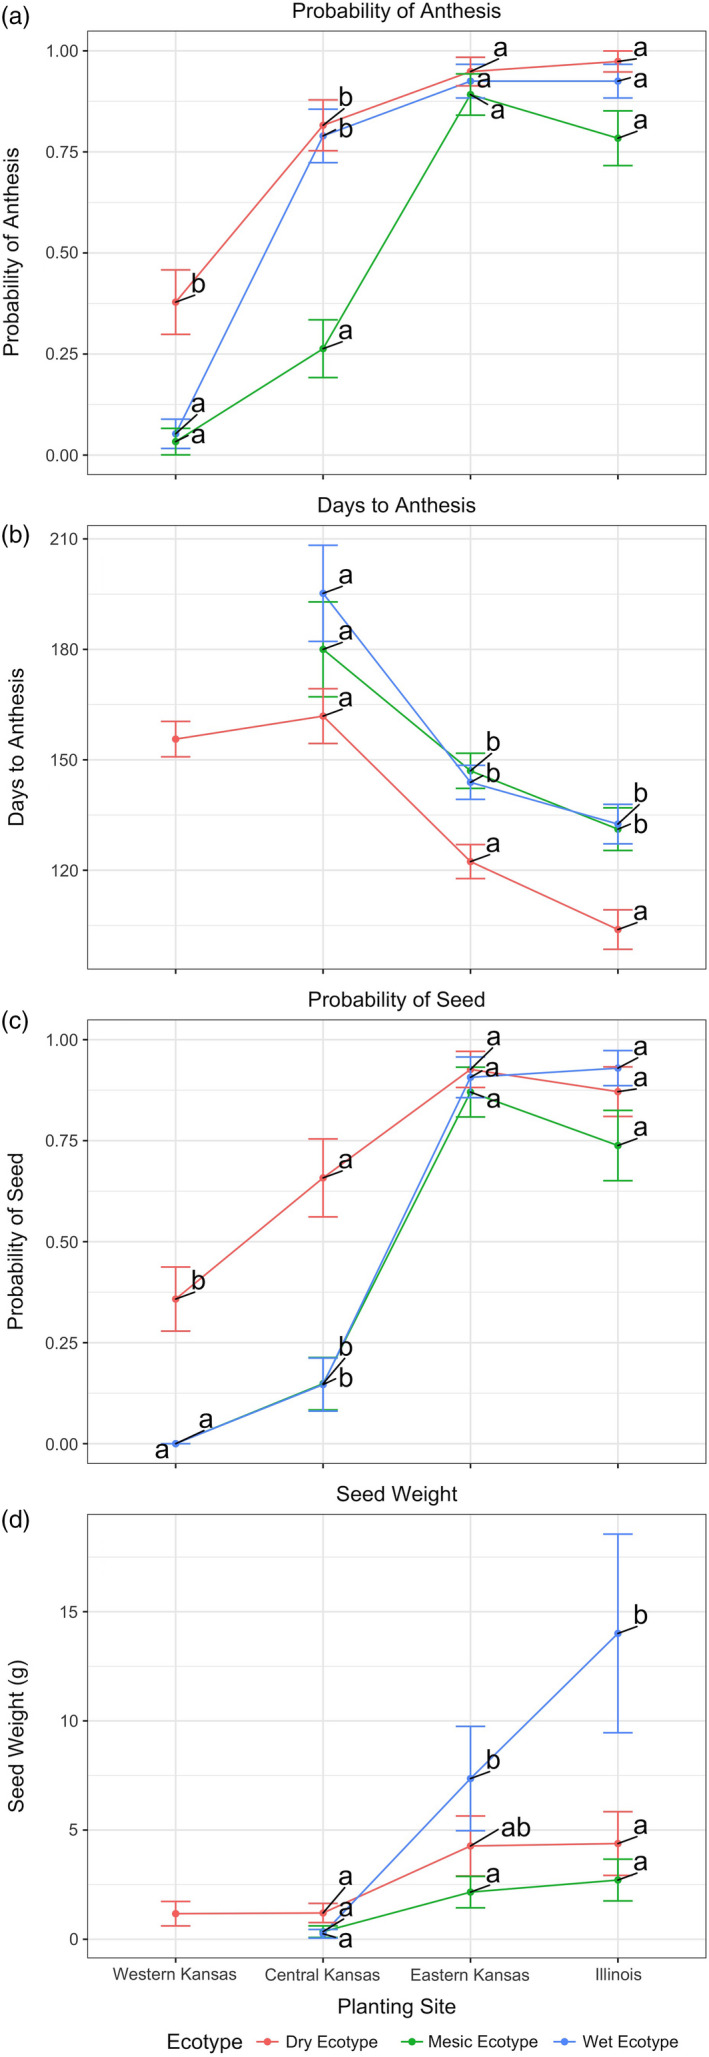
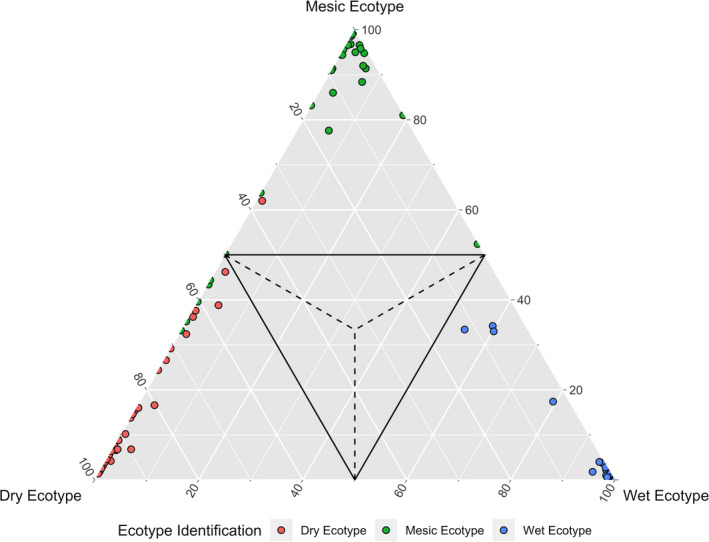
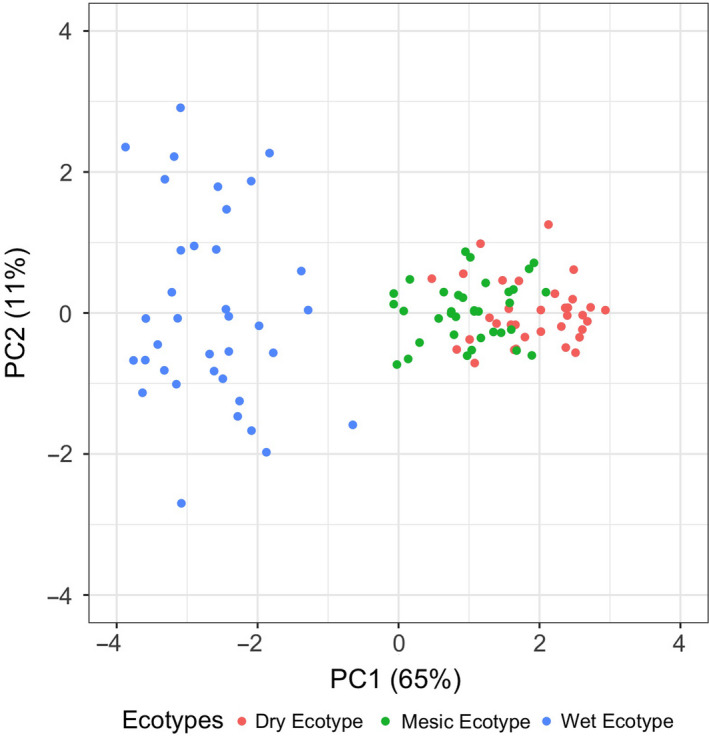
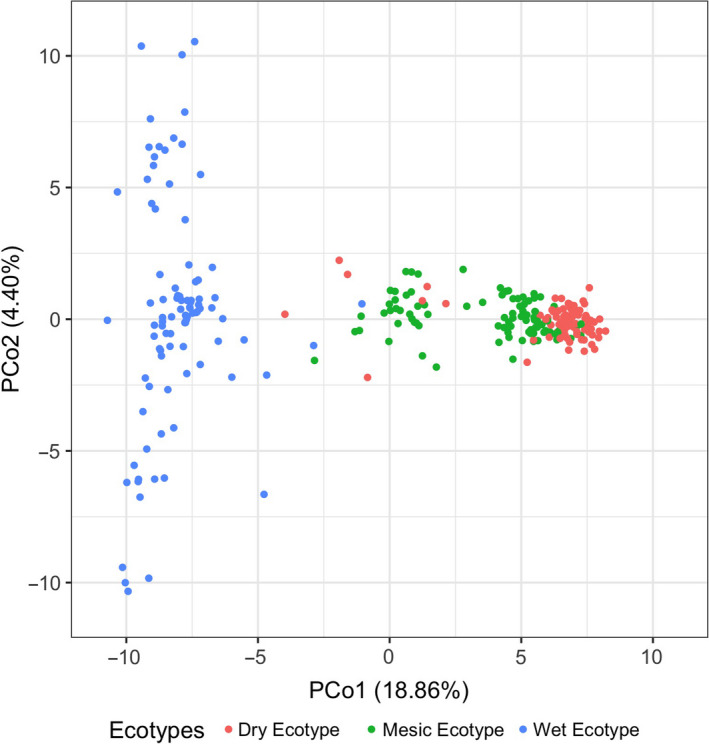
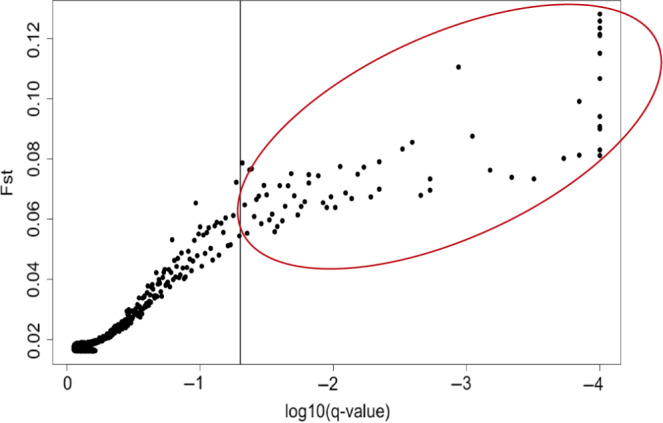
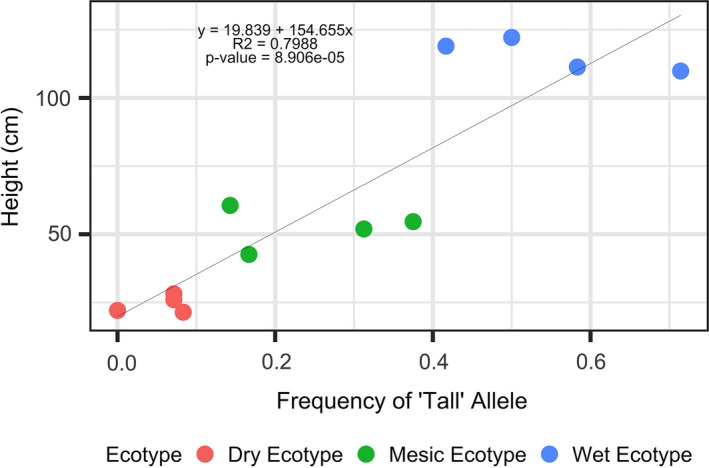
Plant response to climate depends on a species' adaptive potential. To address this, we used reciprocal gardens to detect genetic and environmental plasticity effects on phenotypic variation and combined with genetic analyses. Four reciprocal garden sites were planted with three regional ecotypes of Andropogon gerardii, a dominant Great Plains prairie grass, using dry, mesic, and wet ecotypes originating from western KS to Illinois that span 500-1,200 mm rainfall/year. We aimed to answer: (a) What is the relative role of genetic constraints and phenotypic plasticity in controlling phenotypes? (b) When planted in the homesite, is there a trait syndrome for each ecotype? (c) How are genotypes and phenotypes structured by climate? and (d) What are implications of these results for response to climate change and use of ecotypes for restoration? Surprisingly, we did not detect consistent local adaptation. Rather, we detected co-gradient variation primarily for most vegetative responses. All ecotypes were stunted in western KS. Eastward, the wet ecotype was increasingly robust relative to other ecotypes. In contrast, fitness showed evidence for local adaptation in wet and dry ecotypes with wet and mesic ecotypes producing little seed in western KS. Earlier flowering time in the dry ecotype suggests adaptation to end of season drought. Considering ecotype traits in homesite, the dry ecotype was characterized by reduced canopy area and diameter, short plants, and low vegetative biomass and putatively adapted to water limitation. The wet ecotype was robust, tall with high biomass, and wide leaves putatively adapted for the highly competitive, light-limited Eastern Great Plains. Ecotype differentiation was supported by random forest classification and PCA. We detected genetic differentiation and outlier genes associated with primarily precipitation. We identified candidate gene GA1 for which allele frequency associated with plant height. Sourcing of climate adapted ecotypes should be considered for restoration.

Keywords: Great Plains grasslands; drought; ecotypic variation; genetic differentiation; genome–environment interaction; local adaptation; phenotypic variation; precipitation; reciprocal gardens.


Conflict of interest statement

None declared.

Figures

FIGURE 1
FIGURE 1
(a) Main effect of site S only, (b) main effect of ecotype E only, (c) main effects of site S and ecotype E, no interaction, (d) local adaptation S × E, (e) co‐gradient variation. Illustration of plausible phenotypic patterns of S and E effects, represented by ecotypes across an environmental gradient
FIGURE 2
FIGURE 2
Regional map depicting the location of reciprocal gardens planting sites (white circles) and seed collections sites (black triangles) across the US Great Plains. For prairie population acronyms, see Table S1. The planting site in Western Kansas (Colby, Kansas) was the satellite reciprocal site to test the range of tolerance for big bluestem. Note that seeds were not collected in Colby
FIGURE 3
FIGURE 3
Least square mean estimates (±SE) of vegetative morphological traits for ecotypes (dry, mesic, wet) across reciprocal garden planting sites in Western Ks (Colby KS), Central KS (Hays KS), Eastern KS (Manhattan KS), and Illinois (Carbondale Illinois). (a) Days at emergence, (b) canopy area (cm2), (c) plant diameter (cm), (d) plant height (cm), and (e) blade width (mm). Sites with different letters indicate significant differences within a site. Biomass is included in Figure S4
FIGURE 4
FIGURE 4
Fitted quadratic regression lines for canopy area (cm2) relative to difference in rainfall at the homesite for wet, mesic, and dry ecotypes, compared to rainfall at population source of origin. Note that the homesite is depicted by triangles
FIGURE 5
FIGURE 5
Least square mean estimates (±SE) of reproductive fitness traits for ecotypes (dry, mesic, wet) across reciprocal garden planting sites in Western KS (Colby KS), Central KS (Hays KS), Eastern KS (Manhattan KS), and Illinois (Carbondale Illinois). (a) Probability of anthesis, (b) days to anthesis, (c) probability of seed production, (d) seed mass. Sites with different letters indicate significant differences within a site
FIGURE 6
FIGURE 6
Classification plot obtained from the random forest analyses showing training/validation triangle with percent votes of the individuals from the 10 fold‐cross validation from random forest training and validation set. Each point is an individual. Dry ecotype is denoted in red, mesic ecotype is denoted in green, and wet ecotype is denoted in blue. Individuals within the solid lines indicate individuals with poor discernment of the algorithm (<50% votes). Plants falling outside of the solid lines are clearly discerned; that is, more than 50% of votes from the validation were for that ecotype
FIGURE 7
FIGURE 7
Scatter plot of the first two principal component scores for vegetative and reproductive traits corresponding to 106 plants corresponding to ecotypes growing in their homesite. Abbreviations and symbols correspond to regional ecotypes (Red = dry ecotype from Central Kansas; Green = mesic ecotype from Eastern Kansas; Blue = wet ecotype from Illinois). Mesic and dry ecotypes in their home environments were differentiated from the wet ecotype in Illinois prairies mostly along the first PCA axis
FIGURE 8
FIGURE 8
Scatter plot of the first two principal coordinates scores for allelic frequency of 4,641 SNP marker loci. There were 314 plants genotyped (110 dry, 106 mesic, and 98 wet ecotype). Abbreviations and symbols correspond to regional ecotypes (Red = dry ecotype from Central Kansas; Green = mesic ecotype from Eastern Kansas; Blue = wet ecotype from Illinois). Mesic and dry ecotypes in their home environments were differentiated from the wet ecotype in Illinois prairies mostly along the first axis
FIGURE 9
FIGURE 9
Scatter plot of Fst values as a function of statistical significance of SNP markers, as obtained using Bayescan v2.1. Points to the right of the vertical line indicates 64 markers with significant evidence of divergent selection among populations based on a q‐value (i.e., p‐value adjusted for FDR) lower than .05
FIGURE 10
FIGURE 10
Scatter plot and fitted regression line depicting average population plant height as a function of allelic frequency for the “tall” allele of the GA1 outlier. Each population is color‐coded by ecotype. Red = dry ecotype, green = mesic ecotype, blue = wet ecotype. The four points per ecotype represent the four source populations

References

    1. Ackerly, D. D. , Dudley, S. A. , Sultan, S. E. , Schmitt, J. , Coleman, J. S. , Linder, C. R. , … Lechowicz, M. J. (2000). The evolution of plant ecophysiological traits: recent advances and future directions. BioScience, 50(11), 979–995. 10.1641/0006-3568(2000)050[0979:TEOPET]2.0.CO;2 - DOI
    1. Aitken, S. N. , & Whitlock, M. C. (2013). Assisted gene flow to facilitate local adaptation to climate change. Annual Review of Ecology, Evolution, and Systematics, 44, 367–388. 10.1146/annurev-ecolsys-110512-135747 - DOI
    1. Altman, N. , & Krzywinski, M. (2017). Points of Significance: Ensemble methods: bagging and random forests. Nature Methods, 14(10), 933–934. 10.1038/nmeth.4438 - DOI
    1. Anderson, J. T. , Eckhart, V. M. , & Geber, M. A. (2015). Experimental studies of adaptation in Clarkia xantiana. III. Phenotypic selection across a subspecies border. Evolution, 69(9), 2249–2261. - PubMed
    1. Anderson, J. T. , & Gezon, Z. J. (2015). Plasticity in functional traits in the context of climate change: A case study of the subalpine forb Boechera stricta (Brassicaceae). Global Change Biology, 21(4), 1689–1703. - PubMed

LinkOut - more resources