Contrasted patterns of local adaptation to climate change across the range of an evergreen oak, Quercus aquifolioides
- PMID: 33005228
- PMCID: PMC7513717
- DOI: 10.1111/eva.13030
Contrasted patterns of local adaptation to climate change across the range of an evergreen oak, Quercus aquifolioides
Abstract
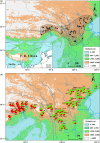
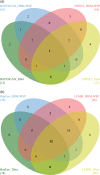
Long-lived tree species are genetically differentiated and locally adapted with respect to fitness-related traits, but the genetic basis of local adaptation remains largely unresolved. Recent advances in population genetics and landscape genomic analyses enable identification of putative adaptive loci and specific selective pressures acting on local adaptation. Here, we sampled 60 evergreen oak (Quercus aquifolioides) populations throughout the species' range and pool-sequenced 587 individuals at drought-stress candidate genes. We analyzed patterns of genetic diversity and differentiation for 381 single nucleotide polymorphisms (SNPs) from 65 candidate genes and eight microsatellites. Outlier loci were identified by genetic differentiation analysis and genome-environment associations. The response pattern of genetic variation to environmental gradient was assessed by linear isolation-by-distance/environment tests, redundancy analysis, and nonlinear methods. SNPs and microsatellites revealed two genetic lineages: Tibet and Hengduan Mountains-Western Sichuan Plateau (HDM-WSP), with reduced genetic diversity in Tibet lineage. More outlier loci were detected in HDM-WSP lineage than Tibet lineage. Among these, three SNPs in two genes responded to dry season precipitation in the HDM-WSP lineage but not in Tibet. By contrast, genetic variation in the Tibet lineage was related to geographic distance instead of the environment. Furthermore, risk of nonadaptedness (RONA) analyses suggested HDM-WSP lineage will have a better capacity to adapt in the predicted future climate compared with the Tibet lineage. We detected genetic imprints consistent with natural selection and molecular adaptation to drought on the Qinghai-Tibet Plateau (QTP) over a range of long-lived and widely distributed oak species in a changing environment. Our results suggest that different within-species adaptation processes occur in species occurring in heterogeneous environments.
Keywords: Fagaceae; Hengduan Mountains; Quercus; Tibet; adaptation; genomic divergence; landscape genomics.
© 2020 The Authors. Evolutionary Applications published by John Wiley & Sons Ltd.
Conflict of interest statement
None declared.
Figures


Similar articles
-
Population and Landscape Genetics Provide Insights Into Species Conservation of Two Evergreen Oaks in Qinghai-Tibet Plateau and Adjacent Regions.Front Plant Sci. 2022 May 19;13:858526. doi: 10.3389/fpls.2022.858526. eCollection 2022. Front Plant Sci. 2022. PMID: 35665182 Free PMC article.
-
Landscape genomic analysis of candidate genes for climate adaptation in a California endemic oak, Quercus lobata.Am J Bot. 2016 Jan;103(1):33-46. doi: 10.3732/ajb.1500162. Epub 2016 Jan 7. Am J Bot. 2016. PMID: 26744482
-
Leaf ecological stoichiometry and anatomical structural adaptation mechanisms of Quercus sect. Heterobalanus in southeastern Qinghai-Tibet Plateau.BMC Plant Biol. 2024 Apr 24;24(1):325. doi: 10.1186/s12870-024-05010-x. BMC Plant Biol. 2024. PMID: 38658813 Free PMC article.
-
Species divergence with gene flow and hybrid speciation on the Qinghai-Tibet Plateau.New Phytol. 2022 Apr;234(2):392-404. doi: 10.1111/nph.17956. Epub 2022 Jan 30. New Phytol. 2022. PMID: 35020198 Review.
-
Genomic Studies of Local Adaptation in Natural Plant Populations.J Hered. 2017 Dec 21;109(1):3-15. doi: 10.1093/jhered/esx091. J Hered. 2017. PMID: 29045754 Review.
Cited by
-
Germplasm Resources of Oaks (Quercus L.) in China: Utilization and Prospects.Biology (Basel). 2022 Dec 31;12(1):76. doi: 10.3390/biology12010076. Biology (Basel). 2022. PMID: 36671768 Free PMC article. Review.
-
Leaf traits divergence and correlations of woody plants among the three plant functional types on the eastern Qinghai-Tibetan Plateau, China.Front Plant Sci. 2023 Apr 3;14:1128227. doi: 10.3389/fpls.2023.1128227. eCollection 2023. Front Plant Sci. 2023. PMID: 37077644 Free PMC article.
-
Climate change vulnerability and conservation strategies for tertiary relict tree species: Insights from landscape genomics of Taxus cuspidata.Evol Appl. 2024 Sep 4;17(9):e13686. doi: 10.1111/eva.13686. eCollection 2024 Sep. Evol Appl. 2024. PMID: 39247090 Free PMC article.
-
Genetic admixture drives climate adaptation in the bank vole.Commun Biol. 2024 Jul 15;7(1):863. doi: 10.1038/s42003-024-06549-z. Commun Biol. 2024. PMID: 39009753 Free PMC article.
-
Phylogeographic analysis reveals extensive genetic variation of native grass Elymus nutans (Poaceae) on the Qinghai-Tibetan plateau.Front Plant Sci. 2024 Mar 11;15:1349641. doi: 10.3389/fpls.2024.1349641. eCollection 2024. Front Plant Sci. 2024. PMID: 38529066 Free PMC article.
References
-
- Beaumont, M. A. , & Nichols, R. A. (1996). Evaluating loci for use in the genetic analysis of population structure. Proceedings of the Royal Society of London. Series B: Biological Sciences, 263, 1619–1626. 10.1098/rspb.1996.0237 - DOI
Associated data
LinkOut - more resources
Full Text Sources

