. 2020 Sep 2;10(18):9740-9775.
doi: 10.1002/ece3.6611. eCollection 2020 Sep.

Evolutionary trajectory of fish Piscine novirhabdovirus (=Viral Hemorrhagic Septicemia Virus) across its Laurentian Great Lakes history: Spatial and temporal diversification

Affiliations

Evolutionary trajectory of fish Piscine novirhabdovirus (=Viral Hemorrhagic Septicemia Virus) across its Laurentian Great Lakes history: Spatial and temporal diversification

Carol A Stepien et al. Ecol Evol. .

Abstract

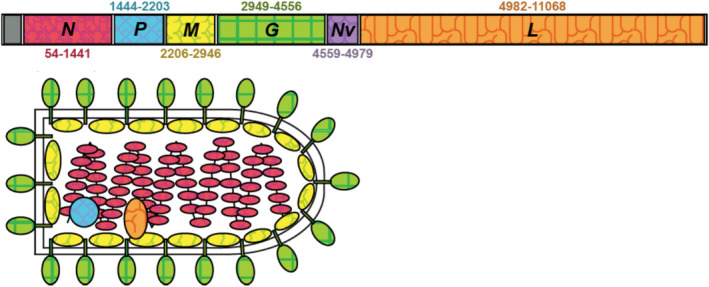
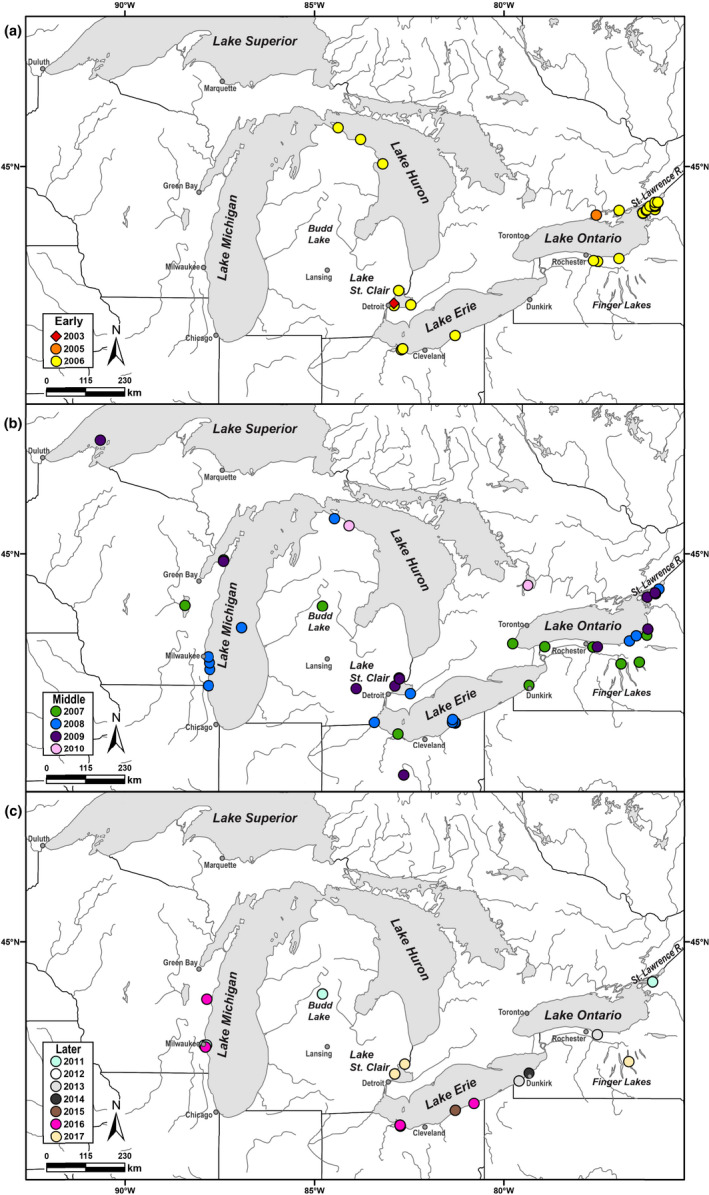
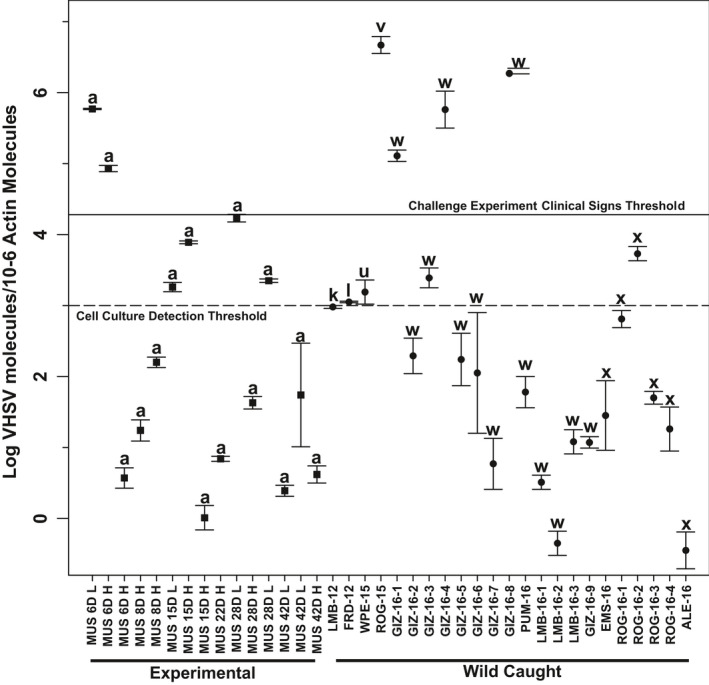
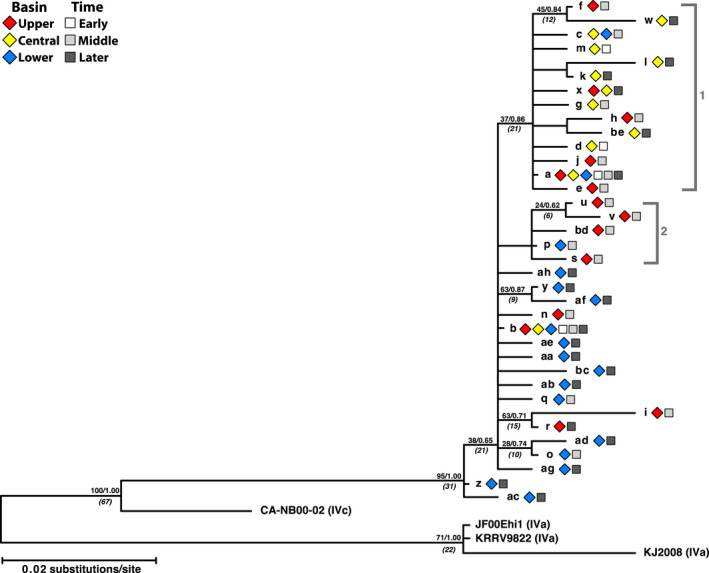
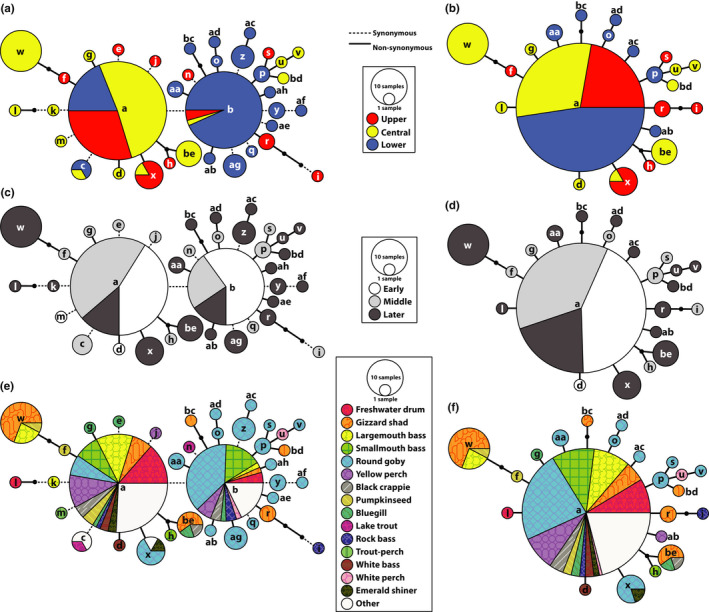
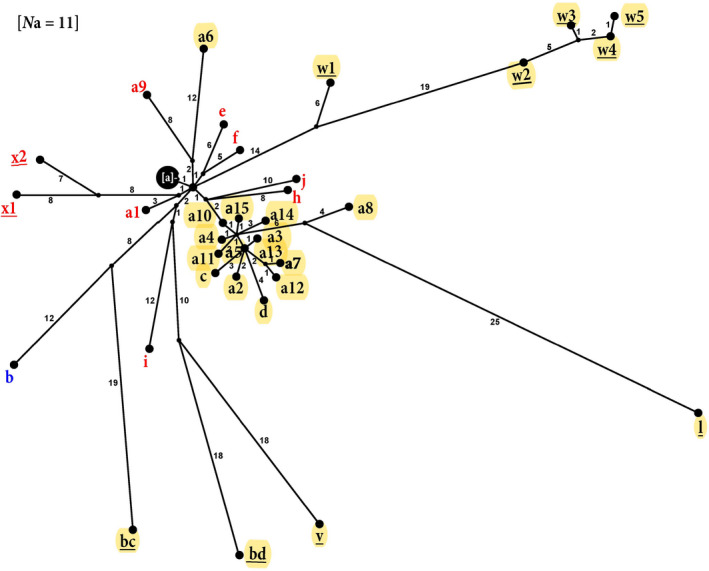
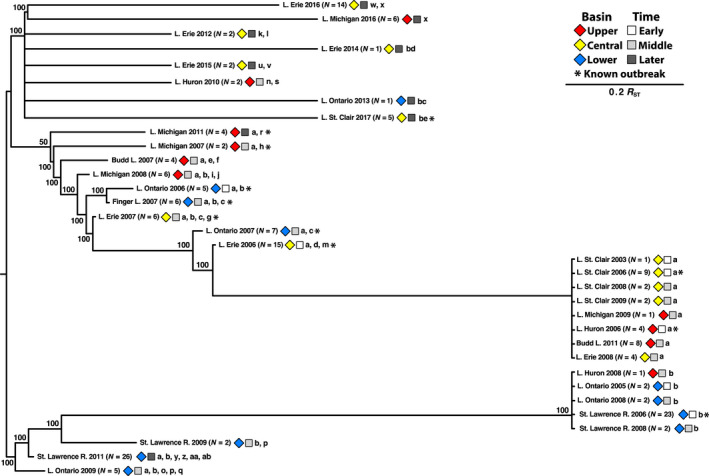
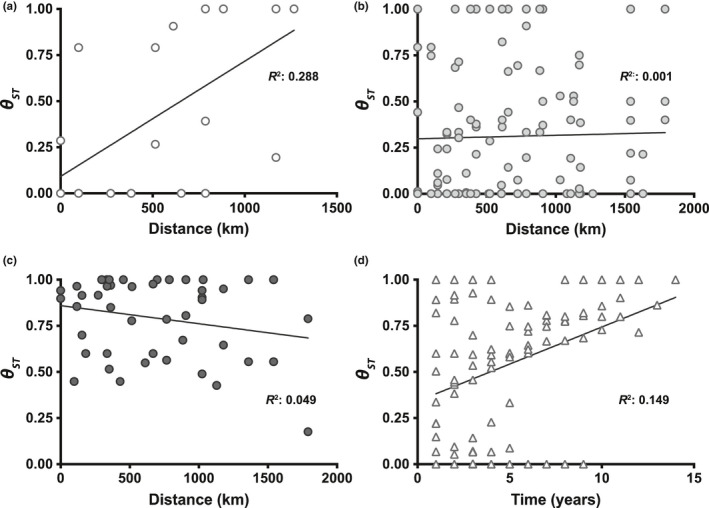
Piscine novirhabdovirus = Viral Hemorrhagic Septicemia Virus (VHSV) first appeared in the Laurentian Great Lakes with large outbreaks from 2005 to 2006, as a new and novel RNA rhabdovirus subgenogroup (IVb) that killed >30 fish species. Interlude periods punctuated smaller more localized outbreaks in 2007, 2010, and 2017, although some fishes tested positive in the intervals. There have not been reports of outbreaks or positives from 2018, 2019, or 2020. Here, we employ a combined population genetics and phylogenetic approach to evaluate spatial and temporal evolutionary trajectory on its G-gene sequence variation, in comparison with whole-genome sequences (11,083 bp) from a subset of 44 individual isolates (including 40 newly sequenced ones). Our results show that IVb (N = 184 individual fish isolates) diversified into 36 G-gene haplotypes from 2003 to 2017, stemming from two originals ("a" and "b"). G-gene haplotypes "a" and "b" differed by just one synonymous single-nucleotide polymorphism (SNP) substitution, remained the most abundant until 2011, then disappeared. Group "a" descendants (14 haplotypes) remained most prevalent in the Upper and Central Great Lakes, with eight (51%) having nonsynonymous substitutions. Group "b" descendants primarily have occurred in the Lower Great Lakes, including 22 haplotypes, of which 15 (68%) contained nonsynonymous changes. Evolutionary patterns of the whole-genome sequences (which had 34 haplotypes among 44 isolates) appear congruent with those from the G-gene. Virus populations significantly diverged among the Upper, Central, and Lower Great Lakes, diversifying over time. Spatial divergence was apparent in the overall patterns of nucleotide substitutions, while amino acid changes increased temporally. VHSV-IVb thus significantly differentiated across its less than two decades in the Great Lakes, accompanied by declining outbreaks and virulence. Continuing diversification likely allowed the virus to persist at low levels in resident fish populations, and may facilitate its potential for further and future spread to new habitats and nonacclimated hosts.

Keywords: RNA virus; Viral Hemorrhagic Septicemia Virus; evolutionary diversification; fish disease; novirhabdovirus; quasispecies; rhabdovirus.


Conflict of interest statement

None declared.

Figures

FIGURE 1
FIGURE 1
VHSV‐IVb structure and genome. Colors match the gene to the structure diagram. Numbers sharing the same colors as the gene refer to the nucleotide positions. Modified with permission from Pore (2012)
FIGURE 2
FIGURE 2
Maps showing locations (circles, colored by year) of VHSV‐IVb host samples and their isolates analyzed here, per time period (a) Early (2003–2006), (b) Middle (2007–2010), and (c) Later (2011–2017; none reported after 2017)
FIGURE 3
FIGURE 3
Concentrations of VHSV‐IVb (±standard error) in wild‐caught fish tissues, compared to results from experimental laboratory haplotype “a” challenged muskellunge, determined with qPCR assay developed in Stepien's laboratory using internal standards (Pierce, Willey, Palsule, et al., 2013). Laboratory samples (squares) are named by the number of days (6‐42D) after VHSV‐IVb inoculation, H: high virus dosage (1 × 105 pfu/ml), and L: low dosage (100 pfu/ml) (data from Pierce, 2013). Haplotype of each sample is listed above its standard error bars. Solid line denotes the experimental threshold for clinical signs of disease and dashed line the cell culture detection threshold (Pierce, Willey, Palsule, et al., 2013). Wild‐caught samples (circles) are designated by abbreviated common name, followed by collection year and sample number (Table 1). Fish species names: ALE, alewife; EMS, emerald shiner; FRD, freshwater drum; GIZ, gizzard shad; LMB, largemouth bass; MUS, muskellunge; PUM, pumpkinseed; ROG, round goby; WPE, white perch
FIGURE 4
FIGURE 4
VHSV‐IVb G‐gene phylogeny. Phylogenetic tree of VHSV haplotypes based on the G‐gene from maximum likelihood and Bayesian analyses. Values above nodes = 2,000 bootstrap pseudoreplicates/Bayesian posterior probabilities. Values in parentheses and italics = estimated divergence time (years) (Stepien et al., 2015). VHSV‐IVa (AB179621) served as the out‐group. Two clades discussed here (1 and 2) are designated by brackets. Symbols designate area in the Great Lakes (diamonds) and time period (squares)
FIGURE 5
FIGURE 5
G‐gene haplotype networks. Partial G‐gene sequences (669 NT) from 176 isolates using POPART (https://popart.otago.ac.nz) and TCS (Clement et al., 2000) for (a, b) Great Lakes regions (Upper, Central, Lower), (c, d) time periods (Early, Middle, Later), and (e, f) host species. a, c, and e are based on nucleotide substitutions and b, d, and f on amino acid changes. Circles are sized according to frequency of the haplotype in the population. Lines denote a single substitution step between haplotypes, with dashed lines for synonymous changes and solid lines for nonsynonymous changes. Small, unlabeled black circles represent hypothesized haplotypes. The “Other” category in e–f contains all host species, in which three or fewer nonunique isolates were detected: alewife (Alosa pseudoharengus), amphipod (Diporeia spp.), brown bullhead (Ameiurus nebulosus), burbot (Lota lota), channel catfish (Ictalurus punctatus), Chinook catfish (Oncorhynchus tshawytscha), common carp (Cyprinus carpio), cisco (Coregonus artedi), lake whitefish (C. clupeaformis), leech (Myzobdella lugubris), muskellunge (Esox masquinongy), northern pike (E. lucius), rainbow trout (Oncorhynchus mykiss), sea lamprey (Petromyzon marinus), shorthead redhorse (Moxostoma macrolepidotum), and walleye (Sander vitreus)
FIGURE 6
FIGURE 6
Whole‐genome haplotype network. Gene sequences (11,083 NT) from 44 isolates having 34 haplotypes (designated in Table 2) illustrated with POPART and TCS. Numbers on branches denote numbers of NT changes. Red = Upper Great Lakes, Yellow = Central Great Lakes, Blue = Lower Great Lakes, and Underline = Haplotypes from the Later time period. Individual isolates sharing haplotype “a” for the whole‐genome sequences were the following: E06WBc, C06NP, C06RB, C06SR, C06YP, C06FB, M08AMa‐b, C08LEa‐b, and C09MU, along with C03MU (see Table 2)
FIGURE 7
FIGURE 7
Neighbor‐joining genetic distance tree depicting relationships among VHSV‐IVb population samples. Reynolds' (1983) genetic distances (R ST) used on G‐gene haplotypes and their frequencies in PHYLIP (Felsenstein, 2007). Bootstrap percentage support for nodes from 10,000 replications is shown. Sample sizes (N) are in parentheses. Symbols designate area in the Great Lakes (diamonds) and time period (squares). *Samples from confirmed fish kill/outbreak events
FIGURE 8
FIGURE 8
Tests for significant relationship between genetic divergence (θ ST) among VHSV G‐gene sampling groups versus geographic distance (a–c, nearest waterway distance, km) or time (d, years). (a) Early time period (y = 0.001x + 0.091, R 2 = .288, p = .006*), (b) Middle time period (y = 1.86e‐5x + 0.298, R 2 = .001, p = .278; N.S.), (c) Later time period (y = −9.82e‐5x + 0.860, R 2 = .049, p = .709; N.S.), and (d) all samples (y = 0.040x + 0.342, R 2 = .149, p = .002*). N.S., not significant, * = significant

Similar articles

Cited by

References

    1. Abbadi, M. , Fusaro, A. , Ceolin, C. , Casarotto, C. , Quartesan, R. , Dalla Pozza, M. , … Panzarin, V. (2016). Molecular evolution and phylogeography of co‐circulating IHNV and VHSV in Italy. Frontiers in Microbiology, 7, 1306 10.3389/fmicb.2016.01306 - DOI - PMC - PubMed
    1. Afgan, E. , Baker, D. , Batut, B. , van den Beek, M. , Bouvier, D. , Čech, M. , … Blankenberg, D. (2018). The Galaxy platform for accessible, reproducible and collaborative biomedical analyses: 2018 update. Nucleic Acids Research, 46(1), W537–W544. 10.1093/nar/gky379 - DOI - PMC - PubMed
    1. Alabi, O. J. , Martin, R. R. , & Naidu, R. A. (2010). Sequence diversity, population genetics and potential recombination events in Grapevine Rupestris Stem Pitting‐associated Virus in Pacific Northwest vineyards. Journal of General Virology, 91(1), 265–276. 10.1099/vir.0.014423-0 - DOI - PubMed
    1. Alves, J. M. , Carneiro, M. , Cheng, J. Y. , Lemos de Matos, A. , Rahman, M. M. , Loog, L. , … Jiggins, F. M. (2019). Parallel adaptation of rabbit populations to myxoma virus. Science, 363(6433), 1319–1326. 10.1126/science.aau7285 - DOI - PMC - PubMed
    1. Ammayappan, A. , Kurath, G. , Thompson, T. M. , & Vakharia, V. N. (2011). A reverse genetics system for the Great Lakes strain of viral hemorrhagic septicemia virus: The Nv gene is required for pathogenicity. Marine Biotechnology, 13(4), 672–683. 10.1007/s10126-010-9329-4 - DOI - PubMed

LinkOut - more resources