

Leaf size variations in a dominant desert shrub, Reaumuria soongarica, adapted to heterogeneous environments
- PMID: 33005365
- PMCID: PMC7520190
- DOI: 10.1002/ece3.6668
Leaf size variations in a dominant desert shrub, Reaumuria soongarica, adapted to heterogeneous environments
Abstract
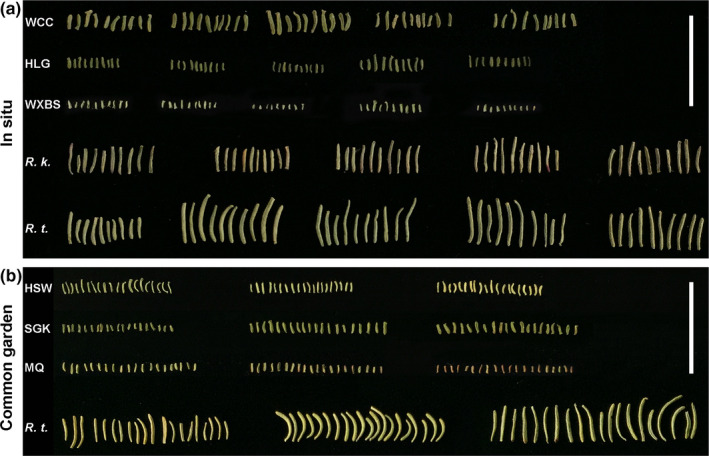
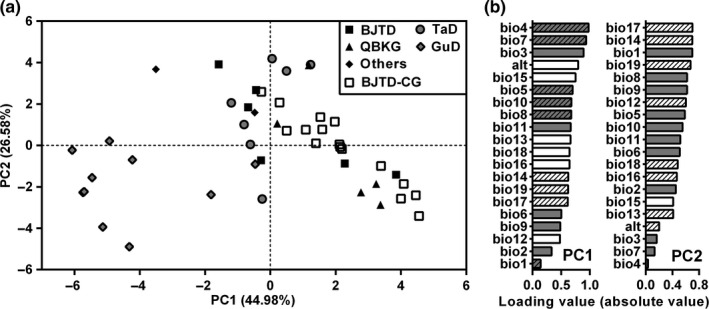
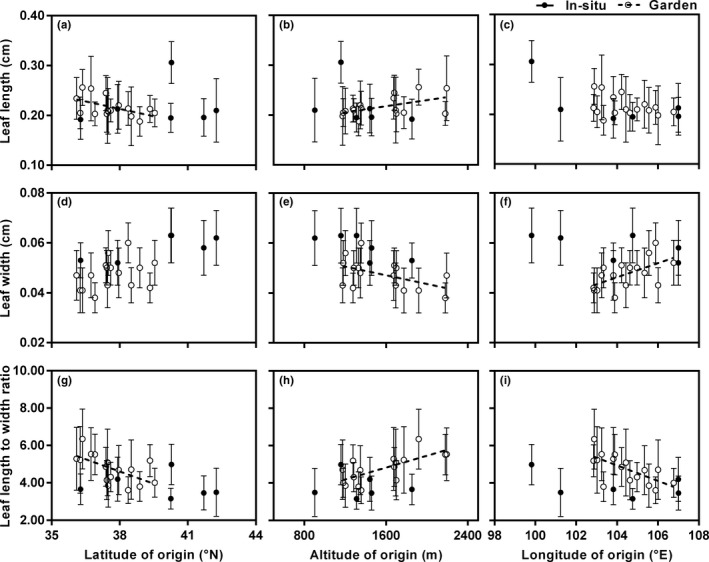
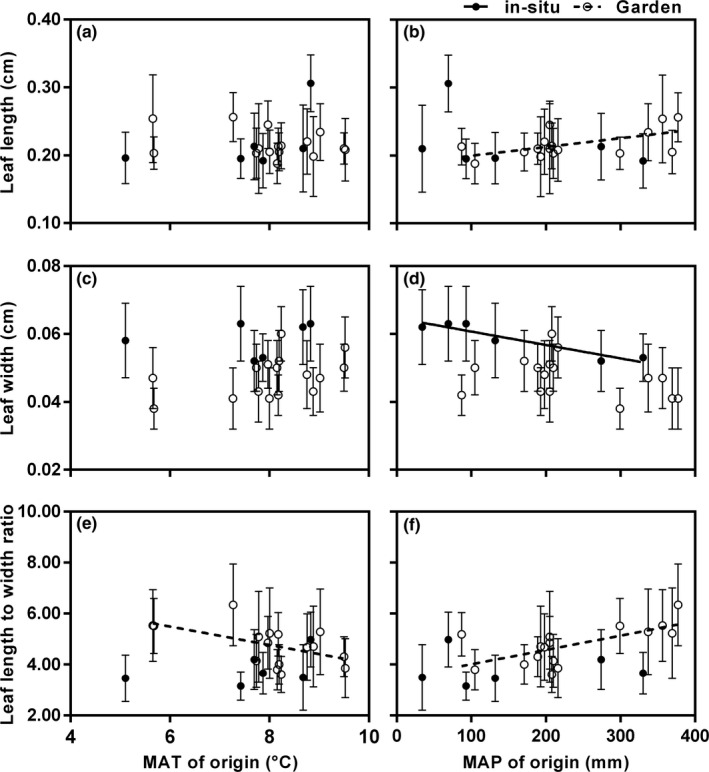
The climate in arid Central Asia (ACA) has changed rapidly in recent decades, but the ecological consequences of this are far from clear. To predict the impacts of climate change on ecosystem functioning, greater attention should be given to the relationships between leaf functional traits and environmental heterogeneity. As a dominant constructive shrub widely distributed in ACA, Reaumuria soongarica provided us with an ideal model to understand how leaf functional traits of desert ecosystems responded to the heterogeneous environments of ACA. Here, to determine the influences of genetic and ecological factors, we characterized species-wide variations in leaf traits among 30 wild populations of R. soongarica and 16 populations grown in a common garden. We found that the leaf length, width, and leaf length to width ratio (L/W) of the northern lineage were significantly larger than those of other genetic lineages, and principal component analysis based on the in situ environmental factors distinguished the northern lineage from the other lineages studied. With increasing latitude, leaf length, width, and L/W in the wild populations increased significantly. Leaf length and L/W were negatively correlated with altitude, and first increased and then decreased with increasing mean annual temperature (MAT) and mean annual precipitation (MAP). Stepwise regression analyses further indicated that leaf length variation was mainly affected by latitude. However, leaf width was uncorrelated with altitude, MAT, or MAP. The common garden trial showed that leaf width variation among the eastern populations was caused by both local adaptation and phenotypic plasticity. Our findings suggest that R. soongarica preferentially changes leaf length to adjust leaf size to cope with environmental change. We also reveal phenotypic evidence for ecological speciation of R. soongarica. These results will help us better understand and predict the consequences of climate change for desert ecosystem functioning.
Keywords: Reaumuria soongarica; arid Central Asia; common garden; environmental change; leaf size; local adaptation.
© 2020 The Authors. Ecology and Evolution published by John Wiley & Sons Ltd.
Conflict of interest statement
The authors have no conflict of interest to declare.
Figures


Similar articles
-
The role of East Asian monsoon system in shaping population divergence and dynamics of a constructive desert shrub Reaumuria soongarica.Sci Rep. 2015 Oct 29;5:15823. doi: 10.1038/srep15823. Sci Rep. 2015. PMID: 26510579 Free PMC article.
-
Chromosome-level genome assembly and annotation of xerophyte secretohalophyte Reaumuria soongarica.Sci Data. 2024 Jul 22;11(1):812. doi: 10.1038/s41597-024-03644-y. Sci Data. 2024. PMID: 39039100 Free PMC article.
-
Spatial variations in stomatal traits and their coordination with leaf traits in Quercus variabilis across Eastern Asia.Sci Total Environ. 2021 Oct 1;789:147757. doi: 10.1016/j.scitotenv.2021.147757. Epub 2021 May 15. Sci Total Environ. 2021. PMID: 34058578
-
The salt secretion of leaves promotes the competitiveness of Reaumuria soongarica in a desert grassland.BMC Plant Biol. 2022 Feb 25;22(1):85. doi: 10.1186/s12870-022-03457-4. BMC Plant Biol. 2022. PMID: 35216546 Free PMC article.
-
The Minderoo-Monaco Commission on Plastics and Human Health.Ann Glob Health. 2023 Mar 21;89(1):23. doi: 10.5334/aogh.4056. eCollection 2023. Ann Glob Health. 2023. PMID: 36969097 Free PMC article. Review.
Cited by
-
Changes in the functional traits of Thymus mongolicus along environmental gradients and factors influencing the traits of Northern China.Front Plant Sci. 2025 May 20;16:1596849. doi: 10.3389/fpls.2025.1596849. eCollection 2025. Front Plant Sci. 2025. PMID: 40464013 Free PMC article.
-
Phylogeographic analysis reveals multiple origins of the desert shrub Reaumuria songarica in northern Xinjiang, involving homoploid and tetraploid hybrids.Ecol Evol. 2024 Aug 29;14(9):e70199. doi: 10.1002/ece3.70199. eCollection 2024 Sep. Ecol Evol. 2024. PMID: 39219573 Free PMC article.
References
-
- Agrawal, A. A. (2020). A scale‐dependent framework for trade‐offs, syndromes, and specialization in organismal biology. Ecology, 101(2), e02924. - PubMed
-
- Albert, C. H. , Thuiller, W. , Yoccoz, N. G. , Soudant, A. , Boucher, F. , Saccone, P. , & Lavorel, S. (2010). Intraspecific functional variability: Extent, structure and sources of variation. Journal of Ecology, 98(3), 604–613. 10.1111/j.1365-2745.2010.01651.x - DOI
-
- Alcantara, J. M. , Bastida, J. M. , & Rey, P. J. (2010). Linking divergent selection on vegetative traits to environmental variation and phenotypic diversification in the Iberian columbines (Aquilegia). Journal of Evolutionary Biology, 23(6), 1218–1233. 10.1111/j.1420-9101.2010.01981.x - DOI - PubMed
-
- Berninger, F. , & Nikinmaa, E. (1994). Foliage area‐sapwood area relationships of Scots pine (Pinus sylvestris) trees in different climates. Canadian Journal of Forest Research, 24(11), 2263–2268.
Associated data
LinkOut - more resources
Full Text Sources
Research Materials
