. 2018;10(4):555.
doi: 10.3390/rs10040555. Epub 2018 Apr 4.

A Multilayer Surface Temperature, Surface Albedo and Water Vapor Product of Greenland from MODIS

Affiliations

A Multilayer Surface Temperature, Surface Albedo and Water Vapor Product of Greenland from MODIS

Dorothy K Hall et al. Remote Sens (Basel). 2018.

Abstract

A multilayer, daily ice-surface temperature (IST)-albedo-water vapor product of Greenland, extending from March 2000 through December 2016, has been developed using standard MODerate-resolution Imaging Spectroradiometer (MODIS) data products from the Terra satellite. To meet the needs of the ice sheet modeling community, this new Earth Science Data Record (ESDR) is provided in a polar stereographic projection in NetCDF format, and includes the existing standard MODIS Collection-6.1 IST and derived melt maps, and Collection 6 snow albedo and water vapor maps, along with ancillary data, and is provided at a spatial resolution of ~0.78 km. This ESDR enables relationships between IST, surface melt, albedo and water vapor to be evaluated easily. We show examples of the components of the ESDR and describe some uses of the ESDR such as for comparison with skin temperature, albedo and water vapor output from Modern Era Retrospective-analysis for Research and Applications, Version 2 (MERRA-2). Additionally we show validation of the MODIS IST using in situ and aircraft data, and validation of MERRA-2 skin temperature maps using MODIS IST and in situ data. The ESDR has been assigned a DOI and will be available through the National Snow and Ice Data Center by the summer of 2018.

Keywords: Greenland; IST; MERRA-2; MODIS; albedo; melt maps; water vapor.


Figures

Figure 1.
Figure 1.
Examples of monthly ice-surface temperature (IST) maps of the Greenland Ice Sheet derived from the Collection-6.1 MOD29 special IST product for Greenland, for June through September 2015.
Figure 2.
Figure 2.
Examples of monthly surface melt maps of the Greenland Ice Sheet derived from the MOD29 special MODIS ice surface temperature product, for June through September 2015.
Figure 3.
Figure 3.
Maps of maximum annual surface melt on the Greenland Ice Sheet derived from the MOD29 MODIS monthly ice surface temperature product of Greenland (2000 – 2016).
Figure 4.
Figure 4.
Examples of the monthly snow albedo maps of the Greenland Ice Sheet derived from the Collection 6 MOD10A1 standard MODIS product, for June through September 2015.
Figure 5.
Figure 5.
Examples of monthly water vapor maps of the Greenland Ice Sheet derived from the Collection 6 MOD05 standard MODIS product [18], for June through September 2015.
Figure 6.
Figure 6.
Eight major drainage basins of the Greenland Ice Sheet [7].
Figure 7.
Figure 7.
Left - Map from the earlier ice surface temperature (IST) Earth Science Data Record (ESDR) that used MODIS Collection 5 IST data from MOD29. Right - Map from the new ESDR, using MOD29 Collection 6.1 data. Note the more-detailed land/water/ice mask and the fewer cloud pixels in the new IST map.
Figure 8.
Figure 8.
Four-day composites from 10–13 July 2014 of the daily ice surface temperature (IST), surface melt, albedo and water vapor (WV) maps. Coastal land outside of the ice sheet is green and cloud is grey; missing data is black. The red arrow points to the same place on each map. Cloud cover is different on the IST, melt and albedo maps because of the way the algorithms perform the compositing even though the maps are derived from the same four-day period.
Figure 9.
Figure 9.
Skin temperature from Adolph et al. [29] versus ice surface temperature from the new ESDR at the study site north-northwest of Summit Station (72.65923°N, −38.57067°W) for the 40-day study period, 8 June – 18 July 2015.
Figure 10.
Figure 10.
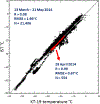
Comparison of ice surface temperature (IST) and KT-19 infrared radiometer-derived temperature acquired during IceBridge flights over Greenland between 18 – 21 May 2014. The points shown in red are derived from a flight segment on 29 April which was a day with minimal cloud cover (though was not completely cloud-free).
Figure 11.
Figure 11.
January 2015 monthly maps. Top row: Monthly average of all available data (A): MODIS ice surface temperature (IST) swath; (B): MERRA-2 skin temperature; (C): MODIS minus MERRA-2 difference map, in °C, for January 2015. Bottom row: (D): Monthly average of all available MODIS IST swath data as in (A); (E): MERRA-2 skin temperatures averaged over times corresponding to available MODIS IST swaths used to create (A) and (D); and (F): difference map, in °C, of MODIS minus MERRA-2, for January 2015.
Figure 12.
Figure 12.
July 2015 monthly maps. (A): MODIS daily ice surface temperature in °C, for July 2015; (B): MERRA-2 monthly temperatures in °C, for July 2015 where MERRA-2 hourly skin temperature data were selected to match times corresponding to the MODIS swaths and then averaged to create a monthly map; (C): MODIS minus MERRA-2 difference map, in °C. The agreement between the MODIS and MERRA-2 maps in panels (A) and (B), is R = 0.91, and N = 2,867,800.
Figure 13.
Figure 13.
4 January 2015 skin temperature maps. (A): MODIS daily ice surface temperature (IST); (B): MERRA-2 skin temperature averaged from times selected to correspond to available MODIS IST swaths used to develop (A); and (C): a difference map, in °C, of MODIS minus MERRA-2, for 4 January 2015. Note in (B) that black on the MERRA-2 map shows where clouds are found in the MODIS map.
Figure 14.
Figure 14.
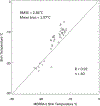
Skin temperature from Adolph et al. [29] vs. MERRA-2 skin temperature at the study site north-northwest of Summit Station (72.65923°N, −38.57067°W) for the 40-day study period, 8 June – 18 July 2015. The agreement was R = 0.92, with an RMSE of 2.86°C, where N = 40.
Figure 15.
Figure 15.
Comparison of MODIS and MERRA-2 mean monthly albedo for July 2015. The left panel shows the monthly MODIS albedo, the center panel shows the mean monthly MERRA-2 albedo and the panel on the right shows the difference maps (MODIS minus MERRA-2). The correlation is R=0.74, and N = 2,867,800.
Figure 16.
Figure 16.
Comparison of MODIS and MERRA-2 daily albedo for 1 July 2015. (A): Daily MODIS albedo, (B): daily MERRA-2 albedo, and (C): difference map (MODIS minus MERRA-2). The correlation between the MODIS daily albedo and the MERRA-2 daily albedo is R = 0.65. Only ice sheet cells that were cloud-free on MODIS were used to create the maps, where N = 1,978,312.
Figure 17.
Figure 17.
Comparison of MODIS and MERRA-2 monthly mean water vapor for July 2015. (A): Monthly MODIS WV, (B): Monthly MERRA-2 WV, and (C): difference map (MODIS minus MERRA-2). This comparison yields a correlation of R = 0.90; the number of cells available to create the maps is N = 2,868,630.

References

    1. Enderlin EM; Howat IM; Jeong S; Noh M‐J; Angelen JH; Broeke MR An improved mass budget for the Greenland ice sheet. Geophysical Research Letters. 2014, 41(3), 866–872, 10.1002/2013GL059010. - DOI
    1. Price SF; Payne AG; Howat IM; Smith BE; Committed sea-level rise for the next century from Greenland ice sheet dynamics during the past decade. Proc. Natl. Acad. Sci. U.S.A 2011, 108(22), 8978–8983. - PMC - PubMed
    1. Nowicki S; et al. Insights into spatial sensitivities of ice mass response to environmental change from the SeaRISE ice sheet modeling project II: Greenland, J. Geophys. Res. Earth Surf, 2013, 1181025, 1002–1024, 10.1002/jgrf.20076. - DOI
    1. Cullather RI; Nowicki SMJ; Zhao B; Suarez MJ Evaluation of the surface representation of the Greenland ice sheet in a general circulation model. Jour. Climate 2014, 27(13), 4835–4856.
    1. Hall DK; Comiso JC; DiGirolamo NE; Shuman CA; Key J; Koenig LS A Satellite-Derived Climate-Quality Data Record of the Clear-Sky Surface Temperature of the Greenland Ice Sheet, Journal of Climate, 2012, 25(14), 4785–4798.

LinkOut - more resources