

Dissecting molecular network structures using a network subgraph approach
- PMID: 33005483
- PMCID: PMC7512139
- DOI: 10.7717/peerj.9556
Dissecting molecular network structures using a network subgraph approach
Abstract
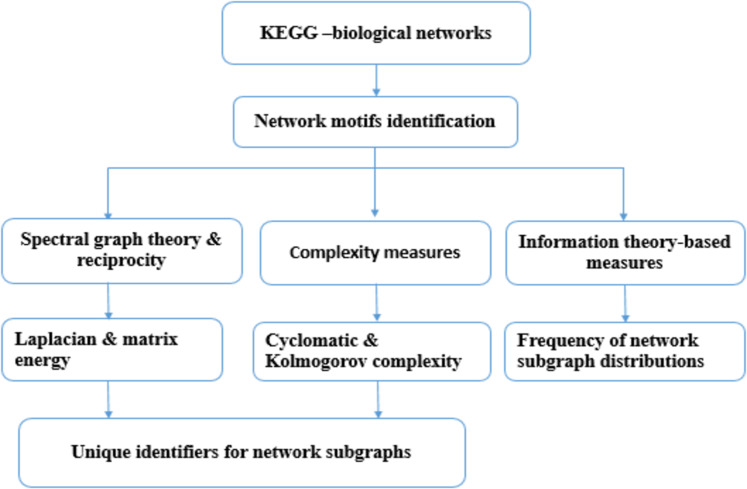
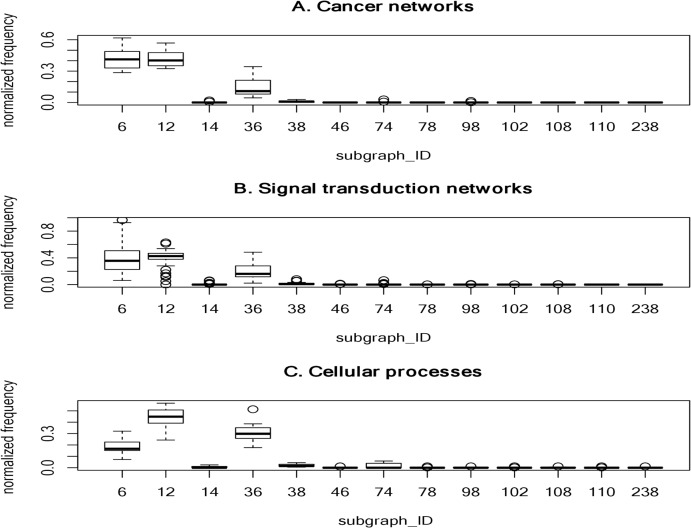
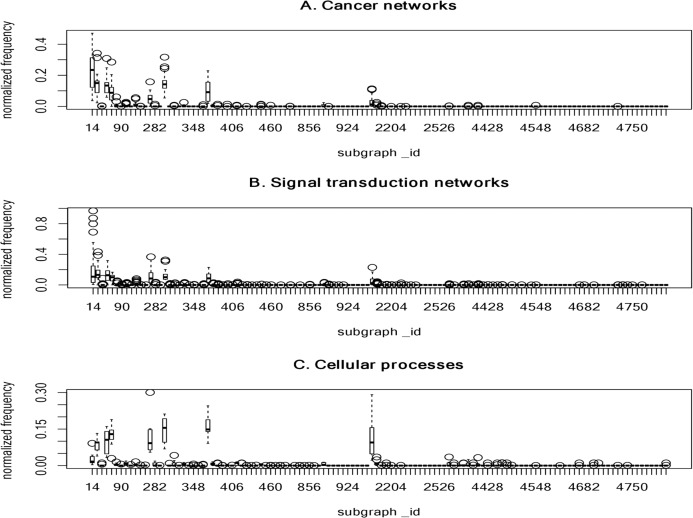
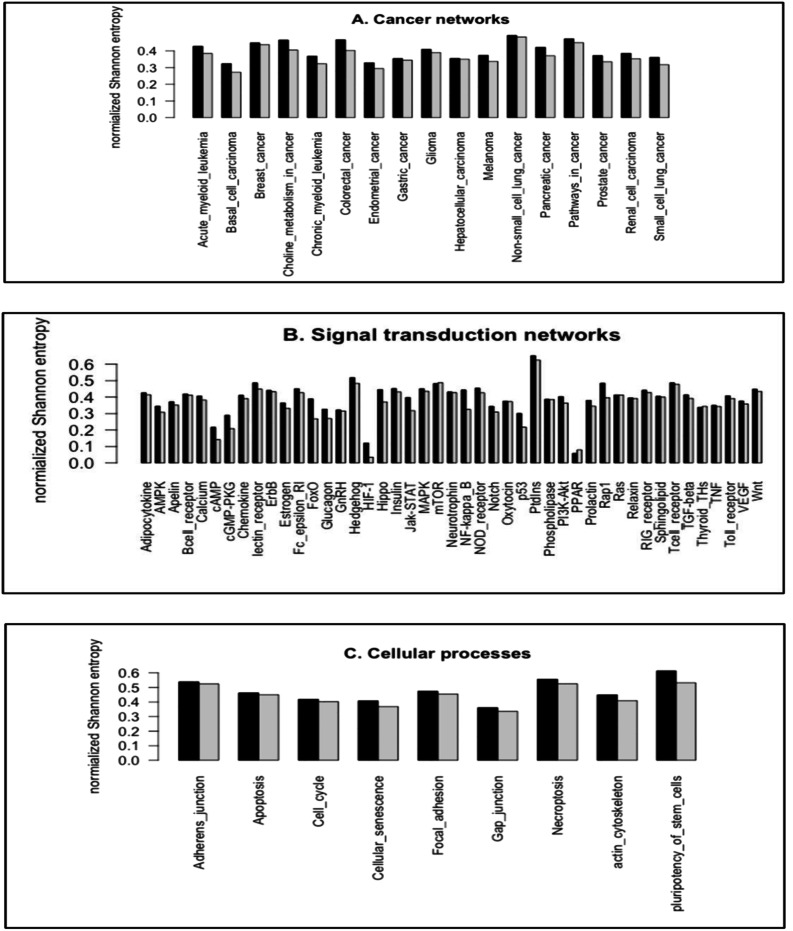
Biological processes are based on molecular networks, which exhibit biological functions through interactions of genetic elements or proteins. This study presents a graph-based method to characterize molecular networks by decomposing the networks into directed multigraphs: network subgraphs. Spectral graph theory, reciprocity and complexity measures were used to quantify the network subgraphs. Graph energy, reciprocity and cyclomatic complexity can optimally specify network subgraphs with some degree of degeneracy. Seventy-one molecular networks were analyzed from three network types: cancer networks, signal transduction networks, and cellular processes. Molecular networks are built from a finite number of subgraph patterns and subgraphs with large graph energies are not present, which implies a graph energy cutoff. In addition, certain subgraph patterns are absent from the three network types. Thus, the Shannon entropy of the subgraph frequency distribution is not maximal. Furthermore, frequently-observed subgraphs are irreducible graphs. These novel findings warrant further investigation and may lead to important applications. Finally, we observed that cancer-related cellular processes are enriched with subgraph-associated driver genes. Our study provides a systematic approach for dissecting biological networks and supports the conclusion that there are organizational principles underlying molecular networks.
Keywords: Biological networks; Entropy; Graph theory; Information theory; Network complexity; Network motifs; Network subgraphs.
© 2020 Huang et al.
Conflict of interest statement
The authors declare that they have no competing interests.
Figures
Similar articles
-
Network subgraph-based approach for analyzing and comparing molecular networks.PeerJ. 2022 May 3;10:e13137. doi: 10.7717/peerj.13137. eCollection 2022. PeerJ. 2022. PMID: 35529499 Free PMC article.
-
Grasping frequent subgraph mining for bioinformatics applications.BioData Min. 2018 Sep 3;11:20. doi: 10.1186/s13040-018-0181-9. eCollection 2018. BioData Min. 2018. PMID: 30202444 Free PMC article. Review.
-
Robust subgraph counting with distribution-free random graph analysis.Phys Rev E. 2021 Oct;104(4-1):044313. doi: 10.1103/PhysRevE.104.044313. Phys Rev E. 2021. PMID: 34781540
-
RASMA: a reverse search algorithm for mining maximal frequent subgraphs.BioData Min. 2021 Mar 16;14(1):19. doi: 10.1186/s13040-021-00250-1. BioData Min. 2021. PMID: 33726790 Free PMC article.
-
Graph mining: procedure, application to drug discovery and recent advances.Drug Discov Today. 2013 Jan;18(1-2):50-7. doi: 10.1016/j.drudis.2012.07.016. Epub 2012 Aug 5. Drug Discov Today. 2013. PMID: 22889967 Review.
Cited by
-
Bioinformatics: From NGS Data to Biological Complexity in Variant Detection and Oncological Clinical Practice.Biomedicines. 2022 Aug 24;10(9):2074. doi: 10.3390/biomedicines10092074. Biomedicines. 2022. PMID: 36140175 Free PMC article. Review.
-
Network subgraph-based approach for analyzing and comparing molecular networks.PeerJ. 2022 May 3;10:e13137. doi: 10.7717/peerj.13137. eCollection 2022. PeerJ. 2022. PMID: 35529499 Free PMC article.
References
-
- Adiga C, Balakrishnan R, So W. The skew energy of a graph. Linear Algebra and Its Applications. 2010;432:1825–1835. doi: 10.1016/j.laa.2009.11.034. - DOI
-
- Alon U. An introduction to systems biology: design principles of biological circuits. London: Chapman and Hall/CRC; 2006.
LinkOut - more resources
Full Text Sources
