Review
. 2020 Aug 26:8:728.
doi: 10.3389/fchem.2020.00728. eCollection 2020.

Exploring Graphene and MoS2 Chips Based Surface Plasmon Resonance Biosensors for Diagnostic Applications

Affiliations
Review

Exploring Graphene and MoS2 Chips Based Surface Plasmon Resonance Biosensors for Diagnostic Applications

Devi Taufiq Nurrohman et al. Front Chem. .

Abstract

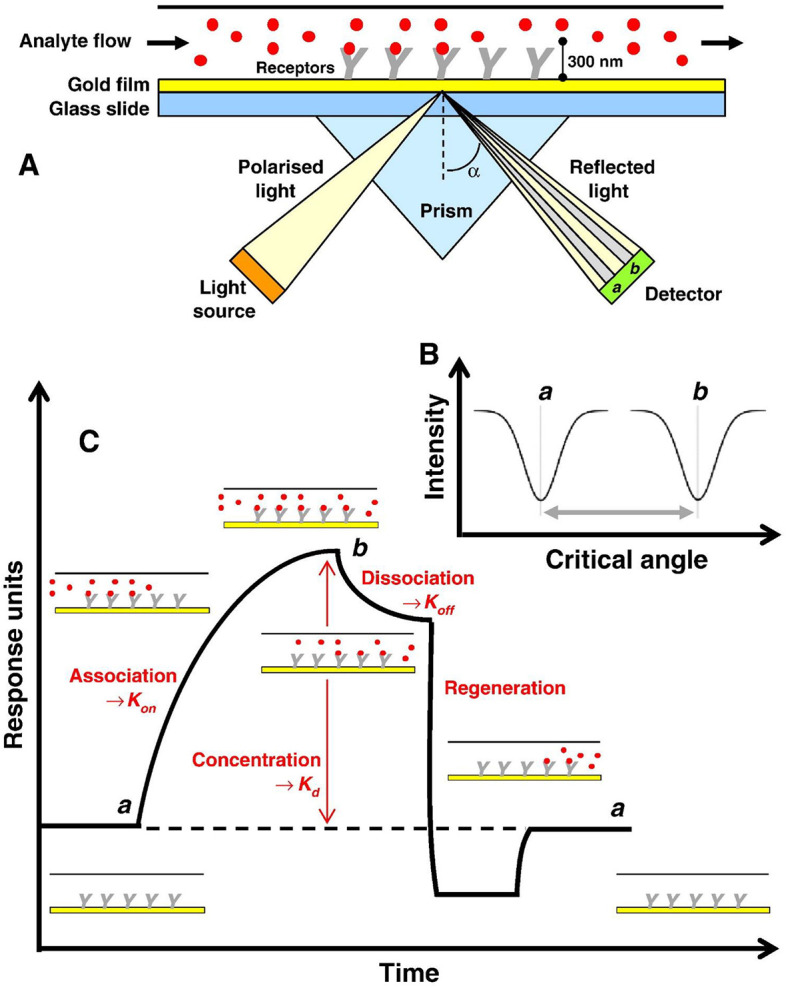
Until now, two-dimensional (2D) nanomaterials have been widely studied and applied in the biosensor field. Some of the advantages offered by these 2D materials include large specific surface area, high conductivity, and easy surface modification. This review discusses the use of 2D material in surface plasmon resonance (SPR) biosensor for diagnostic applications. Two-dimensional material reviewed includes graphene and molybdenum disulfide (MoS2). The discussion begins with a brief introduction to the general principles of the SPR biosensor. The discussion continues by explaining the properties and characteristics of each material and its effect on the performance of the SPR biosensor, in particular its sensitivity. This review concludes with some recent applications of graphene- and MoS2-based SPR biosensor in diagnostic applications.

Keywords: 2D materials; MoS2; biosensor; diagnostic; graphene; surface plasmon resonance.


Figures

Figure 1
Figure 1
(A) Instrument setup for an SPR experiment. (B) Change in the SPR angle of incident light from angle a to angle b on the binding of an analyte molecule to a bioreceptor molecule. (C) Response of the SPR experiment in the form of a sensogram. Figures (A–C) were reproduced from Patching (2014) with permission from Elsevier. Copyright 2014, Elsevier.
Figure 2
Figure 2
Three fabricated chips. (A) Conventional chip. (B) GO-SPR chip. (C) rGO-SPR chip. (D) SPR sensogram on conventional chip, GO-SPR chip, and rGO-SPR chip. Figures (A–D) were reproduced from Chiu et al. (2012) with permission from the SPIE. Copyright 2012, SPIE.
Figure 3
Figure 3
Surface plasmon resonance sensograms obtained in response to BSA solutions of different concentrations flowing over the surfaces of the sensors. (A) Interaction with the conventional Au film-based (Au–MOA) sensor (1 mM). (B) Interaction with the 0.275 mg/mL GOS. (C) Interaction with the 1 mg/mL GOS sensor. (D) Interaction with the 2 mg/mL GOS sensor. Figures (A–D) were reproduced from Chiu and Huang (2014) with permission from Elsevier. Copyright 2014, Elsevier.
Figure 4
Figure 4
(A) SPR experimental scheme to study the interaction of BSA and anti-BSA. (B) Equilibrium analysis of binding of anti-BSA and BSA. Figures (A,B) were reproduced from Chiu et al. (2014) with permission from the Nanoscale Research Letters. Copyright 2014, Springer Nature.
Figure 5
Figure 5
(A) Fabrication of SPR chip with biomolecular immobilization on modified surface of carboxyl-functionalized GO film. (B) Analysis of antigen-antibody interaction on various sensing chips with various analyte concentrations. (C) Sensogram and calibration curve on Au/GO-COOH chip at concentrations of 0.01–100 pg/mL. Figures (A–C) were reproduced from Chiu et al. (2017a) with permission from Elsevier. Copyright 2017, Springer Nature.
Figure 6
Figure 6
The cssDNA detection mechanism developed by Prabowo et al. This figure was reproduced from Prabowo et al. (2016) with permission from Elsevier. Copyright 2016, Elsevier.
Figure 7
Figure 7
Surface modification to detect hCG protein with SPR biosensor. Figures (A–D) were reproduced from Chiu et al. (2017b) with permission from Elsevier. Copyright 2017, Elsevier.
Figure 8
Figure 8
Schematic illustration of the conversion of (A) GO into (B) carboxyl-GO sheets via a facile one-step chloroacetic acid modification route. (C) GO surface activation with EDC/NHS. (D) The attachment of peptides via amine coupling and the deactivation of the unreacted surface sites. (E) Immobilization of the peptide on the carboxyl-GO–based SPR chip using non-immunological to detect hCG protein. (F) Schematic instrumental setup of the Kretschmann configuration. Figures (A–F) were reproduced from Chiu et al. (2019a) with permission from Dove Medical Press.
Figure 9
Figure 9
Graphene oxide–COOH sheet-based SPR immunosensor to detect CK19 protein. The figure was reproduced from Chiu et al. (2018) with permission from Elsevier. Copyright 2018, Elsevier.
Figure 10
Figure 10
(A) The SPR angle shift plot of six different proteins to determine biosensor selectivity. (B) Calibration curve of the average SPR response to various PAPP-A2 protein concentrations. Figures (A,B) were reproduced from Chiu et al. (2019b) with permission from the Dove Medical Press.
Figure 11
Figure 11
Surface plasmon resonance response curves and curve fitting equations of PAPP-A (A) and PAPP-A2 (B) measurement with the traditional SPR biosensor and GO-SPR biosensor. Figures (A,B) were reproduced from Fan et al. (2020) with permission from Dove Medical Press.
Figure 12
Figure 12
Surface plasmon resonance signals of (A) bare Ag and (B) Ag/MoS2 chip in water with laser irradiation. Figures (A,B) were reproduced from Kim et al. (2019) with permission from MDPI.
Figure 13
Figure 13
Surface plasmon resonance signal against BSA in phosphate-buffered saline (PBS) solution of the (A) optical fiber SPR biosensor without MoS2 and (C) developed SPR biosensor. Calibration curve of (B) Ab/gold/fiber; (D) Ab/MoS2/gold/fiber against varying concentration of BSA in PBS solution. Figures (A–D) were reproduced from Kaushik et al. (2019a) with permission from the Springer Nature.
Figure 14
Figure 14
Synthesis of MoS2-COOH sheet with monocholoroacetic acid (MCA). Figure was reproduced from Chiu et al. (2018) with permission from Elsevier. Copyright 2018, Elsevier.
Figure 15
Figure 15
(A) The sensogram that shows the SPR response at different CYFRA21-1 protein concentrations. (B) Sensor selectivity for different types of proteins. Figures (A,B) were reproduced from (Chiu and Yang, 2020) with permission from Frontiers.

Similar articles

Cited by

References

    1. Agarwal S., Giri P., Prajapati Y. K., Chakrabarti P. (2016a). Effect of surface roughness on the performance of optical spr sensor for sucrose detection: fabrication, characterization, and simulation study. IEEE Sens. J. 16, 8865–8873. 10.1109/JSEN.2016.2615110 - DOI
    1. Agarwal S., Prajapati Y. K., Maurya J. B. (2016b). Effect of metallic adhesion layer thickness on surface roughness for sensing application. IEEE Photonics Technol. Lett. 28, 2415–2418. 10.1109/LPT.2016.2597856 - DOI
    1. Amendola V., Pilot R., Frasconi M., Maragò O. M., Iatì M. A. (2017). Surface plasmon resonance in gold nanoparticles: a review. J. Phys. Condens. Matter 29:203002. 10.1088/1361-648X/aa60f3 - DOI - PubMed
    1. Amieva J. C., Barroso J. L., Hernandez A. L. M., Santos C. V. (2016). “Graphene-based materials functionalization with natural polymeric biomolecules,” in Recent Advances in Graphene Research, ed Pramoda Kumar N. (Rijeka: InTech; ), 257–298.
    1. Banerjee A. N. (2018). Graphene and its derivatives as biomedical materials: future prospects and challenges. Interface Focus 8:20170056. 10.1098/rsfs.2017.0056 - DOI - PMC - PubMed

LinkOut - more resources