. 2020 Sep 8;5(3):e10184.
doi: 10.1002/btm2.10184. eCollection 2020 Sep.

Oxidative pentose phosphate pathway and glucose anaplerosis support maintenance of mitochondrial NADPH pool under mitochondrial oxidative stress

Affiliations

Oxidative pentose phosphate pathway and glucose anaplerosis support maintenance of mitochondrial NADPH pool under mitochondrial oxidative stress

Sun Jin Moon et al. Bioeng Transl Med. .

Abstract

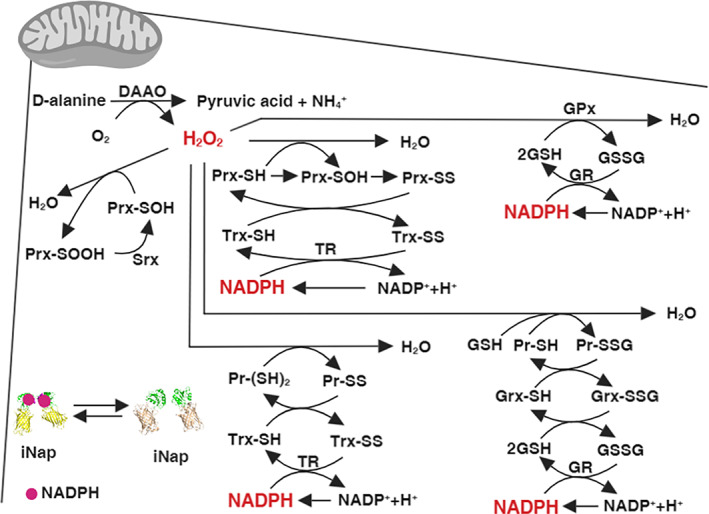
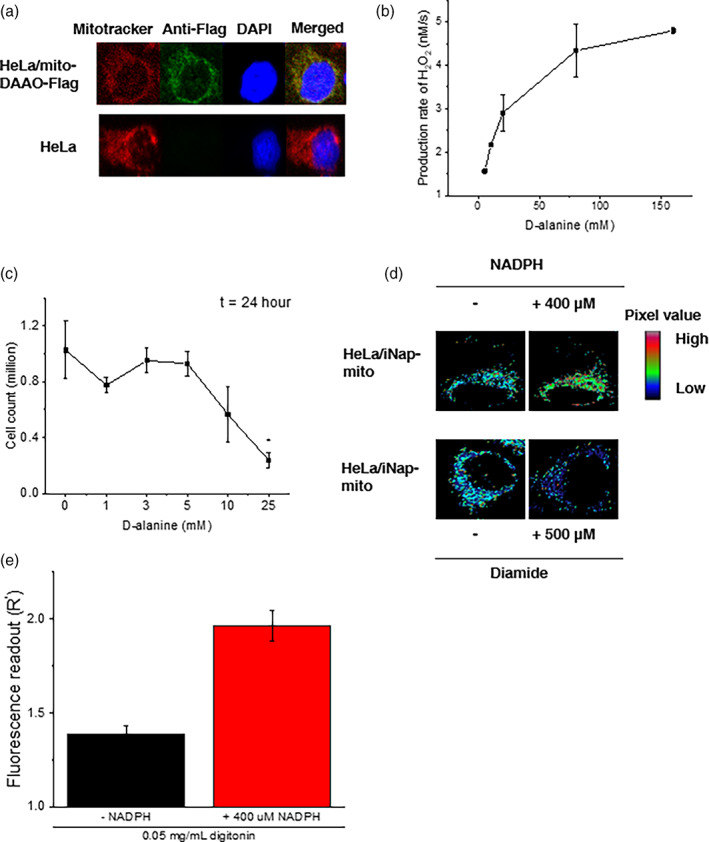
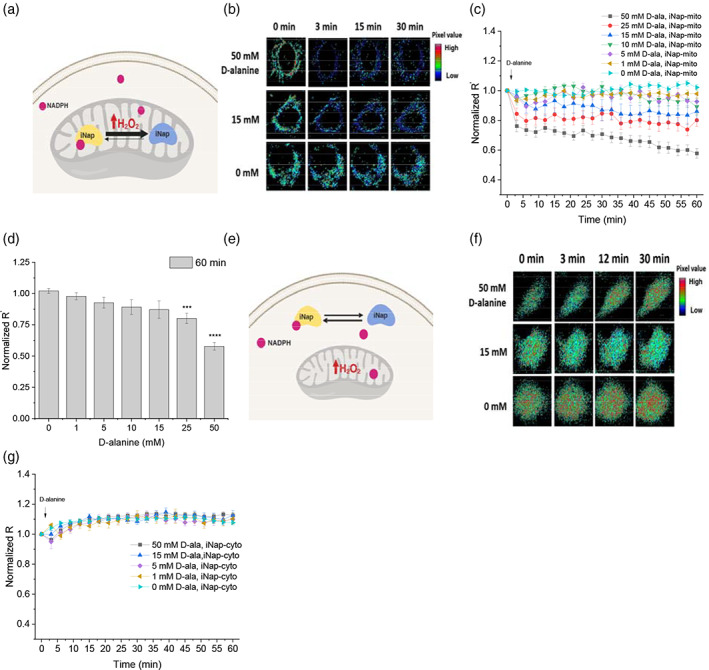
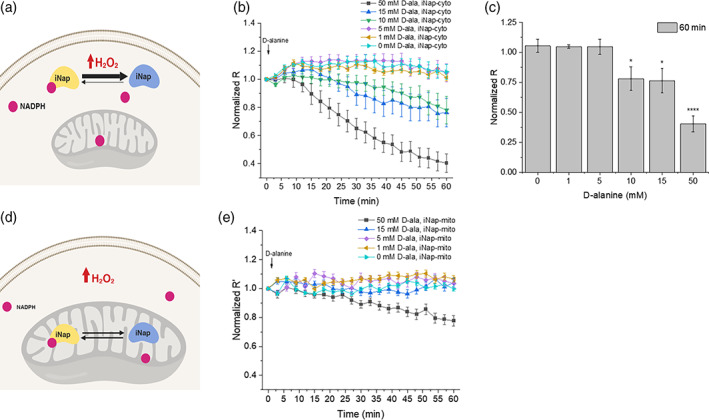
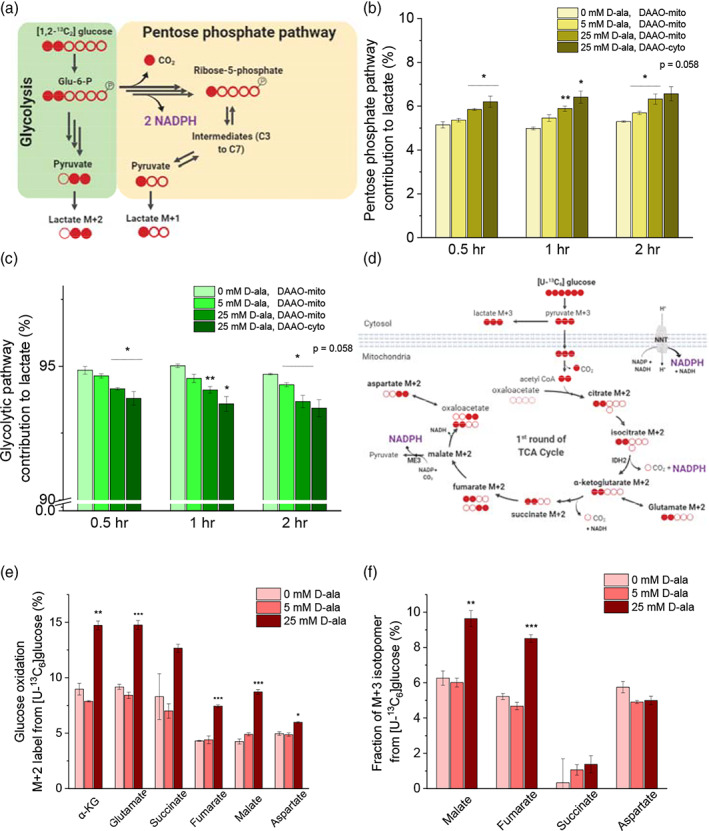
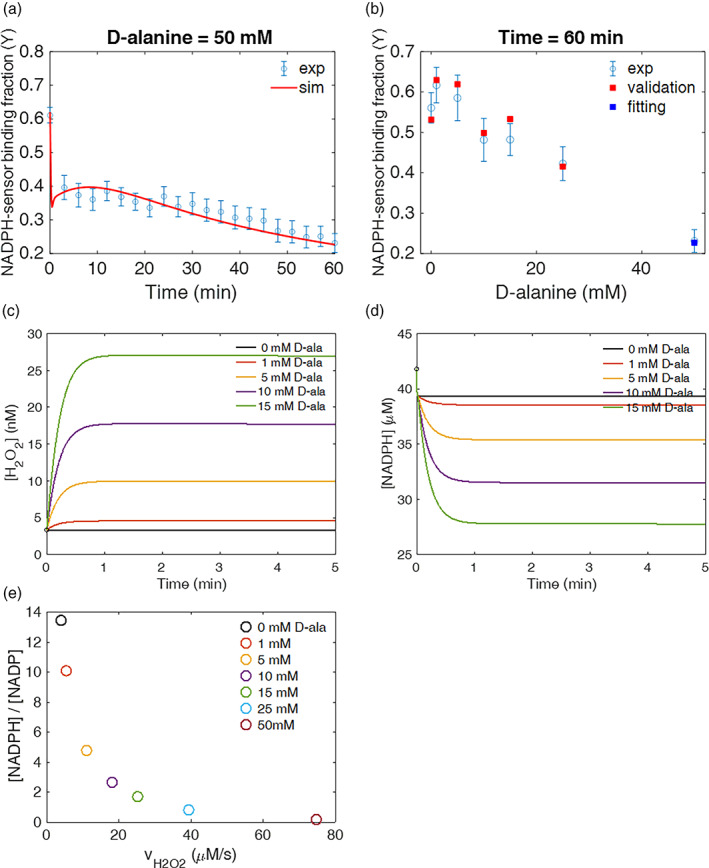
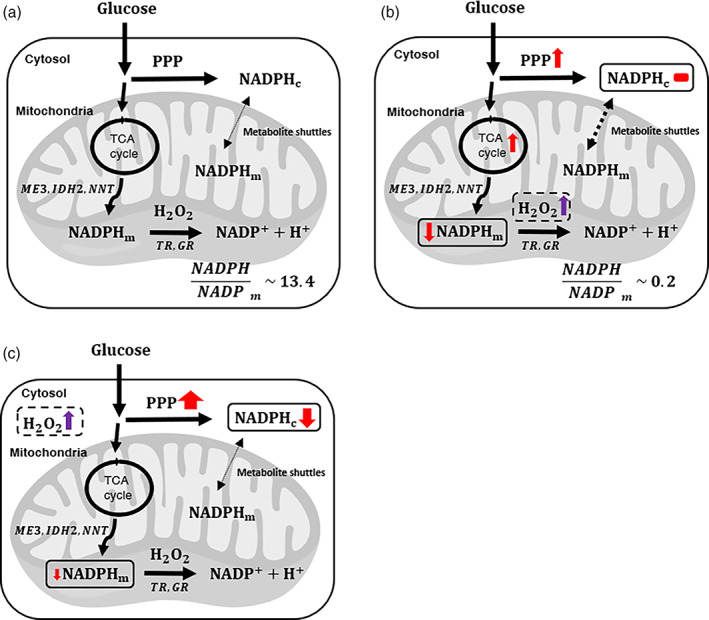
Mitochondrial NADPH protects cells against mitochondrial oxidative stress by serving as an electron donor to antioxidant defense systems. However, due to technical challenges, it still remains unknown as to the pool size of mitochondrial NADPH, its dynamics, and NADPH/NADP+ ratio. Here, we have systemically modulated production rates of H2O2 in mitochondria and assessed mitochondrial NADPH metabolism using iNap sensors, 13C glucose isotopic tracers, and a mathematical model. Using sensors, we observed decreases in mitochondrial NADPH caused by excessive generation of mitochondrial H2O2, whereas the cytosolic NADPH was maintained upon perturbation. We further quantified the extent of mitochondrial NADPH/NADP+ based on the mathematical analysis. Utilizing 13C glucose isotopic tracers, we found increased activity in the pentose phosphate pathway (PPP) accompanied small decreases in the mitochondrial NADPH pool, whereas larger decreases induced both PPP activity and glucose anaplerosis. Thus, our integrative and quantitative approach provides insight into mitochondrial NADPH metabolism during mitochondrial oxidative stress.

Keywords: NADPH; NADPH metabolism; NADPH sensor; hydrogen peroxide; mitochondria; oxidative stress; redox kinetic model.


Figures

FIGURE 1
FIGURE 1
Schematics representing a mechanistic connection between hydrogen peroxide and NADPH via a network of mitochondrial redox reactions. We modulated mitochondrial H2O2 using D‐amino acid oxidase (DAAO) targeted to mitochondria. H2O2 is reduced to water by reacting with reactive cysteine residues of Prx, GPx, or proteins. Through subsequent redox cycling reactions, NADPH acts as an ultimate reductant by donating electrons to oxidized redox species. The mitochondrial NADPH pool was monitored by measuring a fluorescence ratio from a mitochondrial iNap sensor, a genetically encoded sensor for NADPH. Detailed mitochondrial redox reactions considered in our system can be found in Table S1
FIGURE 2
FIGURE 2
Validation of a system that generates hydrogen peroxide in mitochondria with D‐amino acid oxidase (DAAO) and measures NADPH with an iNap sensor. (a) Hela cells were transiently transfected with a mito‐DAAO‐FLAG and its localization to mitochondria was confirmed. Staining: Mitotracker (red), anti‐FLAG (green), DAPI (blue). (b) The enzymatic activity of DAAO was measured via a horseradish peroxidase based Amplex UltraRed assay. Fluorescence intensity was measured after incubation of HeLa cell lysates with D‐alanine for an hour. Fluorescence readings were converted to hydrogen peroxide concentrations using a standard curve constructed using known concentrations of hydrogen peroxide. Data represent two independent experiments ±SD. (c) Cell numbers were counted after 24 hr of incubation of D‐alanine with Hela/mito‐DAAO cells with error bars representing SEM of three independent experiments. (d) Pseudo‐colored images represent the change of fluorescence intensity of Hela/mito‐iNap cells in the presence or absence of NADPH, or diamide. For incubation of NADPH, 0.05 mg/ml digitonin was used to permeabilize the mitochondrial membrane. (e) Fluorescence readout (R=RiNapmitoRiNapCmito) was quantified before and after addition of 400 μM NADPH in digitonin treated Hela cells expressing iNap sensors. Data represents the mean of fluorescence ratio of individual cells from three independent experiments ±SEM. (n = 22 and 16 cells)
FIGURE 3
FIGURE 3
Generation of mitochondrial H2O2 via mito‐DAAO and measurement of compartmentalized NADPH via iNap‐mito or iNap‐cyto. (a) Schematics depicting a system that generates mitochondrial H2O2 via expression of mito‐DAAO and measures the mitochondrial NADPH pool using the iNap‐mito sensor. (b) Single cell images representing a fluorescence ratio of mitochondrial iNap sensors in response to D‐alanine treatment. Raw images were exported to MATLAB, processed to remove background signal, and the ratio of two images obtained from the 415 and 488 nm excitation channels was calculated. Individual pixel values were pseudo‐colored in range of 0 to 15, representing a dark‐blue (low) to red (high), whose values were used only for graphical visualization of cells. (c) Fluorescence readout (R), normalized to that of initial value, was measured every 3 min after stimulation with D‐alanine ranging from 0 to 50 mM. Normalized R represent mean values of individual cells from at least two independent experiments ±SEM. (n = 21, 13, 12, 10, 14, 17, 21 cells from experiments with the 50 to 0 mM D‐alanine). (d) A relative change of normalized R from iNap‐mito at 60 min in response of D‐alanine addition. (e) Schematics representing a system with H2O2 generator in mitochondria and iNap‐cyto. (f) Time‐dependent change of a ratiometric fluorescence signal of cytosolic iNap sensor in response to D‐alanine treatment. (g) Normalized fluorescence ratio (R) was recorded with D‐alanine ranging from 0 to 50 mM. Values represent mean of individual cells from at least two independent experiments ±SEM. (n = 21, 11, 7, 8, 23 cells from experiments with 50 to 0 mM D‐alanine. A two‐tailed student's t test was used for statistical analysis with p‐values < .05 considered statistically significant (*p < .05, ***p < .001,  **** p < .0001)
FIGURE 4
FIGURE 4
Production of H2O2 and measurement of NADPH in cytoplasm and mitochondria. (a) Schematic of cytosolic H2O2 generation by DAAO expressed in cytosol and NADPH measured by the cytosolic iNap sensor. (b) Normalized R from iNap‐cyto was monitored after stimulating cells with six different concentrations of D‐alanine. Values were recorded at every 3 min for an hour and represent mean of individual cells from at least two independent experiments ±SEM. (n = 10, 14, 14, 9, 9, 9 cells from experiments with 50 to 0 mM D‐alanine). (c) Normalized R from iNap‐cyto was measured at 60 min. (d) Schematic depicting the generation of cytosolic H2O2 by DAAO expressed in cytosol and the mitochondrial NADPH pools measured by iNap‐mito. (e) Normalized R′ from iNap‐mito was monitored after stimulating cells with a range of D‐alanine concentrations. Values were recorded every 3 min for an hour and represent mean of individual cells from at least two independent experiments ±SEM. (n = 39, 42, 12, 28, 17 cells from experiments with 50 to 0 mM D‐alanine). A two‐tailed student's t test was used for statistical analysis with p‐values < .05 considered statistically significant (*p < .05, *** p < .001, **** p < .0001)
FIGURE 5
FIGURE 5
Mitochondrial oxidative stress increases fluxes through pentose phosphate pathway and glucose anaplerosis. (a) Schematic of the labeling pattern from [1, 2 − 13C2]glucose isotope tracer for measurement of a relative pathway strength between glycolysis and the pentose phosphate pathway. (b) Relative strength of pentose phosphate pathway is represented by the fraction of M + 1 of the sum of M + 1 and M + 2 lactate. (c) Glycolytic pathway activity is indicated by the fraction of M + 2 lactate. (d) Carbon transition map demonstrating oxidation of [U − 13C6]glucose tracer and the labeling pattern of TCA metabolites. (e) M + 2 and (f) M + 3 labeling patterns of the TCA metabolites are depicted under different concentrations of D‐alanine addition to Hela cells with mito‐DAAO at t = 2 hr
FIGURE 6
FIGURE 6
Computational model predicts mitochondrial NADPH/NADP+ ratio upon varying generation rates of H2O2 in mitochondria. (a) Unknown parameters were fitted to the experimental data of 50 mM D‐alanine to determine values consistent with the experimental data over 60 min timespan. (b) To assess the validity of these parameter values over a range of conditions, the fitted parameter values determined using the one condition in (a) were used to predict the binding fraction between NADPH and sensor (Ymodel) with different initial concentrations of D‐alanine and compared to the experimentally obtained value (Yexp) at t = 60 min. The blue square is the fitted condition, where the model and experiment must coincide. The red squares are not fit to the experimental data points. Upon different concentrations of D‐alanine used as input value, the model predicted (c) the intracellular H2O2 concentration in mitochondria, (d) NADPH, (e) and the NADPH/NADP+ ratio as a function of vH2O2tot at t = 60 min
FIGURE 7
FIGURE 7
Proposed models for glucose metabolism regulating compartmentalized NADPH pools upon mitochondrial or cytosolic oxidative stress. Overview of major reaction pathways for generation and consumption of mitochondrial and cytosolic NADPH, and cellular responses at (a) the baseline, or at conditions when cells were challenged with excessive production of (b) mitochondrial H2O2, or (c) cytosolic H2O2

References

    1. Esposito LA, Melov S, Panov A, Cottrell BA, Wallace DC. Mitochondrial disease in mouse results in increased oxidative stress. Proc Natl Acad Sci. 1999;96:4820‐4825. - PMC - PubMed
    1. Kang J, Pervaiz S. Mitochondria: redox metabolism and dysfunction. Biochem Res Int. 2012;2012:1‐14. - PMC - PubMed
    1. Shadel GS, Horvath TL. Mitochondrial ROS signaling in organismal homeostasis. Cell. 2015;163:560‐569. - PMC - PubMed
    1. Kohen R, Nyska A. Oxidation of biological systems: oxidative stress phenomena, antioxidants, redox reactions, and methods for their quantification. Toxicol Pathol. 2002;30:150‐180. - PubMed
    1. Wallace DC. A mitochondrial paradigm of metabolic and degenerative diseases, aging, and cancer: a dawn for evolutionary medicine. Annu Rev Genet. 2005;39:359‐407. - PMC - PubMed

LinkOut - more resources